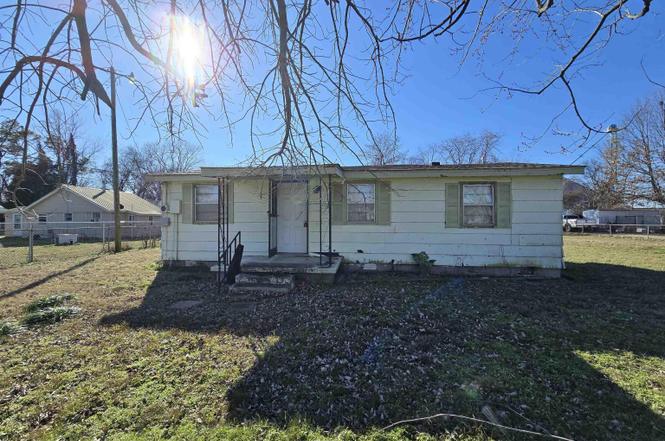
624 S Ozark Ave · Trumann, AR
Flood risk 1/10 · Minimal
- FEMA flood zone
- X
- Chance of flooding over 30 yrs
- 0.0%
- Est. flood insurance / yr
- $507 – $1,088
Fire risk 1/10 · Minimal
- Est. fire insurance / yr
- $1,499 – $2,785
Heat risk 6/10 · Moderate
- Hot days now (above 110°F)
- 7 days/yr
- Hot days in 30 yrs
- 21 days/yr
Wind risk 4/10 · Minor
- Chance of severe wind over 30 yrs
- 10.0%
Air-quality risk 1/10 · Minimal
- Unhealthy air days now
- 0 days/yr
- Unhealthy air days in 30 yrs
- 0 days/yr
Risk factors via First Street. Map © Google.
Why this score? — see what drove the B- grade
The composite is a weighted blend of 9 inputs, each scored 0–100. Each bar is that input's sub-score; the figure is the points it added to the 100-point composite (weight × sub-score).
- Cash flow +30.0/30.0
- 1% rule +10.0/10.0
- DSCR +10.0/10.0
- ARV discount +7.5/15.0
- Livability +2.9/5.0
- Rent growth +2.5/5.0
- Condition / age +2.5/5.0
- Schools +2.2/10.0
- Appreciation +1.7/10.0
$43,000
🖨 Deal sheet (PDF) 📄 Offer letter ✓ Due diligence
Listing remarks
Welcome to the market this super cute appx 828 sq ft, 3 bed/1 bath home just outside of Jonesboro and very close to the Trumann County Club in Trumann, Arkansas! Sitting on an almost half Acre lot, this appx 1972 built home is waiting for a beautiful restoration! On a paved road with all the city utilities already in place, this cute home could be used for a starter home for a small family or an investment as it would be ideal for a rental. At just 2 miles from the I-555 interstate, you could be in Jonesboro, AR in about 10 minutes or Memphis, TN in around 45 minutes making work commute to the closest major cities a breeze. This area is a well established community with neighbors remaining
Key facts
- City utilities
- Paved road
- 2 miles from i-555
Tags
Property features AI
Exterior
- Utilities: Public sewer; Public water; Electric (Co-Op); Natural gas
- Home design: Wood exterior
- Construction: Architectural shingle roof; Crawl space foundation
- Exterior features: Level lot; Paved road access
Interior
- Kitchen: Free-standing stove
- Flooring: Carpet; Tile
- Bathrooms: 1 full bathroom
- Heating & cooling: No central heating; No central cooling
- Interior features: Carpet and tile flooring; Free-standing stove
Neighborhood map
What this means for you Summary
Snapshot
- This is a 3-bed/1.0-bath single-family listed at $43k.
Deal economics
- At list price, monthly cash flow is $396 ($5k/yr) — positive.
- The deal already cash-flows at list — no discount required.
- Meets the 1% rule at list price ($856 rent vs $43k).
- Recommended offer: $38k (12.0% below list) — sets the bar for market timing.
- Cap rate 17.3% vs local median 4.5% in Trumann — top-decile yield for the area; either an underpriced asset or a hidden risk that comps aren't pricing in. Stress-test before assuming the spread holds.
Location & tenants
- Location reads 57/100 on livability (#353 in AR) — a working-class tenant base; expect higher turnover. Strengths: cost of living A+, housing A+; Watch: employment D, crime F, amenities F.
- Trumann School District (town): math 28% / reading 26% proficiency, ranked #178 of 238 in AR (top 75%) — low school quality limits family demand, transient renter base, plan for 1-2y turnover; 67% free/reduced lunch — lower-income household profile, screen leases tightly.
- Zoned schools: Cedar Park Elementary School (math 39% / reading 20%, grade F, #305 of 454 statewide, top 71%, 722 students, 100% FRL); Trumann Intermediate School7-8 (math 25% / reading 27%, grade F, #159 of 201 statewide, top 80%, 300 students, 100% FRL); Trumann High School (math 24% / reading 32%, grade F, #159 of 292 statewide, top 55%, 457 students, 100% FRL) — zoned schools average 100% FRL vs 67% district-wide (33 pts higher); higher-poverty schools than district average — tighter screening recommended.
- Market conditions: 71 active listings in the ZIP; 67 units permitted in Poinsett County in 2024 (5 in 5+ unit buildings).
Forward outlook
- Local home prices are declining (-3.0%/yr); year-one equity from $297 of loan paydown is wiped out by about $1k of value loss. Plan a longer hold.
- Poinsett County population projected at -13% by 2050 — secular population decline; favor cash flow + early exit over multi-decade hold.
- At projected returns (-3.0% appreciation + 3.0% rent growth), your $12k cash investment doubles in ~3 years — after that, you're playing with house money.
Negotiation context
- It's been on market 153 days — a 12% lower offer ($38k) is reasonable based on typical stale-listing flexibility.
Risks & watch-outs
- Climate carrying-cost: extreme-heat days projected 7→21/yr by 2055 (HVAC capex compounding) — expect insurance premiums to compound above CPI over the hold.
Questions for the listing agent
- It's been on market 153 days. Have you received any prior offers? Is the seller open to a 12% concession, seller financing, or rate buy-down credit?
- Built in 1972 — when were the roof, HVAC, electrical panel, plumbing, and water heater last replaced?
- Why hasn't it sold? Are there any deal-killer items the seller is aware of (foundation, flood, title, zoning, code violations)?
- Is there a deadline driving the sale (1031 exchange, divorce, estate, relocation)? That informs how much negotiation room exists.
- Schools are D-rated, which usually means shorter tenancies and higher turnover. Who's the typical renter profile here, and what's been the actual vacancy rate?
- Crime grade is F in this area — have there been break-ins, vandalism, or insurance claims at this property in the last 3 years? What carrier currently insures it and at what premium?
- What's the average days-on-market for RENTAL listings here right now (not sales)? A rising rental-DOM trend means longer vacancies and softer asking-rent achievability than the comps imply.
- What's the recent tenant-quality profile in this submarket — average credit score on applications, eviction rate, late-payment / NSF rate, and stable-employment percentage? A property-management company in the area should have these aggregated.
- How much new for-sale + rental construction is in the pipeline within 1–3 miles? Heavy new supply typically softens prices + rents 12–24 months out; constrained supply supports both.
Investment metrics
- 1% rule
- 1.99% ✓
- Cap rate
- 17.34%
- Cash-on-cash
- 39.45%
- DSCR
- 2.76
- GRM
- 4.2
CMA / ARV
- ARV (on-the-fly)
- $108,468
- Comps found
- 1
Show comp detail 1 sale within ~0.75 mi
| Address | Dist | Beds/Ba | Sqft | Sold | Price | $/sf | Match |
|---|---|---|---|---|---|---|---|
| 65 Boxwood Dr | 0.48mi | 3/1.0 | 950 (+15%) | 13mo | $124,900 | $131 | 42 |
Match score weights: distance 35% · size 25% · config 20% · recency 20%. Top-matched comps best support the ARV.
Projected returns pro-forma
-3.0% appreciation · 3.0% rent growth · sell at horizon
- IRR
- 35.7%
- Equity multiple
- 2.52×
- Total profit
- $18,247
- Equity at exit
- $6,411
- IRR
- 42.5%
- Equity multiple
- 5.02×
- Total profit
- $48,365
- Equity at exit
- $3,718
Cash invested: $12,040 (down + closing). Projections, not guarantees.
Landlord ↔ Tenant lean methodology
- Overall (STATE)
- 92 Strongly Landlord-Friendly
- State Arkansas
- 92 Strongly Landlord-Friendly · R+14
- County
- — inherits STATE
- City
- — inherits STATE
ZIP-level market 72472
- Home prices YoY
- -3.1%
- Active inventory
- 71
- Price-to-rent
- 4.2×
Monthly cashflow live
- Estimated rent
- $856 medium interval (Pro) →
- Mortgage (P&I)
- −$225
- Tax from tax record
- −$37 /mo · $447/yr
- Insurance
- −$18
- HOA
- −$0
- Vacancy / Maint / Mgmt
- −$180
- Net cashflow
- $396
Break-even live
Sensitivity live
| Price | -10% $420 | -5% $408 | +0% $396 | +5% $384 | +10% $372 |
|---|---|---|---|---|---|
| Rent | -10% $328 | -5% $362 | +0% $396 | +5% $430 | +10% $464 |
| Rate | -1.0pp $418 | -0.5pp $407 | base $396 | +0.5pp $385 | +1.0pp $373 |
UW: 25.0% down · 7.5% · 30yr · 1.5% tax · 5.0% vac · 8.0% maint · 8.0% mgmt
Financing live
Cash to close
- Down payment
- $10,750
- Closing costs
- $1,290
- Reserves months
- —
- Total cash needed
- —
Loan-product check · same deal, 3 products live
Conventional
25% down · 7.5% · 30yr
- Down + closing
- —
- Monthly P&I
- —
- Monthly cashflow
- —
- DSCR
- —
- Eligible?
- —
Personal DTI + credit; lowest rate.
DSCR
20% down · 8.5% · 30yr
- Down + closing
- —
- Monthly P&I
- —
- Monthly cashflow
- —
- DSCR
- —
- Eligible?
- —
No personal income docs; deal must DSCR.
Hard money
10% down · 12.0% · 12mo
- Down + closing
- —
- Monthly P&I
- —
- Monthly cashflow
- —
- DSCR
- —
- Eligible?
- —
Short-term bridge; refi at stabilization.
Listing history 20 events
-
2026-06-22days on market $43,000 Active 153 DOM
-
2026-06-19days on market $43,000 Active 151 DOM
-
2026-06-18days on market $43,000 Active 150 DOM
-
2026-06-17days on market $43,000 Active 149 DOM
-
2026-06-16days on market $43,000 Active 148 DOM
-
2026-06-15days on market $43,000 Active 147 DOM
-
2026-06-14days on market $43,000 Active 145 DOM
-
2026-06-13days on market $43,000 Active 144 DOM
-
2026-06-10days on market $43,000 Active 142 DOM
-
2026-06-09days on market $43,000 Active 141 DOM
-
2026-06-08days on market $43,000 Active 140 DOM
-
2026-06-07days on market $43,000 Active 139 DOM
-
2026-06-05days on market $43,000 Active 136 DOM
-
2026-06-02days on market $43,000 Active 134 DOM
-
2026-06-01days on market $43,000 Active 133 DOM
-
2026-05-31days on market $43,000 Active 132 DOM
-
2026-05-30days on market $43,000 Active 131 DOM
-
2026-03-17price $43,000
-
2026-02-24price $44,000
-
2026-01-19$44,900 New Listing
ⓘ Source: listings_history table (triggers on properties + properties_extension) + one-shot
backfill from property_details.listing_events for pre-trigger history.
Tax reassessment forecast AR · Resets to sale price
- Current annual tax
- $447 · $37/mo
- Projected year-2 tax
- $447 · $37/mo
- Expected delta
- $0/yr ($0/mo · 0.0%)
ⓘ Screening estimate from a state-policy table — verify with the county assessor before closing.
Climate risk First Street
- Flood 1/10 Low FEMA zone X · 0% chance over 30 yrs
- Wildfire 1/10 Low
- Heat 6/10 Major 7 d/yr ≥110°F today · 21 d/yr by 30 yrs out
- Wind 4/10 Moderate 10% chance of damaging wind over 30 yrs
- Air quality 1/10 Low 0 unhealthy d/yr today · 0 by 30 yrs out
Nearby sold comps map
Loading sold comps map…
Walkable amenities ~0.75 mi
Loading nearby amenities…
Taxation est. · year 1
- Rental income
- $10,276
- − Mortgage interest
- −$2,409
- − Property taxes
- −$447
- − Insurance
- −$215
- − Repairs & maintenance
- −$822
- − Management
- −$822
- − Depreciation
- −$1,251
- Taxable income
- $4,310
- Est. tax owed @ 24.0%
- −$1,034
- After-tax cash flow
- $3,716/yr
For passive investors: Depreciation is non-cash, so a rental often shows a tax loss while cash-flowing — sheltering income. Rental losses are passive: they offset passive income freely, and up to $25,000/yr can offset ordinary (W-2) income if you actively participate and your MAGI is under $100k (phasing out to $0 by $150k); unused losses carry forward. On sale, claimed depreciation is recaptured at up to 25%, and gains may owe capital-gains tax (a 1031 exchange can defer both). Figures are a year-1 estimate at your 24.0% rate — not tax advice; consult a CPA.
Schools (NCES district)
- District
- Trumann School District
- NCES district ID
- 0500047
- Math proficiency
- 28% ▼ -10.00%
- Reading proficiency
- 26% ▼ -7.00%
- Median HH income
- $35,307
- Composite
- 22.33/100
- National rank
- #8130
- State rank
- #178 of 238 in AR
Livability — Trumann
- Score
- 57/100
- State rank
- #353
- US rank
- #21973
Category grades
Schools grade is shown separately in the Schools card above.
Census & demographics
- Census place
- Trumann, AR
- Population (ZIP)
- 8,868
Population outlook (Poinsett County) Hauer SSP2
- Today (2025)
- 22,998 people
- By 2030
- 22,356 · -2.8%
- By 2040
- 21,150 · -8.0%
- By 2050
- 20,035 · -12.9%
- By 2075
- 17,745 · -22.8%
- By 2100
- 15,358 · -33.2%
Race, ethnicity, and origin ACS 2023
- Neighborhood character
- Predominantly White (85%)
- Race & ethnicity
- White 85% Two or more races 7% Black 7% Hispanic / Latino 3%
- Common ancestry
- Italian 1% Greek 1% Lithuanian 1%
- Foreign-born
- 1% · Canada
- Languages at home
- 98% English-only · Spanish 2%
Political lean MEDSL · Poinsett
- 2024 margin
- Solid R (+63.5) · D 17.4% · R 81.0% · Other 1.6%
- 2008→2024 swing
- -36.3pp toward R · 2008: -27.2pp · 2024: -63.5pp
- All cycles
- 2024: R+63.5 2020: R+59.8 2016: R+24.1 2012: R+34.2 2008: R+27.2
Not yet ingested
- Civics
- —
Market trends
- HPI YoY
- ▼ -6.69%
- Current HPI
- 208.64
- Rent YoY
- —
- Metro
- —
- State GDP YoY
- ▲ 3.80%
- F500 in state
- 10
Industry mix (Fortune 500 HQ in AR)
| Industry | F500 HQs | Revenue |
|---|---|---|
| Retail | 1 | $681B |
|
||
| Food / Agriculture | 1 | $53B |
|
||
| Retail / Energy | 1 | $22B |
|
||
| Transportation / Logistics | 1 | $12B |
|
||
| Energy | 1 | $4B |
|
||
Price history
-4.2% since first listed3 events — show timeline
- 2026-03-17 Price Changed $43,000 CARMLS
- 2026-02-24 Price Changed $44,000 CARMLS
- 2026-01-19 Listed $44,900 CARMLS
Property tax history
+2.7%/yrLatest (2025): $447 · +0.0% YoY. Source: county tax records.
Cash-flow waterfall
monthlySold comps — $/sqft
last 12 mo · ≤1 miLoading sold comps…