22 Red Oak Cir · Big Sandy, TN
Flood risk 1/10 · Minimal
- FEMA flood zone
- X (unshaded)
- Chance of flooding over 30 yrs
- 0.0%
- Est. flood insurance / yr
- $507 – $1,088
Fire risk 5/10 · Moderate
- Est. fire insurance / yr
- $949 – $1,763
Heat risk 5/10 · Moderate
- Hot days now (above 108°F)
- 7 days/yr
- Hot days in 30 yrs
- 20 days/yr
Wind risk 4/10 · Minor
- Chance of severe wind over 30 yrs
- 12.0%
Air-quality risk 1/10 · Minimal
- Unhealthy air days now
- 0 days/yr
- Unhealthy air days in 30 yrs
- 0 days/yr
Risk factors via First Street. Map © Google.
Why this score? — see what drove the D grade
The composite is a weighted blend of 9 inputs, each scored 0–100. Each bar is that input's sub-score; the figure is the points it added to the 100-point composite (weight × sub-score).
- Cash flow +11.5/30.0
- Appreciation +8.0/10.0
- ARV discount +7.5/15.0
- DSCR +3.4/10.0
- 1% rule +3.3/10.0
- Livability +2.9/5.0
- Rent growth +2.5/5.0
- Condition / age +2.5/5.0
- Schools +2.4/10.0
$115,000
🖨 Deal sheet (PDF) 📄 Offer letter ✓ Due diligence
Listing remarks
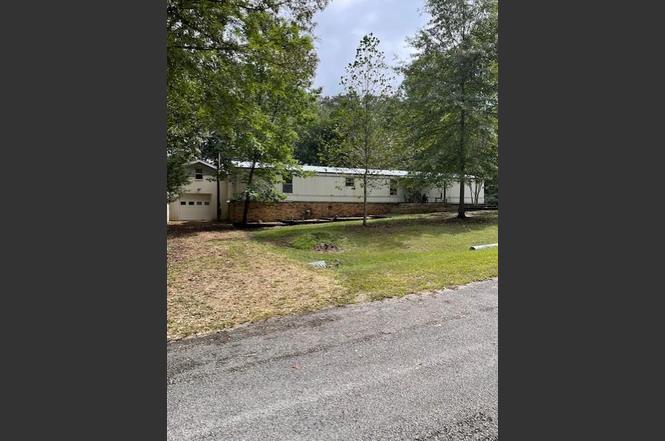
Immediate possession! 22 Red Oak Circle offers you a beautiful lake vacation home or forever home on a beautiful shaded 1/2 acre wooded lot. Quick access (. 3 mile) to a boat ramp into the beautiful Kentucky Lake, this home has new metal roof, solid brick underpinning, planters and walkways. Storage galore in detached 24' X 36' work shop and another new block 65' X 20' shop/garage with storage loft and office. Owner just completed a fresh power wash so its ready to go! Square footage per owner. Plan your viewing today!
Key facts
- New metal roof
- Lake vacation home
- Shaded wooded lot
Tags
Property features AI
Exterior
- Parking: Detached garage (1 covered space, 1 total garage space)
- Utilities: Public water; Septic tank; Cable available
- Home design: Residential mobile home (single wide)
- Construction: Aluminum siding; Metal roof; Other foundation; Built on crawl space
- Exterior features: Front porch; Rear porch; Storage; Waterfront lot with lake access; Paved road access
Interior
- Kitchen: Electric oven; Electric range; Refrigerator; Dishwasher; Microwave
- Flooring: Carpet; Vinyl
- Bathrooms: 2 full bathrooms
- Heating & cooling: Central heating; Central air; Ceiling fan cooling
- Interior features: Ceiling fans; Insulated windows; Storage
- Laundry & utility: Dryer
Neighborhood map
What this means for you Summary
Snapshot
- This is a 3-bed/2.0-bath other listed at $115k.
Deal economics
- At list price, monthly cash flow is $-37 ($-447/yr) — negative.
- To cash-flow at today's rent, offer at most $110k (4.7% below list).
- To meet the 1% rule (rent ≥ 1% of price), the offer needs to be $96k (16.6% below list).
- Recommended offer: $96k (16.6% below list) — sets the bar for 1% rule.
Location & tenants
- Location reads 58/100 on livability (#315 in TN) — a working-class tenant base; expect higher turnover. Strengths: cost of living A+, housing A-; Watch: crime F, amenities F, commute F.
- Benton County (town): math 31% / reading 28% proficiency, ranked #66 of 139 in TN (top 48%) — low school quality limits family demand, transient renter base, plan for 1-2y turnover.
- Zoned schools: Camden Jr High School (math 37% / reading 23%, grade F, #98 of 333 statewide, top 32%, 371 students, 0% FRL); Camden Central High School (math 8% / reading 37%, grade F, #156 of 332 statewide, top 49%, 521 students, 0% FRL) — zoned schools average 0% FRL vs 54% district-wide (54 pts lower); this property's tenant base skews higher-income than the district average.
- Market conditions: 93 active listings in the ZIP; 6 units permitted in Benton County in 2024 (0 in 5+ unit buildings).
Forward outlook
- In year one you build about $8k of equity ($795 loan paydown + $7k appreciation (6.0% local appreciation)).
- Benton County population projected at -18% by 2050 — secular population decline; favor cash flow + early exit over multi-decade hold.
- At projected returns (6.0% appreciation + 3.0% rent growth), your $32k cash investment doubles in ~4 years — after that, you're playing with house money.
- By year 5, paydown + projected appreciation supports a ~$34k cash-out refi (75% LTV) — recoverable capital for the next deal without selling this one.
Negotiation context
- It's been on market 266 days — a 12% lower offer ($101k) is reasonable based on typical stale-listing flexibility.
Risks & watch-outs
- Climate carrying-cost: moderate wildfire risk; extreme-heat days projected 7→20/yr by 2055 (HVAC capex compounding) — expect insurance premiums to compound above CPI over the hold.
Questions for the listing agent
- What do current leases actually rent for vs. the listed asking? Can we see a recent rent roll and the last 12 months of T-12 income?
- It's been on market 266 days. Have you received any prior offers? Is the seller open to a 17% concession, seller financing, or rate buy-down credit?
- Why hasn't it sold? Are there any deal-killer items the seller is aware of (foundation, flood, title, zoning, code violations)?
- Is there a deadline driving the sale (1031 exchange, divorce, estate, relocation)? That informs how much negotiation room exists.
- Schools are F-rated, which usually means shorter tenancies and higher turnover. Who's the typical renter profile here, and what's been the actual vacancy rate?
- Crime grade is F in this area — have there been break-ins, vandalism, or insurance claims at this property in the last 3 years? What carrier currently insures it and at what premium?
- The area grade is low — what's the realistic commute time and amenity access for the typical tenant pool here? Any planned neighborhood developments (good or bad) we should know about?
- What's the average days-on-market for RENTAL listings here right now (not sales)? A rising rental-DOM trend means longer vacancies and softer asking-rent achievability than the comps imply.
- What's the recent tenant-quality profile in this submarket — average credit score on applications, eviction rate, late-payment / NSF rate, and stable-employment percentage? A property-management company in the area should have these aggregated.
- How much new for-sale + rental construction is in the pipeline within 1–3 miles? Heavy new supply typically softens prices + rents 12–24 months out; constrained supply supports both.
Investment metrics
- 1% rule
- 0.83% ✗
- Cap rate
- 5.90%
- Cash-on-cash
- -1.39%
- DSCR
- 0.94
- GRM
- 10.0
CMA / ARV
No comps found within radius.
Projected returns pro-forma
5.97% appreciation · 3.0% rent growth · sell at horizon
- IRR
- 14.2%
- Equity multiple
- 1.95×
- Total profit
- $30,605
- Equity at exit
- $72,038
- IRR
- 14.5%
- Equity multiple
- 3.86×
- Total profit
- $91,970
- Equity at exit
- $130,417
Cash invested: $32,200 (down + closing). Projections, not guarantees.
Landlord ↔ Tenant lean methodology
- Overall (STATE)
- 87 Strongly Landlord-Friendly
- State Tennessee
- 87 Strongly Landlord-Friendly · R+13
- County
- — inherits STATE
- City
- — inherits STATE
ZIP-level market 38221
- Home prices YoY
- 2.7%
- Active inventory
- 93
- Price-to-rent
- 10.0×
Monthly cashflow live
- Estimated rent
- $959 medium interval (Pro) →
- Mortgage (P&I)
- −$603
- Tax est. 1.5%
- −$144 /mo · $1,725/yr
- Insurance
- −$48
- HOA
- −$0
- Vacancy / Maint / Mgmt
- −$201
- Net cashflow
- $-37
Break-even live
Sensitivity live
| Price | -10% $42 | -5% $2 | +0% $-37 | +5% $-77 | +10% $-117 |
|---|---|---|---|---|---|
| Rent | -10% $-113 | -5% $-75 | +0% $-37 | +5% $1 | +10% $39 |
| Rate | -1.0pp $21 | -0.5pp $-8 | base $-37 | +0.5pp $-67 | +1.0pp $-97 |
UW: 25.0% down · 7.5% · 30yr · 1.5% tax · 5.0% vac · 8.0% maint · 8.0% mgmt
Financing live
Cash to close
- Down payment
- $28,750
- Closing costs
- $3,450
- Reserves months
- —
- Total cash needed
- —
Loan-product check · same deal, 3 products live
Conventional
25% down · 7.5% · 30yr
- Down + closing
- —
- Monthly P&I
- —
- Monthly cashflow
- —
- DSCR
- —
- Eligible?
- —
Personal DTI + credit; lowest rate.
DSCR
20% down · 8.5% · 30yr
- Down + closing
- —
- Monthly P&I
- —
- Monthly cashflow
- —
- DSCR
- —
- Eligible?
- —
No personal income docs; deal must DSCR.
Hard money
10% down · 12.0% · 12mo
- Down + closing
- —
- Monthly P&I
- —
- Monthly cashflow
- —
- DSCR
- —
- Eligible?
- —
Short-term bridge; refi at stabilization.
Listing history 21 events
-
2026-06-21days on market $115,000 Active 266 DOM
-
2026-06-18days on market $115,000 Active 264 DOM
-
2026-06-17days on market $115,000 Active 263 DOM
-
2026-06-16days on market $115,000 Active 262 DOM
-
2026-06-15days on market $115,000 Active 261 DOM
-
2026-06-13days on market $115,000 Active 259 DOM
-
2026-06-12days on market $115,000 Active 258 DOM
-
2026-06-09days on market $115,000 Active 255 DOM
-
2026-06-08days on market $115,000 Active 254 DOM
-
2026-06-08days on market $115,000 Active 253 DOM
-
2026-06-07days on market $115,000 Active 252 DOM
-
2026-06-04days on market $115,000 Active 249 DOM
-
2026-06-03price $115,000 Active 248 DOM
-
2026-06-02days on market $119,000 Active 248 DOM
-
2026-06-01days on market $119,000 Active 247 DOM
-
2026-05-31days on market $119,000 Active 246 DOM
-
2026-04-24price $119,000
-
2026-03-27price $129,000
-
2026-03-17price $135,000
-
2025-10-24price $140,000
-
2025-09-28$145,000 Active
ⓘ Source: listings_history table (triggers on properties + properties_extension) + one-shot
backfill from property_details.listing_events for pre-trigger history.
Climate risk First Street
- Flood 1/10 Low FEMA zone X (unshaded) · 0% chance over 30 yrs
- Wildfire 5/10 Major
- Heat 5/10 Major 7 d/yr ≥108°F today · 20 d/yr by 30 yrs out
- Wind 4/10 Moderate 12% chance of damaging wind over 30 yrs
- Air quality 1/10 Low 0 unhealthy d/yr today · 0 by 30 yrs out
Nearby sold comps map
Loading sold comps map…
Walkable amenities ~0.75 mi
Loading nearby amenities…
Taxation est. · year 1
- Rental income
- $11,506
- − Mortgage interest
- −$6,442
- − Property taxes
- −$1,725
- − Insurance
- −$575
- − Repairs & maintenance
- −$920
- − Management
- −$920
- − Depreciation
- −$3,345
- Taxable loss
- −$2,422
- Est. tax savings @ 24.0%
- +$581
- After-tax cash flow
- $134/yr
For passive investors: Depreciation is non-cash, so a rental often shows a tax loss while cash-flowing — sheltering income. Rental losses are passive: they offset passive income freely, and up to $25,000/yr can offset ordinary (W-2) income if you actively participate and your MAGI is under $100k (phasing out to $0 by $150k); unused losses carry forward. On sale, claimed depreciation is recaptured at up to 25%, and gains may owe capital-gains tax (a 1031 exchange can defer both). Figures are a year-1 estimate at your 24.0% rate — not tax advice; consult a CPA.
Schools (NCES district)
- District
- Benton County
- NCES district ID
- 4700240
- Math proficiency
- 31% ▼ -8.00%
- Reading proficiency
- 28% ▼ -7.00%
- Median HH income
- $33,587
- Composite
- 24.24/100
- National rank
- #7722
- State rank
- #66 of 139 in TN
Livability — Big Sandy
- Score
- 58/100
- State rank
- #315
- US rank
- #21412
Category grades
Schools grade is shown separately in the Schools card above.
Census & demographics
- Population (ZIP)
- 3,046
Population outlook (Benton County) Hauer SSP2
- Today (2025)
- 15,046 people
- By 2030
- 14,425 · -4.1%
- By 2040
- 13,296 · -11.6%
- By 2050
- 12,298 · -18.3%
- By 2075
- 10,347 · -31.2%
- By 2100
- 8,594 · -42.9%
Race, ethnicity, and origin ACS 2023
- Neighborhood character
- Predominantly White (96%)
- Race & ethnicity
- White 96% Two or more races 2% Hispanic / Latino 2%
- Common ancestry
- Slovak 2% Lithuanian 2% Serbian 1%
- Foreign-born
- 1% · Canada
- Languages at home
- 98% English-only · German/W. Germanic 1% Russian/Polish/Slavic 1%
Political lean MEDSL · Benton
- 2024 margin
- Solid R (+62.9) · D 18.1% · R 81.1%
- 2008→2024 swing
- -46.7pp toward R · 2008: -16.2pp · 2024: -62.9pp
- All cycles
- 2024: R+62.9 2020: R+57.0 2016: R+51.3 2012: R+25.6 2008: R+16.2
Not yet ingested
- Civics
- —
Market trends
- HPI YoY
- ▲ 5.97%
- Current HPI
- 230.2855
- Rent YoY
- —
- Metro
- —
- State GDP YoY
- ▲ 2.78%
- F500 in state
- 22
Industry mix (Fortune 500 HQ in TN)
| Industry | F500 HQs | Revenue |
|---|---|---|
| Healthcare | 3 | $91B |
|
||
| Retail | 3 | $72B |
|
||
| Transportation / Logistics | 1 | $88B |
|
||
| Paper / Packaging | 1 | $19B |
|
||
| Insurance | 1 | $13B |
|
||
| Energy | 1 | $12B |
|
||
Price history
-17.9% since first listed5 events — show timeline
- 2026-04-24 Price Changed $119,000 TVAR
- 2026-03-27 Price Changed $129,000 TVAR
- 2026-03-17 Price Changed $135,000 TVAR
- 2025-10-24 Price Changed $140,000 TVAR
- 2025-09-28 Listed $145,000 TVAR
Property tax history
-3.4%/yrLatest (2025): $146 · -16.1% YoY. Source: county tax records.
Cash-flow waterfall
monthlySold comps — $/sqft
last 12 mo · ≤1 miLoading sold comps…