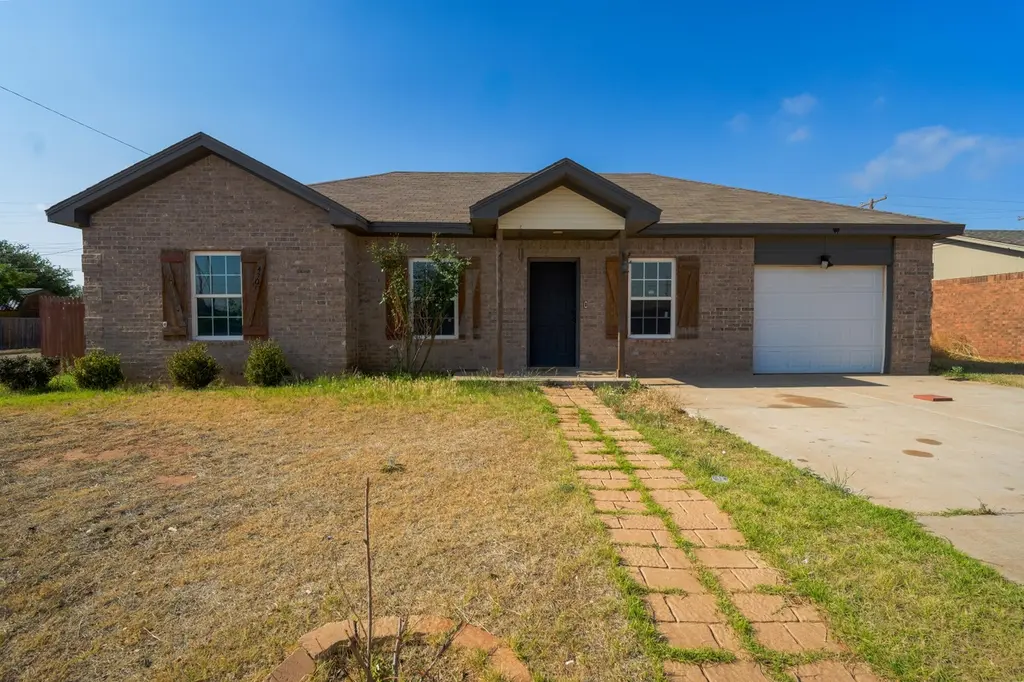
4701 Marshall St · Lubbock, TX
Flood risk 1/10 · Minimal
- FEMA flood zone
- X (unshaded)
- Chance of flooding over 30 yrs
- 0.0%
- Est. flood insurance / yr
- $507 – $1,088
Fire risk 3/10 · Minor
- Est. fire insurance / yr
- $1,222 – $2,270
Heat risk 5/10 · Moderate
- Hot days now (above 99°F)
- 7 days/yr
- Hot days in 30 yrs
- 21 days/yr
Wind risk 2/10 · Minimal
- Chance of severe wind over 30 yrs
- —
Air-quality risk 2/10 · Minimal
- Unhealthy air days now
- 1 days/yr
- Unhealthy air days in 30 yrs
- 1 days/yr
Risk factors via First Street. Map © Google.
Why this score? — see what drove the C- grade
The composite is a weighted blend of 9 inputs, each scored 0–100. Each bar is that input's sub-score; the figure is the points it added to the 100-point composite (weight × sub-score).
- Cash flow +20.0/30.0
- ARV discount +7.5/15.0
- 1% rule +6.6/10.0
- DSCR +6.3/10.0
- Livability +4.0/5.0
- Rent growth +3.1/5.0
- Schools +3.1/10.0
- Condition / age +2.5/5.0
- Appreciation +0.0/10.0
$124,500
🖨 Deal sheet (PDF) 📄 Offer letter ✓ Due diligence
Listing remarks
Newer-build 3 bedroom, 1 bath home located in a desirable neighborhood! This well-maintained property offers a great opportunity for both homeowners and investors alike. Previously rented for $1,300 per month, the home is now vacant and ready for immediate occupancy. Featuring a functional layout, comfortable living spaces, and a convenient location, this property would make an excellent primary residence or addition to an investment portfolio. Don't miss this versatile opportunity!
Key facts
- 8,347 sq ft lot
- Built 2019
- Listed 24 days
Property features AI
Exterior
- Parking: Driveway
- Security: 24-hour security
- Utilities: Public water; Public sewer
- Home design: Single-family residence; Residential property; Zoned for single-family
- Construction: Board & batten siding; Brick veneer; Composition roof; Slab foundation; Built area approximately 1,120 above-grade
- Exterior features: Private yard; Fenced backyard; Concrete road access
Interior
- Kitchen: Dishwasher; Free-standing electric range; Refrigerator
- Flooring: Vinyl
- Bathrooms: 1 full bathroom
- Heating & cooling: Central heating; Central air; Ceiling fan(s) (also listed under interior features)
- Interior features: Ceiling fans; Double-pane windows
- Laundry & utility: Electric water heater
Neighborhood map
What this means for you Summary
Snapshot
- This is a 3-bed/1.0-bath single-family listed at $124k.
Deal economics
- At list price, monthly cash flow is $152 ($2k/yr) — positive.
- The deal already cash-flows at list — no discount required.
- Meets the 1% rule at list price ($1k rent vs $124k).
- Recommended offer: $123k (1.5% below list) — sets the bar for market timing.
Location & tenants
- Location reads 80/100 on livability (#37 in TX, #1,749 nationally) — a professional / high-income tenant draw. Strengths: commute A+, cost of living A+, housing A+; Watch: employment C-, crime F.
- Lubbock ISD (urban): math 36% / reading 39% proficiency, ranked #481 of 826 in TX (top 58%) — families likely to look elsewhere, expect single-tenant / working-renter base with shorter leases; 60% free/reduced lunch — lower-income household profile, screen leases tightly.
- Zoned schools: Centennial El (math 38% / reading 36%, grade F, #1,769 of 4,322 statewide, top 44%, 618 students, 84% FRL); Mackenzie Middle (math 19% / reading 27%, grade F, #1,327 of 1,662 statewide, top 81%, 515 students, 88% FRL); Coronado H S (math 34% / reading 38%, grade F, #930 of 1,632 statewide, top 57%, 1,960 students, 66% FRL) — zoned schools average 79% FRL vs 60% district-wide (19 pts higher); higher-poverty schools than district average — tighter screening recommended.
- Market conditions: Rents rising (+2.2%/yr); 464 active listings in the ZIP; 40 comparable units currently listed for rent nearby; rentals lingering (median 45d on market — plan ~5-8 weeks vacancy on turnover, expect pricing pressure); 58% of comp listings sitting > 30 days — soft ceiling on asking rent; 2,219 units permitted in Lubbock County in 2024 (252 in 5+ unit buildings).
Forward outlook
- Local home prices are declining (-3.0%/yr); year-one equity from $861 of loan paydown is wiped out by about $4k of value loss. Plan a longer hold.
- Lubbock County population projected at +39% by 2050 — long-run rental-demand tailwind backs the buy-and-hold thesis.
Negotiation context
- It's been on market 24 days — a 2% lower offer ($123k) is reasonable based on typical stale-listing flexibility.
Risks & watch-outs
- Watch-outs: property tax is 2.7% of price.
- Climate carrying-cost: extreme-heat days projected 7→21/yr by 2055 (HVAC capex compounding) — expect insurance premiums to compound above CPI over the hold.
Questions for the listing agent
- Property tax is high relative to price — has the assessment been appealed recently, and will the sale trigger a re-assessment?
- Is there a deadline driving the sale (1031 exchange, divorce, estate, relocation)? That informs how much negotiation room exists.
- Schools are D-rated, which usually means shorter tenancies and higher turnover. Who's the typical renter profile here, and what's been the actual vacancy rate?
- Crime grade is F in this area — have there been break-ins, vandalism, or insurance claims at this property in the last 3 years? What carrier currently insures it and at what premium?
- What's the average days-on-market for RENTAL listings here right now (not sales)? A rising rental-DOM trend means longer vacancies and softer asking-rent achievability than the comps imply.
- What's the recent tenant-quality profile in this submarket — average credit score on applications, eviction rate, late-payment / NSF rate, and stable-employment percentage? A property-management company in the area should have these aggregated.
- How much new for-sale + rental construction is in the pipeline within 1–3 miles? Heavy new supply typically softens prices + rents 12–24 months out; constrained supply supports both.
Investment metrics
- 1% rule
- 1.16% ✓
- Cap rate
- 7.76%
- Cash-on-cash
- 5.25%
- DSCR
- 1.23
- GRM
- 7.2
CMA / ARV
No comps found within radius.
Projected returns pro-forma
-3.0% appreciation · 2.21% rent growth · sell at horizon
- IRR
- -9.1%
- Equity multiple
- 0.67×
- Total profit
- $-11,501
- Equity at exit
- $18,563
- IRR
- -0.7%
- Equity multiple
- 0.95×
- Total profit
- $-1,699
- Equity at exit
- $10,764
Cash invested: $34,860 (down + closing). Projections, not guarantees.
Landlord ↔ Tenant lean methodology
- Overall (STATE)
- 87 Strongly Landlord-Friendly
- State Texas
- 87 Strongly Landlord-Friendly · R+5
- County
- — inherits STATE
- City
- — inherits STATE
ZIP-level market 79416
- Home prices YoY
- -20.0%
- Rents YoY
- 2.2%
- Active inventory
- 464
- Price-to-rent
- 7.2×
Monthly cashflow live
- Estimated rent
- $1,441 high interval (Pro) →
- Mortgage (P&I)
- −$653
- Tax from tax record
- −$281 /mo · $3,376/yr
- Insurance
- −$52
- HOA
- −$0
- Vacancy / Maint / Mgmt
- −$303
- Net cashflow
- $152
Break-even live
Sensitivity live
| Price | -10% $223 | -5% $188 | +0% $152 | +5% $117 | +10% $82 |
|---|---|---|---|---|---|
| Rent | -10% $39 | -5% $96 | +0% $152 | +5% $209 | +10% $266 |
| Rate | -1.0pp $215 | -0.5pp $184 | base $152 | +0.5pp $120 | +1.0pp $87 |
UW: 25.0% down · 7.5% · 30yr · 1.5% tax · 5.0% vac · 8.0% maint · 8.0% mgmt
Financing live
Cash to close
- Down payment
- $31,125
- Closing costs
- $3,735
- Reserves months
- —
- Total cash needed
- —
Loan-product check · same deal, 3 products live
Conventional
25% down · 7.5% · 30yr
- Down + closing
- —
- Monthly P&I
- —
- Monthly cashflow
- —
- DSCR
- —
- Eligible?
- —
Personal DTI + credit; lowest rate.
DSCR
20% down · 8.5% · 30yr
- Down + closing
- —
- Monthly P&I
- —
- Monthly cashflow
- —
- DSCR
- —
- Eligible?
- —
No personal income docs; deal must DSCR.
Hard money
10% down · 12.0% · 12mo
- Down + closing
- —
- Monthly P&I
- —
- Monthly cashflow
- —
- DSCR
- —
- Eligible?
- —
Short-term bridge; refi at stabilization.
Rent comps 40 comps
| Address | Beds | Baths | Sqft | Rent | $/sqft | DOM | Units | Dist |
|---|---|---|---|---|---|---|---|---|
| 4530 Marshall St Lubbock, TX | 4.0 | 2.0 | 1106 | $1,600 | $1.45 | 14d | 1 | 0.09mi |
| 4512 Lehigh St Lubbock, TX | 2.0 | 1.0 | 720 | $800 | $1.11 | 44d | 1 | 0.18mi |
| 4605 Harvard St Lubbock, TX | 3.0 | 2.0 | 1362 | $1,400 | $1.03 | 22d | 1 | 0.29mi |
| 4412 Kemper St Lubbock, TX | 3.0 | 2.0 | 1157 | $1,250 | $1.08 | 44d | 1 | 0.32mi |
| 4615 Grinnell St Lubbock, TX | 3.0 | 1.5 | 1446 | $1,474 | $1.02 | 44d | 1 | 0.33mi |
| 4615 Grinnell St Lubbock, TX | 3.0 | 1.5 | 1446 | $1,700 | $1.18 | 14d | 1 | 0.33mi |
| 4638 Erskine St Lubbock, TX | 2.0 | 2.0 | 949 | $1,100 | $1.16 | 22d | 1 | 0.41mi |
| 212 N Troy Ave Unit B Lubbock, TX | 2.0 | 1.0 | 800 | $775 | $0.97 | 22d | 1 | 0.86mi |
| 201 N Troy Ave Unit A Lubbock, TX | 2.0 | 1.0 | 818 | $875 | $1.07 | 44d | 1 | 0.91mi |
| 201 N Troy Ave Unit A Lubbock, TX | 2.0 | 1.0 | 818 | $875 | $1.07 | 22d | 1 | 0.91mi |
| 139 N Troy Ave Unit B Lubbock, TX | 2.0 | 1.0 | 818 | $725 | $0.89 | 22d | 1 | 0.93mi |
| 908 N Belmont Ave Unit A Lubbock, TX | 3.0 | 3.0 | 1366 | $1,175 | $0.86 | 44d | 1 | 0.94mi |
| 906 N Belmont Ave Lubbock, TX | 3.0 | 3.0 | 1366 | $1,225 | $0.90 | 44d | 1 | 0.94mi |
| 128 N Troy Ave Lubbock, TX | 2.0 | 1.0 | 800 | $899 | $1.12 | 14d | 1 | 0.97mi |
| 602 N Belmont Ave Lubbock, TX | 3.0 | 3.0 | 1370 | $1,325 | $0.97 | 14d | 3 | 1.01mi |
| 3701 Clovis Rd Lubbock, TX | 1.0–2.0 | 1.0–2.0 | 833 | $1,400 | $1.68 | 14d | 19 | 1.04mi |
| 5420 Kemper St Lubbock, TX | 3.0 | 3.0 | 1381 | $1,175 | $0.85 | 44d | 1 | 1.07mi |
| 1217 N Chicago Ave Unit A Lubbock, TX | 3.0 | 2.0 | 1375 | $1,400 | $1.02 | 44d | 1 | 1.12mi |
| 5501 Jarvis St Unit A Lubbock, TX | 3.0 | 2.0 | 1445 | $1,450 | $1.00 | 22d | 1 | 1.13mi |
| 5504 Itasca St Unit B Lubbock, TX | 3.0 | 3.0 | 1445 | $1,500 | $1.04 | 44d | 1 | 1.13mi |
| 1309 N Chicago Ave Lubbock, TX | 3.0 | 2.0 | 1450 | $1,745 | $1.20 | 14d | 1 | 1.13mi |
| 1315 N Chicago Ave Lubbock, TX | 3.0 | 2.0 | 1450 | $1,745 | $1.20 | 22d | 1 | 1.13mi |
| 1415 N Knoxville Ave Lubbock, TX | 3.0–4.0 | 2.0 | 1291 | $934 | $0.72 | 14d | 1 | 1.14mi |
| 5506 Itasca St Unit A Lubbock, TX | 3.0 | 3.0 | 1445 | $1,500 | $1.04 | 44d | 1 | 1.15mi |
| 5511 Itasca St Lubbock, TX | 4.0 | 4.0 | 1348 | $2,000 | $1.48 | 14d | 1 | 1.16mi |
| 5513 Itasca St Lubbock, TX | 3.0 | 3.0 | 1368 | $1,500 | $1.10 | 44d | 1 | 1.17mi |
| 1303 N Clinton Ave Unit A Lubbock, TX | 3.0 | 2.0 | 1375 | $1,495 | $1.09 | 44d | 1 | 1.18mi |
| 5515 Kemper St Unit A Lubbock, TX | 3.0 | 2.0 | 1350 | $1,425 | $1.06 | 44d | 1 | 1.19mi |
| 522 N Chicago Ave Unit B Lubbock, TX | 3.0 | 3.0 | 1370 | $1,200 | $0.88 | 44d | 1 | 1.19mi |
| 516 N Chicago Ave Unit B Lubbock, TX | 3.0 | 3.0 | 1370 | $1,200 | $0.88 | 44d | 1 | 1.21mi |
| 310 N Brentwood Ave Unit B Lubbock, TX | 3.0 | 3.0 | 1400 | $1,250 | $0.89 | 44d | 1 | 1.22mi |
| 5516 Itasca St Lubbock, TX | 3.0 | 3.0 | 1360 | $1,500 | $1.10 | 44d | 1 | 1.22mi |
| 503 N Brentwood Ave Unit B Lubbock, TX | 3.0 | 3.0 | 1370 | $1,200 | $0.88 | 44d | 1 | 1.22mi |
| 1303 N Colton Ave Unit B Lubbock, TX | 3.0 | 2.0 | 1445 | $1,275 | $0.88 | 44d | 1 | 1.23mi |
| 533 N Clinton Ave Unit B Lubbock, TX | 3.0 | 3.0 | 1340 | $1,300 | $0.97 | 44d | 1 | 1.24mi |
| 5549 Lehigh St Lubbock, TX | 2.0 | 2.0 | 1500 | $1,550 | $1.03 | 22d | 1 | 1.26mi |
| 523 N Clinton Ave Unit Clinton Side A Lubbock, TX | 3.0 | 3.0 | 1435 | $1,295 | $0.90 | 22d | 1 | 1.26mi |
| 5524 Jarvis St Unit B Lubbock, TX | 3.0 | 2.0 | 1445 | $1,400 | $0.97 | 44d | 1 | 1.27mi |
| 505 N Chicago Ave Lubbock, TX | 3.0 | 3.0 | 1435 | $1,425 | $0.99 | 44d | 1 | 1.27mi |
| 505 N Chicago Ave Unit B Lubbock, TX | 3.0 | 3.0 | 1435 | $1,325 | $0.92 | 44d | 1 | 1.27mi |
Listing history 25 events
-
2026-06-18days on market $124,500 Active 24 DOM
-
2026-06-17price $124,500 Active 23 DOM
-
2026-06-17days on market $129,000 Active 23 DOM
-
2026-06-16days on market $129,000 Active 22 DOM
-
2026-06-15days on market $129,000 Active 21 DOM
-
2026-06-14days on market $129,000 Active 19 DOM
-
2026-06-13days on market $129,000 Active 18 DOM
-
2026-06-10days on market $129,000 Active 16 DOM
-
2026-06-09days on market $129,000 Active 15 DOM
-
2026-06-08days on market $129,000 Active 14 DOM
-
2026-06-07days on market $129,000 Active 13 DOM
-
2026-06-05days on market $129,000 Active 10 DOM
-
2026-06-03days on market $129,000 Active 9 DOM
-
2026-06-03price $129,000 Active 8 DOM
-
2026-06-02days on market $135,000 Active 8 DOM
-
2026-06-01days on market $135,000 Active 7 DOM
-
2026-05-31days on market $135,000 Active 6 DOM
-
2026-05-30days on market $135,000 Active 5 DOM
-
2026-05-25$135,000 Active
-
2025-12-18price $150,000
-
2025-11-22price $170,000
-
2025-07-28price $185,000
-
2025-07-08price $190,000
-
2020-07-07soldstatus
-
1993-12-01soldstatus
ⓘ Source: listings_history table (triggers on properties + properties_extension) + one-shot
backfill from property_details.listing_events for pre-trigger history.
Tax reassessment forecast TX · Resets to sale price
- Current annual tax
- $3,376 · $281/mo
- Projected year-2 tax
- $3,376 · $281/mo
- Expected delta
- $0/yr ($0/mo · 0.0%)
ⓘ Screening estimate from a state-policy table — verify with the county assessor before closing.
Climate risk First Street
- Flood 1/10 Low FEMA zone X (unshaded) · 0% chance over 30 yrs
- Wildfire 3/10 Moderate
- Heat 5/10 Major 7 d/yr ≥99°F today · 21 d/yr by 30 yrs out
- Wind 2/10 Low
- Air quality 2/10 Low 1 unhealthy d/yr today · 1 by 30 yrs out
Nearby sold comps map
Loading sold comps map…
Walkable amenities ~0.75 mi
Loading nearby amenities…
Taxation est. · year 1
- Rental income
- $17,295
- − Mortgage interest
- −$6,974
- − Property taxes
- −$3,376
- − Insurance
- −$622
- − Repairs & maintenance
- −$1,384
- − Management
- −$1,384
- − Depreciation
- −$3,622
- Taxable loss
- −$67
- Est. tax savings @ 24.0%
- +$16
- After-tax cash flow
- $1,846/yr
For passive investors: Depreciation is non-cash, so a rental often shows a tax loss while cash-flowing — sheltering income. Rental losses are passive: they offset passive income freely, and up to $25,000/yr can offset ordinary (W-2) income if you actively participate and your MAGI is under $100k (phasing out to $0 by $150k); unused losses carry forward. On sale, claimed depreciation is recaptured at up to 25%, and gains may owe capital-gains tax (a 1031 exchange can defer both). Figures are a year-1 estimate at your 24.0% rate — not tax advice; consult a CPA.
Schools (NCES district)
- District
- Lubbock ISD
- NCES district ID
- 4828500
- Math proficiency
- 36% ▼ -8.00%
- Reading proficiency
- 39% ▼ -1.00%
- Median HH income
- $39,820
- Composite
- 31.44/100
- National rank
- #5984
- State rank
- #481 of 826 in TX
Livability — Lubbock
- Score
- 80/100
- State rank
- #37
- US rank
- #1749
Category grades
Schools grade is shown separately in the Schools card above.
Census & demographics
- Census place
- Lubbock, TX
- County
- Lubbock County · 293,542 people
- City population
- 283,030
- Metro
- Lubbock, TX
- Population (ZIP)
- 36,442
- Household income
- $63,896
- Rent vs Own
- Severe rent burden
- 2214.0
Population outlook (Lubbock County) Hauer SSP2
- Today (2025)
- 345,960 people
- By 2030
- 371,449 · +7.4%
- By 2040
- 424,539 · +22.7%
- By 2050
- 481,150 · +39.1%
- By 2075
- 633,467 · +83.1%
- By 2100
- 746,853 · +115.9%
Race, ethnicity, and origin ACS 2023
- Neighborhood character
- Diverse neighborhood (Simpson 0.62)
- Race & ethnicity
- White 49% Hispanic / Latino 35% Two or more races 14% Black 9% Asian 3%
- Hispanic origin (detail)
- Mexican 28%
- Common ancestry
- Slovak 3% Italian 1% Serbian 1%
- Foreign-born
- 7% · Canada, China, South Korea
- Languages at home
- 81% English-only · Spanish 13% Chinese 1% Tagalog/Filipino 1%
Political lean MEDSL · Lubbock
- 2024 margin
- Solid R (+39.5) · D 29.7% · R 69.2% · Other 1.0%
- 2008→2024 swing
- -2.8pp toward R · 2008: -36.7pp · 2024: -39.5pp
- All cycles
- 2024: R+39.5 2020: R+32.2 2016: R+38.4 2012: R+40.9 2008: R+36.7
Not yet ingested
- Civics
- —
Market trends
- HPI YoY
- ▼ -56.94%
- Current HPI
- 227.7841
- Rent YoY
- ▲ 2.21%
- Metro
- Lubbock, TX
- State GDP YoY
- ▲ 3.95%
- F500 in state
- 110
Industry mix (Fortune 500 HQ in TX)
| Industry | F500 HQs | Revenue |
|---|---|---|
| Energy | 16 | $1,198B |
|
||
| Technology | 5 | $198B |
|
||
| Engineering / Construction | 4 | $72B |
|
||
| Energy Services | 3 | $60B |
|
||
| Utilities | 3 | $41B |
|
||
| Healthcare | 2 | $330B |
|
||
Price history
-28.9% since first listed7 events — show timeline
- 2026-05-25 Listed $135,000 LARMLS
- 2025-12-18 Price Changed $150,000 LARMLS
- 2025-11-22 Price Changed $170,000 LARMLS
- 2025-07-28 Price Changed $185,000 LARMLS
- 2025-07-08 Price Changed $190,000 LARMLS
- 2020-07-07 Sold (Public Records) — Public Records
- 1993-12-01 Sold (Public Records) — Public Records
Property tax history
+39.0%/yrLatest (2025): $3,376 · +7.2% YoY. Source: county tax records.
Cash-flow waterfall
monthlySold comps — $/sqft
last 12 mo · ≤1 miLoading sold comps…