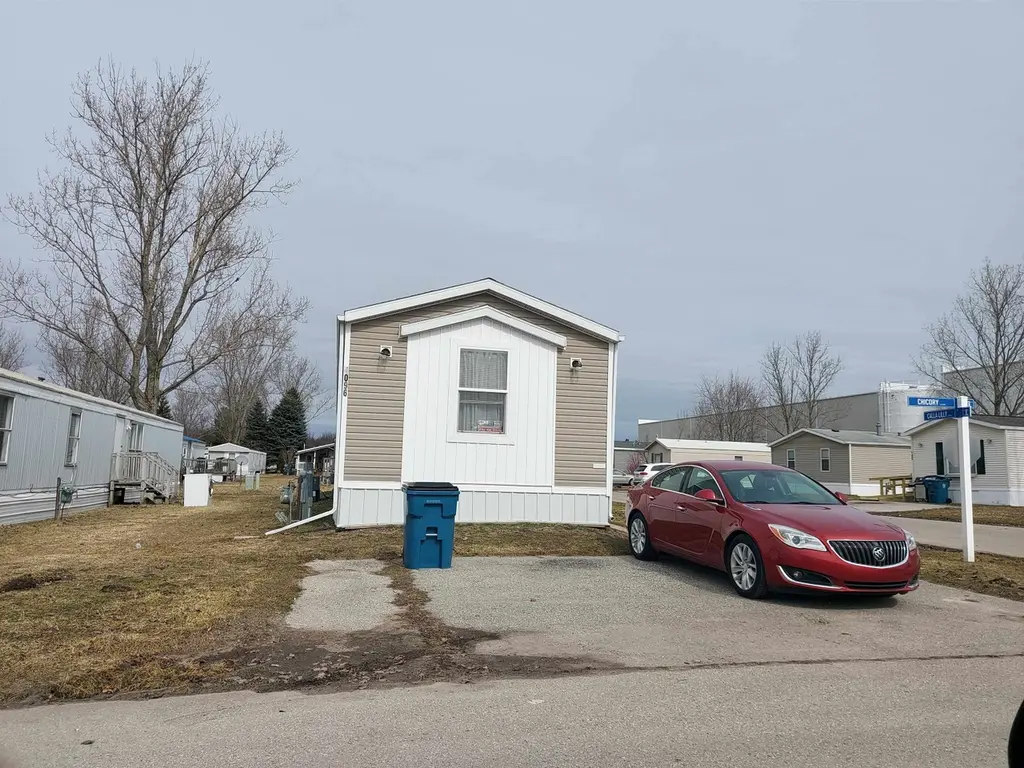
4096 Chicory Ln · Garfield, MI
Flood risk No data
- FEMA flood zone
- —
- Chance of flooding over 30 yrs
- —
- Est. flood insurance / yr
- —
Fire risk No data
- Est. fire insurance / yr
- —
Heat risk No data
- Hot days now (above threshold)
- —
- Hot days in 30 yrs
- —
Wind risk No data
- Chance of severe wind over 30 yrs
- —
Air-quality risk No data
- Unhealthy air days now
- —
- Unhealthy air days in 30 yrs
- —
Risk factors via First Street. Map © Google.
Why this score? — see what drove the B grade
The composite is a weighted blend of 9 inputs, each scored 0–100. Each bar is that input's sub-score; the figure is the points it added to the 100-point composite (weight × sub-score).
- Cash flow +30.0/30.0
- 1% rule +10.0/10.0
- DSCR +10.0/10.0
- ARV discount +7.5/15.0
- Schools +4.4/10.0
- Condition / age +4.0/5.0
- Rent growth +2.5/5.0
- Livability +2.5/5.0
- Appreciation +0.0/10.0
$64,000
🖨 Deal sheet 📄 Offer letter ✓ Due diligence
Listing remarks MLS
Beautifully done in the modern Farm House flair with netural tones. Located on a corner lot in Meadow Lane mobile home community is this 2018 16 x 76 Clayton single wide with 3 bedrooms and 2 full bath. Home offers a very open living space. Island kitchen with a deep sink, plenty of cabinets, appliance. Extras: Tall ceilings, walk-in shower, sconce lighting. Some furniture can stay. Current lot rent $951 includes trash water sewer. Pet friendly with restrictions, play areas, community room, easy in and out of park.
Key facts
- Island kitchen
- Open living space
- Walk-in shower
Tags
Neighborhood map
What this means for you Summary
Snapshot
- This is a 3-bed/1.0-bath manufactured listed at $64k. Condition is rated good.
Deal economics
- At list price, monthly cash flow is $724 ($9k/yr) — positive.
- The deal already cash-flows at list — no discount required.
- Meets the 1% rule at list price ($1k rent vs $64k).
- Recommended offer: $56k (12.0% below list) — sets the bar for market timing.
Location & tenants
- Location reads: area grade B — affects rentability + tenant quality, not the cash-flow math above.
- Traverse City Area Public Schools (town): math 45% / reading 56% proficiency, ranked #94 of 540 in MI (top 17%) — acceptable for families but not a draw, mixed tenant base, ~2y average lease.
- Market conditions: 229 active listings in the ZIP; 2 comparable units currently listed for rent nearby; 883 units permitted in Grand Traverse County in 2024 (501 in 5+ unit buildings).
Forward outlook
- Local home prices are declining (-3.0%/yr); year-one equity from $442 of loan paydown is wiped out by about $2k of value loss. Plan a longer hold.
- Grand Traverse County population projected at +20% by 2050 — long-run rental-demand tailwind backs the buy-and-hold thesis.
- At projected returns (-3.0% appreciation + 3.0% rent growth), your $18k cash investment doubles in ~3 years — after that, you're playing with house money.
Negotiation context
- It's been on market 140 days — a 12% lower offer ($56k) is reasonable based on typical stale-listing flexibility.
- 2 sale attempts; this cycle's ask has dropped $15k (19%) from the opening price — seller is motivated, your offer sets the floor, not the list.
Questions for the listing agent
- It's been on market 140 days. Have you received any prior offers? Is the seller open to a 12% concession, seller financing, or rate buy-down credit?
- Why hasn't it sold? Are there any deal-killer items the seller is aware of (foundation, flood, title, zoning, code violations)?
- Is there a deadline driving the sale (1031 exchange, divorce, estate, relocation)? That informs how much negotiation room exists.
- What's the average days-on-market for RENTAL listings here right now (not sales)? A rising rental-DOM trend means longer vacancies and softer asking-rent achievability than the comps imply.
- What's the recent tenant-quality profile in this submarket — average credit score on applications, eviction rate, late-payment / NSF rate, and stable-employment percentage? A property-management company in the area should have these aggregated.
- How much new for-sale + rental construction is in the pipeline within 1–3 miles? Heavy new supply typically softens prices + rents 12–24 months out; constrained supply supports both.
Investment metrics
- 1% rule
- 2.31% ✓
- Cap rate
- 19.86%
- Cash-on-cash
- 48.45%
- DSCR
- 3.16
- GRM
- 3.6
CMA / ARV
- ARV (median comp)
- $42,411
- List price
- $64,000
- Delta
- 50.90%
- Verdict
- OVERPRICED
- Comps
- 15 within 1.0 mi
Projected returns pro-forma
-3.0% appreciation · 3.0% rent growth · sell at horizon
- IRR
- 46.0%
- Equity multiple
- 2.99×
- Total profit
- $35,734
- Equity at exit
- $9,543
- IRR
- 51.8%
- Equity multiple
- 6.05×
- Total profit
- $90,547
- Equity at exit
- $5,534
Cash invested: $17,920 (down + closing). Projections, not guarantees.
Landlord ↔ Tenant lean methodology
- Overall (STATE)
- 62 Landlord-Friendly
- State Michigan
- 62 Landlord-Friendly · EVEN
- County
- — inherits STATE
- City
- — inherits STATE
ZIP-level market 49685
- Active inventory
- 229
- Price-to-rent
- 3.6×
Monthly cashflow live
- Estimated rent
- $1,476 medium interval (Pro) →
- Mortgage (P&I)
- −$336
- Tax est. 1.5%
- −$80 /mo · $960/yr
- Insurance
- −$27
- HOA
- −$0
- Vacancy / Maint / Mgmt
- −$310
- Net cashflow
- $724
Break-even live
UW: 25.0% down · 7.5% · 30yr · 1.5% tax · 5.0% vac · 8.0% maint · 8.0% mgmt
Financing live
Cash to close
- Down payment
- $16,000
- Closing costs
- $1,920
- Reserves months
- —
- Total cash needed
- —
Loan-product check · same deal, 3 products live
Conventional
25% down · 7.5% · 30yr
- Down + closing
- —
- Monthly P&I
- —
- Monthly cashflow
- —
- DSCR
- —
- Eligible?
- —
Personal DTI + credit; lowest rate.
DSCR
20% down · 8.5% · 30yr
- Down + closing
- —
- Monthly P&I
- —
- Monthly cashflow
- —
- DSCR
- —
- Eligible?
- —
No personal income docs; deal must DSCR.
Hard money
10% down · 12.0% · 12mo
- Down + closing
- —
- Monthly P&I
- —
- Monthly cashflow
- —
- DSCR
- —
- Eligible?
- —
Short-term bridge; refi at stabilization.
Rent comps 2 comps
| Address | Beds | Baths | Sqft | Rent | $/sqft | DOM | Units | Dist |
|---|---|---|---|---|---|---|---|---|
| 4170 Lilac Ln Unit 905 Traverse City, MI | 3.0 | 2.0 | 1120 | $1,419 | $1.27 | 43d | 1 | 0.05mi |
| 4418 E Daisy Ln Unit 156 Traverse City, MI | 2.0 | 2.0 | 896 | $1,649 | $1.84 | 43d | 1 | 0.24mi |
Listing history 15 events
-
2026-06-15days on market $64,000 Active 140 DOM
-
2026-06-14days on market $64,000 Active 138 DOM
-
2026-06-12days on market $64,000 Active 137 DOM
-
2026-06-09days on market $64,000 Active 134 DOM
-
2026-06-08days on market $64,000 Active 133 DOM
-
2026-06-07days on market $64,000 Active 132 DOM
-
2026-06-03days on market $64,000 Active 128 DOM
-
2026-06-02days on market $64,000 Active 127 DOM
-
2026-06-01days on market $64,000 Active 126 DOM
-
2026-05-31days on market $64,000 Active 125 DOM
-
2026-05-30days on market $64,000 Active 124 DOM
-
2026-04-10price $64,000 520-char remark
Show marketing remark (520 chars)
Beautifully done in the modern Farm House flair with netural tones. Located on a corner lot in Meadow Lane mobile home community is this 2018 16 x 76 Clayton single wide with 3 bedrooms and 2 full bath. Home offers a very open living space. Island kitchen with a deep sink, plenty of cabinets, appliance. Extras: Tall ceilings, walk-in shower, sconce lighting. Some furniture can stay. Current lot rent $951 includes trash water sewer. Pet friendly with restrictions, play areas, community room, easy in and out of park.
-
2026-01-26$79,000 Active 520-char remark
Show marketing remark (520 chars)
Beautifully done in the modern Farm House flair with netural tones. Located on a corner lot in Meadow Lane mobile home community is this 2018 16 x 76 Clayton single wide with 3 bedrooms and 2 full bath. Home offers a very open living space. Island kitchen with a deep sink, plenty of cabinets, appliance. Extras: Tall ceilings, walk-in shower, sconce lighting. Some furniture can stay. Current lot rent $951 includes trash water sewer. Pet friendly with restrictions, play areas, community room, easy in and out of park.
ⓘ Source: listings_history table (triggers on properties + properties_extension) + one-shot
backfill from property_details.listing_events for pre-trigger history.
Nearby sold comps map
Loading sold comps map…
Walkable amenities ~0.75 mi
Loading nearby amenities…
Taxation est. · year 1
- Rental income
- $17,709
- − Mortgage interest
- −$3,585
- − Property taxes
- −$960
- − Insurance
- −$320
- − Repairs & maintenance
- −$1,417
- − Management
- −$1,417
- − Depreciation
- −$1,862
- Taxable income
- $8,149
- Est. tax owed @ 24.0%
- −$1,956
- After-tax cash flow
- $6,727/yr
For passive investors: Depreciation is non-cash, so a rental often shows a tax loss while cash-flowing — sheltering income. Rental losses are passive: they offset passive income freely, and up to $25,000/yr can offset ordinary (W-2) income if you actively participate and your MAGI is under $100k (phasing out to $0 by $150k); unused losses carry forward. On sale, claimed depreciation is recaptured at up to 25%, and gains may owe capital-gains tax (a 1031 exchange can defer both). Figures are a year-1 estimate at your 24.0% rate — not tax advice; consult a CPA.
Condition & rehab AI · 12 photos
This modern mobile home in Meadow Lane mobile home community is in good condition with cosmetic updates needed to enhance its curb appeal and value.
Value-add opportunities
- Both Paint the exterior siding — Enhances curb appeal and can increase both resale and rental value.
- Both Replace the kitchen faucet — Modernizes the kitchen and adds value.
- Both Install new flooring in the bathrooms — Improves the look and feel of the bathrooms, increasing both resale and rental value.
Renovation cost estimate screening
Value-add ROI direction
- Both Paint the exterior siding — Enhances curb appeal and can increase both resale and rental value. ↑
- Both Replace the kitchen faucet — Modernizes the kitchen and adds value. ↑
- Both Install new flooring in the bathrooms — Improves the look and feel of the bathrooms, increasing both resale and rental value. ↑
ⓘ Cost ranges are severity-bucket heuristics (US national rule-of-thumb). Get contractor quotes + a written scope before underwriting a rehab budget.
Schools (NCES district)
- District
- Traverse City Area Public Schools
- NCES district ID
- 2633870
- Math proficiency
- 45% ▼ -3.00%
- Reading proficiency
- 56% ▼ -6.00%
- Median HH income
- $53,645
- Composite
- 43.51/100
- National rank
- #2990
- State rank
- #94 of 540 in MI
Livability — Garfield
No livability data for this city. (Only ~50 U.S. cities are tracked.)
Census & demographics
- Population (ZIP)
- 21,297
Population outlook (Grand Traverse County) Hauer SSP2
- Today (2025)
- 102,241 people
- By 2030
- 107,172 · +4.8%
- By 2040
- 115,676 · +13.1%
- By 2050
- 122,377 · +19.7%
- By 2075
- 136,554 · +33.6%
- By 2100
- 137,871 · +34.8%
Race, ethnicity, and origin ACS 2023
- Neighborhood character
- Predominantly White (92%)
- Race & ethnicity
- White 92% Two or more races 4% Hispanic / Latino 2%
- Common ancestry
- Romanian 11% Lithuanian 4% Portuguese 3%
- Foreign-born
- 2% · Canada, South Korea
- Languages at home
- 98% English-only · Spanish 1% Russian/Polish/Slavic 1%
Political lean MEDSL · Grand Traverse
- 2024 margin
- Toss-up / Even · D 48.3% · R 50.1% · Other 1.6%
- 2008→2024 swing
- +1.3pp toward D · 2008: -3.0pp · 2024: -1.7pp
- All cycles
- 2024: R+1.7 2020: R+3.0 2016: R+12.5 2012: R+11.8 2008: R+3.0
Not yet ingested
- Civics
- —
Market trends
- HPI YoY
- ▼ -208.83%
- Current HPI
- 351.3678
- Rent YoY
- —
- Metro
- —
- State GDP YoY
- ▲ 1.37%
- F500 in state
- 28
Industry mix (Fortune 500 HQ in MI)
| Industry | F500 HQs | Revenue |
|---|---|---|
| Automotive Parts | 3 | $48B |
|
||
| Automotive | 2 | $372B |
|
||
| Chemicals | 1 | $45B |
|
||
| Automotive Retail | 1 | $29B |
|
||
| Healthcare / Medical Devices | 1 | $23B |
|
||
| Automotive Technology | 1 | $20B |
|
||
Price history
-19.0% since first listed4 events — show timeline
- 2026-04-10 Price Changed $64,000 MiRealSource-MiMLS
- 2026-04-10 Price Changed $64,000 REALCOMP
- 2026-01-26 Listed $79,000 REALCOMP
- 2026-01-26 Listed $79,000 MiRealSource-MiMLS
Cash-flow waterfall
monthlySold comps — $/sqft
last 12 mo · ≤1 miLoading sold comps…