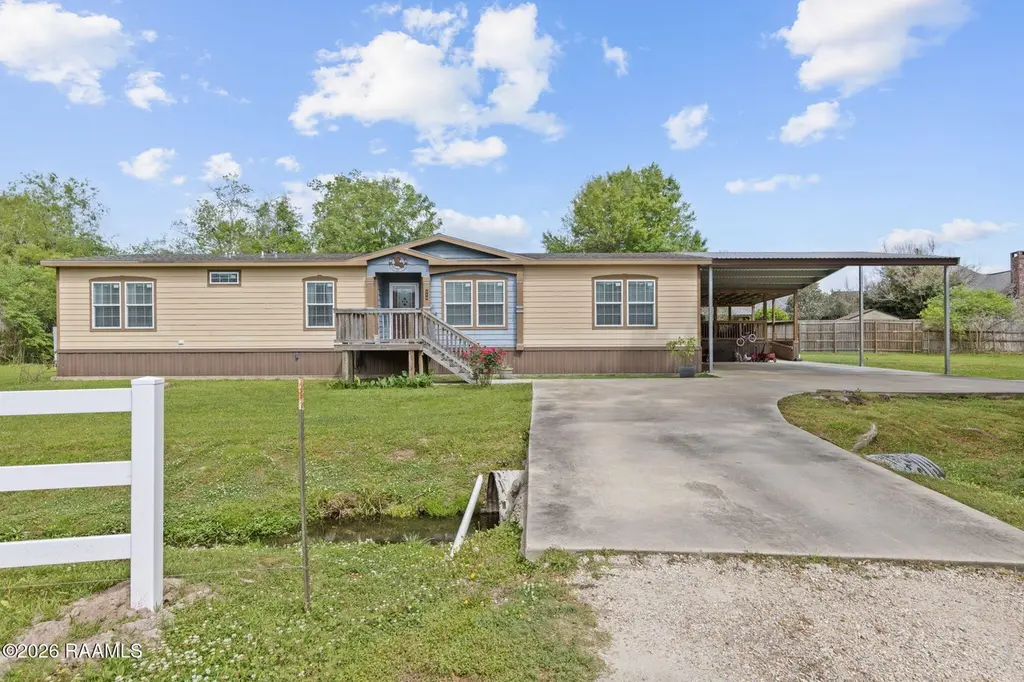
112 Fortune Hill Gardens Ln · Lafayette, LA
Flood risk 5/10 · Moderate
- FEMA flood zone
- X (unshaded)
- Chance of flooding over 30 yrs
- 0.67%
- Est. flood insurance / yr
- $507 – $1,088
Fire risk 1/10 · Minimal
- Est. fire insurance / yr
- $1,269 – $2,357
Heat risk 9/10 · Severe
- Hot days now (above 108°F)
- 7 days/yr
- Hot days in 30 yrs
- 21 days/yr
Wind risk 9/10 · Severe
- Chance of severe wind over 30 yrs
- 99.0%
Air-quality risk 1/10 · Minimal
- Unhealthy air days now
- 0 days/yr
- Unhealthy air days in 30 yrs
- 0 days/yr
Risk factors via First Street. Map © Google.
Why this score? — see what drove the C- grade
The composite is a weighted blend of 9 inputs, each scored 0–100. Each bar is that input's sub-score; the figure is the points it added to the 100-point composite (weight × sub-score).
- Cash flow +15.0/30.0
- ARV discount +15.0/15.0
- DSCR +4.6/10.0
- Schools +3.6/10.0
- Livability +3.5/5.0
- 1% rule +3.3/10.0
- Rent growth +2.9/5.0
- Condition / age +2.5/5.0
- Appreciation +0.0/10.0
$259,900
🖨 Deal sheet 📄 Offer letter ✓ Due diligence
Listing remarks MLS
Welcome to this beautifully designed energy smart modular ranch, thoughtfully built with efficiency and comfort in mind. Featuring enhanced insulation and Low-E thermal windows--along with durable Hardie plank siding, this home offers long-term energy savings and quality construction. It sits tucked away at the end of a private lane, delivering a peaceful country setting with the convenience of nearby city amenities.Inside, the spacious kitchen is perfect for everyday living and entertaining, complete with stainless steel appliances, a center island, walk-in pantry, and a built-in serving buffet. Just off the kitchen and laundry area, you'll find an impressive 15' x 90' covered deck that connects seamlessly to the covered two-car carport--ideal for relaxing or hosting gatherings.The home features stylish touches throughout, including barn-style doors in the primary suite, a built-in desk in the hallway, and a generously sized laundry room with a separate flex space that can serve as an office, craft room, playroom, or additional storage. The welcoming entry showcases a leaded glass front door, while French doors off the kitchen lead out to the deck. With no carpet and a clean, modern color palette throughout, this home is move-in ready and designed for easy living.
Key facts
- 0.47 acre lot
- Garage
- Built 2017
Neighborhood map
What this means for you Summary
Snapshot
- This is a 4-bed/3.0-bath single-family listed at $260k.
Deal economics
- At list price, monthly cash flow is $82 ($982/yr) — positive.
- The deal already cash-flows at list — no discount required.
- To meet the 1% rule (rent ≥ 1% of price), the offer needs to be $215k (17.4% below list).
- Recommended offer: $215k (17.4% below list) — sets the bar for 1% rule.
- Cap rate 6.7% vs local median 4.7% in Lafayette — top-decile yield for the area; either an underpriced asset or a hidden risk that comps aren't pricing in. Stress-test before assuming the spread holds.
Location & tenants
- Location reads 70/100 on livability (#63 in LA) — a middle-class / working-renter tenant base. Strengths: cost of living A+, housing A+, health & safety A+; Watch: amenities C-, employment C-, crime F.
- Lafayette Parish (urban): math 38% / reading 46% proficiency, ranked #19 of 98 in LA (top 19%) — families likely to look elsewhere, expect single-tenant / working-renter base with shorter leases.
- Market conditions: Rents rising (+1.6%/yr); 675 active listings in the ZIP; 8 comparable units currently listed for rent nearby; rentals lingering (median 44d on market — plan ~5-8 weeks vacancy on turnover, expect pricing pressure); 50% of comp listings sitting > 30 days — soft ceiling on asking rent; solid renter incomes; 1,585 units permitted in Lafayette Parish in 2024 (10 in 5+ unit buildings).
Forward outlook
- Local home prices are declining (-3.0%/yr); year-one equity from $2k of loan paydown is wiped out by about $8k of value loss. Plan a longer hold.
- Lafayette County population projected at +34% by 2050 — long-run rental-demand tailwind backs the buy-and-hold thesis.
Negotiation context
- It's been on market 76 days — a 6% lower offer ($244k) is reasonable based on typical stale-listing flexibility.
- 5 sale attempts since 11y ago with the ask held roughly flat each time — persistent listings suggest the price (not the market) is what's stuck; bring a comps-based counter.
- Current owner paid $36k; list at $260k implies a 632% gain — meaningful room to come down on a strong offer.
Risks & watch-outs
- Climate carrying-cost: moderate flood risk; severe wind risk, 99% chance of damaging wind over 30y; extreme-heat days projected 7→21/yr by 2055 (HVAC capex compounding) — expect insurance premiums to compound above CPI over the hold.
Questions for the listing agent
- It's been on market 76 days. Have you received any prior offers? Is the seller open to a 17% concession, seller financing, or rate buy-down credit?
- Why hasn't it sold? Are there any deal-killer items the seller is aware of (foundation, flood, title, zoning, code violations)?
- Is there a deadline driving the sale (1031 exchange, divorce, estate, relocation)? That informs how much negotiation room exists.
- Schools are B-rated — typically a magnet for longer-tenancy family renters. What's the average tenant stay here, and is there a school-zone premium baked into asking?
- Crime grade is F in this area — have there been break-ins, vandalism, or insurance claims at this property in the last 3 years? What carrier currently insures it and at what premium?
- What's the average days-on-market for RENTAL listings here right now (not sales)? A rising rental-DOM trend means longer vacancies and softer asking-rent achievability than the comps imply.
- What's the recent tenant-quality profile in this submarket — average credit score on applications, eviction rate, late-payment / NSF rate, and stable-employment percentage? A property-management company in the area should have these aggregated.
- How much new for-sale + rental construction is in the pipeline within 1–3 miles? Heavy new supply typically softens prices + rents 12–24 months out; constrained supply supports both.
Investment metrics
- 1% rule
- 0.83% ✗
- Cap rate
- 6.67%
- Cash-on-cash
- 1.35%
- DSCR
- 1.06
- GRM
- 10.1
CMA / ARV
- ARV (median comp)
- $421,205
- List price
- $259,900
- Delta
- -38.30%
- Verdict
- UNDERPRICED
- Comps
- 20 within 1.0 mi
Show comp detail 12 sales within ~0.75 mi
| Address | Dist | Beds/Ba | Sqft | Sold | Price | $/sf | Match |
|---|---|---|---|---|---|---|---|
| 100 Osage Dr | 0.26mi | 4/3.0 | 2,100 (+1%) | 4mo | $348,000 | $166 | 84 |
| 106 Wild Clover Pl | 0.21mi | 4/2.0 | 2,020 (-3%) | 4mo | $308,000 | $152 | 78 |
| 210 Treescape Dr | 0.21mi | 3/2.0 (-1) | 2,125 (+2%) | 1mo | $374,000 | $176 | 78 |
| 227 Treescape Dr | 0.20mi | 4/3.0 | 2,250 (+8%) | 1mo | $415,000 | $184 | 77 |
| 213 Maple Branch St | 0.36mi | 3/2.5 (-1) | 2,123 (+2%) | 0mo | $365,700 | $172 | 73 |
| 220 Timber Mill St | 0.30mi | 3/2.0 (-1) | 1,997 (-4%) | 1mo | $400,000 | $200 | 69 |
| 208 Redfern St | 0.35mi | 3/2.0 (-1) | 2,125 (+2%) | 4mo | $380,000 | $179 | 68 |
| 208 Narrow Way Dr | 0.45mi | 4/3.0 | 1,930 (-7%) | 5mo | $349,900 | $181 | 63 |
| 101 Olivewood Dr | 0.44mi | 4/3.0 | 2,317 (+11%) | 0mo | $425,000 | $183 | 61 |
| 200 Eastwood Dr | 0.33mi | 3/2.0 (-1) | 1,900 (-9%) | 3mo | $363,000 | $191 | 58 |
| 232 Timber Mill St | 0.34mi | 3/2.0 (-1) | 1,916 (-8%) | 5mo | $379,900 | $198 | 58 |
| 104 Cherrywood Dr | 0.51mi | 3/2.5 (-1) | 2,338 (+12%) | 1mo | $465,328 | $199 | 48 |
Match score weights: distance 35% · size 25% · config 20% · recency 20%. Top-matched comps best support the ARV.
Projected returns pro-forma
-3.0% appreciation · 1.65% rent growth · sell at horizon
- IRR
- -15.6%
- Equity multiple
- 0.45×
- Total profit
- $-39,861
- Equity at exit
- $38,752
- IRR
- -9.4%
- Equity multiple
- 0.45×
- Total profit
- $-39,814
- Equity at exit
- $22,471
Cash invested: $72,772 (down + closing). Projections, not guarantees.
Landlord ↔ Tenant lean methodology
- Overall (STATE)
- 90 Strongly Landlord-Friendly
- State Louisiana
- 90 Strongly Landlord-Friendly · R+12
- County
- — inherits STATE
- City
- — inherits STATE
ZIP-level market 70592
- Home prices YoY
- -23.4%
- Rents YoY
- 1.6%
- Active inventory
- 675
- Price-to-rent
- 10.1×
Monthly cashflow live
- Estimated rent
- $2,146 high interval (Pro) →
- Mortgage (P&I)
- −$1,363
- Tax from tax record
- −$143 /mo · $1,711/yr
- Insurance
- −$108
- HOA
- −$0
- Vacancy / Maint / Mgmt
- −$451
- Net cashflow
- $82
Break-even live
UW: 25.0% down · 7.5% · 30yr · 1.5% tax · 5.0% vac · 8.0% maint · 8.0% mgmt
Financing live
Cash to close
- Down payment
- $64,975
- Closing costs
- $7,797
- Reserves months
- —
- Total cash needed
- —
Loan-product check · same deal, 3 products live
Conventional
25% down · 7.5% · 30yr
- Down + closing
- —
- Monthly P&I
- —
- Monthly cashflow
- —
- DSCR
- —
- Eligible?
- —
Personal DTI + credit; lowest rate.
DSCR
20% down · 8.5% · 30yr
- Down + closing
- —
- Monthly P&I
- —
- Monthly cashflow
- —
- DSCR
- —
- Eligible?
- —
No personal income docs; deal must DSCR.
Hard money
10% down · 12.0% · 12mo
- Down + closing
- —
- Monthly P&I
- —
- Monthly cashflow
- —
- DSCR
- —
- Eligible?
- —
Short-term bridge; refi at stabilization.
Rent comps 8 comps
| Address | Beds | Baths | Sqft | Rent | $/sqft | DOM | Units | Dist |
|---|---|---|---|---|---|---|---|---|
| 416 Rue Canard Youngsville, LA | 4.0 | 2.0 | 2600 | $2,350 | $0.90 | 13d | 1 | 0.76mi |
| 408 Rue Canard Youngsville, LA | 3.0 | 2.0 | 1600 | $1,800 | $1.12 | 43d | 1 | 0.79mi |
| 118 Village Green Dr Youngsville, LA | 3.0 | 2.0 | 1410 | $1,800 | $1.28 | 13d | 1 | 0.81mi |
| 431 Chemin Metairie Rd Youngsville, LA | 3.0 | 2.5 | 1542 | $1,270 | $0.82 | 21d | 1 | 0.85mi |
| 136 Kirkwood Ln Youngsville, LA | 3.0 | 2.0 | 1600 | $1,500 | $0.94 | 13d | 1 | 0.95mi |
| 117 Harvey Cay Ln Youngsville, LA | 3.0 | 2.0 | 1499 | $1,950 | $1.30 | 43d | 1 | 1.09mi |
| 130 Windermere Cir Youngsville, LA | 3.0 | 2.0 | 1493 | $4,500 | $3.01 | 43d | 1 | 1.25mi |
| 510 Annaberg Dr Youngsville, LA | 3.0 | 2.0 | 1825 | $2,550 | $1.40 | 43d | 1 | 1.41mi |
Listing history 23 events
-
2026-06-18days on market $259,900 Active 76 DOM
-
2026-06-17days on market $259,900 Active 75 DOM
-
2026-06-16pricedays on market $259,900 Active 74 DOM
-
2026-06-15days on market $265,000 Active 73 DOM
-
2026-06-14days on market $265,000 Active 71 DOM
-
2026-06-13days on market $265,000 Active 70 DOM
-
2026-06-10days on market $265,000 Active 68 DOM
-
2026-06-09days on market $265,000 Active 67 DOM
-
2026-06-08days on market $265,000 Active 66 DOM
-
2026-06-07days on market $265,000 Active 65 DOM
-
2026-06-05days on market $265,000 Active 62 DOM
-
2026-06-03days on market $265,000 Active 61 DOM
-
2026-06-02days on market $265,000 Active 60 DOM
-
2026-06-01days on market $265,000 Active 59 DOM
-
2026-05-31days on market $265,000 Active 58 DOM
-
2026-05-30days on market $265,000 Active 57 DOM
-
2026-04-03$265,000 Active 1285-char remark
Show marketing remark (1285 chars)
Welcome to this beautifully designed energy smart modular ranch, thoughtfully built with efficiency and comfort in mind. Featuring enhanced insulation and Low-E thermal windows--along with durable Hardie plank siding, this home offers long-term energy savings and quality construction. It sits tucked away at the end of a private lane, delivering a peaceful country setting with the convenience of nearby city amenities.Inside, the spacious kitchen is perfect for everyday living and entertaining, complete with stainless steel appliances, a center island, walk-in pantry, and a built-in serving buffet. Just off the kitchen and laundry area, you'll find an impressive 15' x 90' covered deck that connects seamlessly to the covered two-car carport--ideal for relaxing or hosting gatherings.The home features stylish touches throughout, including barn-style doors in the primary suite, a built-in desk in the hallway, and a generously sized laundry room with a separate flex space that can serve as an office, craft room, playroom, or additional storage. The welcoming entry showcases a leaded glass front door, while French doors off the kitchen lead out to the deck. With no carpet and a clean, modern color palette throughout, this home is move-in ready and designed for easy living.
-
2017-10-27$220,000
-
2016-12-15soldstatus $35,500
-
2016-12-14soldstatus $35,500
-
2016-04-19$37,900
-
2016-01-05$39,999
-
2015-02-05$35,000
ⓘ Source: listings_history table (triggers on properties + properties_extension) + one-shot
backfill from property_details.listing_events for pre-trigger history.
Tax reassessment forecast LA · Resets to sale price
- Current annual tax
- $1,711 · $143/mo
- Projected year-2 tax
- $1,711 · $143/mo
- Expected delta
- $0/yr ($0/mo · 0.0%)
ⓘ Screening estimate from a state-policy table — verify with the county assessor before closing.
Climate risk First Street
- Flood 5/10 Major FEMA zone X (unshaded) · 67% chance over 30 yrs
- Wildfire 1/10 Low
- Heat 9/10 Extreme 7 d/yr ≥108°F today · 21 d/yr by 30 yrs out
- Wind 9/10 Extreme 99% chance of damaging wind over 30 yrs
- Air quality 1/10 Low 0 unhealthy d/yr today · 0 by 30 yrs out
Nearby sold comps map
Loading sold comps map…
Walkable amenities ~0.75 mi
Loading nearby amenities…
Taxation est. · year 1
- Rental income
- $25,756
- − Mortgage interest
- −$14,558
- − Property taxes
- −$1,711
- − Insurance
- −$1,300
- − Repairs & maintenance
- −$2,061
- − Management
- −$2,061
- − Depreciation
- −$7,561
- Taxable loss
- −$3,494
- Est. tax savings @ 24.0%
- +$839
- After-tax cash flow
- $1,820/yr
For passive investors: Depreciation is non-cash, so a rental often shows a tax loss while cash-flowing — sheltering income. Rental losses are passive: they offset passive income freely, and up to $25,000/yr can offset ordinary (W-2) income if you actively participate and your MAGI is under $100k (phasing out to $0 by $150k); unused losses carry forward. On sale, claimed depreciation is recaptured at up to 25%, and gains may owe capital-gains tax (a 1031 exchange can defer both). Figures are a year-1 estimate at your 24.0% rate — not tax advice; consult a CPA.
Schools (NCES district)
- District
- Lafayette Parish
- NCES district ID
- 2200870
- Math proficiency
- 38% ▼ -32.00%
- Reading proficiency
- 46% ▼ -24.00%
- Median HH income
- $50,238
- Composite
- 36.15/100
- National rank
- #4741
- State rank
- #19 of 98 in LA
Livability — Lafayette
- Score
- 70/100
- State rank
- #63
- US rank
- #8133
Category grades
Schools grade is shown separately in the Schools card above.
Census & demographics
- County
- Lafayette Parish · 207,544 people
- City population
- 158,114
- Metro
- Lafayette, LA
- Population (ZIP)
- 32,167
- Household income
- $93,204
- Rent vs Own
- Severe rent burden
- 424.0
Population outlook (Lafayette County) Hauer SSP2
- Today (2025)
- 280,930 people
- By 2030
- 301,092 · +7.2%
- By 2040
- 339,456 · +20.8%
- By 2050
- 375,156 · +33.5%
- By 2075
- 451,672 · +60.8%
- By 2100
- 497,203 · +77.0%
Race, ethnicity, and origin ACS 2023
- Neighborhood character
- Predominantly White (82%)
- Race & ethnicity
- White 82% Black 10% Two or more races 5% Hispanic / Latino 4% Asian 1%
- Common ancestry
- Lithuanian 24% Romanian 3% Italian 1%
- Foreign-born
- 3% · Canada
- Languages at home
- 94% English-only · French/Haitian/Cajun 3% Spanish 2%
Political lean MEDSL · Lafayette
- 2024 margin
- Solid R (+31.4) · D 33.5% · R 64.8% · Other 1.7%
- 2008→2024 swing
- -0.1pp no change · 2008: -31.3pp · 2024: -31.4pp
- All cycles
- 2024: R+31.4 2020: R+28.7 2016: R+33.6 2012: R+33.7 2008: R+31.3
Not yet ingested
- Civics
- —
Market trends
- HPI YoY
- ▼ -41.24%
- Current HPI
- 135.2825
- Rent YoY
- ▲ 1.65%
- Metro
- Lafayette, LA
- State GDP YoY
- ▲ 3.29%
- F500 in state
- 10
Industry mix (Fortune 500 HQ in LA)
| Industry | F500 HQs | Revenue |
|---|---|---|
| Telecommunications | 2 | $23B |
|
||
| Utilities | 1 | $12B |
|
||
| Wholesale / Distribution | 1 | $5B |
|
||
| Advertising | 1 | $2B |
|
||
Price history
+657.1% since first listed7 events — show timeline
- 2026-04-03 Listed $265,000 AcadianaMLS
- 2017-10-27 Listed $220,000 AcadianaMLS
- 2016-12-15 Sold (Public Records) $35,500 Public Records
- 2016-12-14 Sold (MLS) $35,500 AcadianaMLS
- 2016-04-19 Listed $37,900 AcadianaMLS
- 2016-01-05 Listed $39,999 AcadianaMLS
- 2015-02-05 Listed $35,000 AcadianaMLS
Property tax history
+22.1%/yrLatest (2025): $1,711 · -1.3% YoY. Source: county tax records.
Cash-flow waterfall
monthlySold comps — $/sqft
last 12 mo · ≤1 miLoading sold comps…