277 Peter Rd · Southbury, CT
Flood risk 1/10 · Minimal
- FEMA flood zone
- X (unshaded)
- Chance of flooding over 30 yrs
- 0.0%
- Est. flood insurance / yr
- $473 – $860
Fire risk 2/10 · Minimal
- Est. fire insurance / yr
- $829 – $1,539
Heat risk 5/10 · Moderate
- Hot days now (above 98°F)
- 7 days/yr
- Hot days in 30 yrs
- 15 days/yr
Wind risk 6/10 · Moderate
- Chance of severe wind over 30 yrs
- 27.0%
Air-quality risk 3/10 · Minor
- Unhealthy air days now
- 3 days/yr
- Unhealthy air days in 30 yrs
- 4 days/yr
Risk factors via First Street. Map © Google.
Why this score? — see what drove the D+ grade
The composite is a weighted blend of 9 inputs, each scored 0–100. Each bar is that input's sub-score; the figure is the points it added to the 100-point composite (weight × sub-score).
- ARV discount +15.0/15.0
- Cash flow +13.8/30.0
- Schools +5.4/10.0
- DSCR +4.2/10.0
- 1% rule +3.7/10.0
- Rent growth +2.5/5.0
- Livability +2.5/5.0
- Condition / age +2.5/5.0
- Appreciation +0.0/10.0
$249,900
🖨 Deal sheet 📄 Offer letter ✓ Due diligence
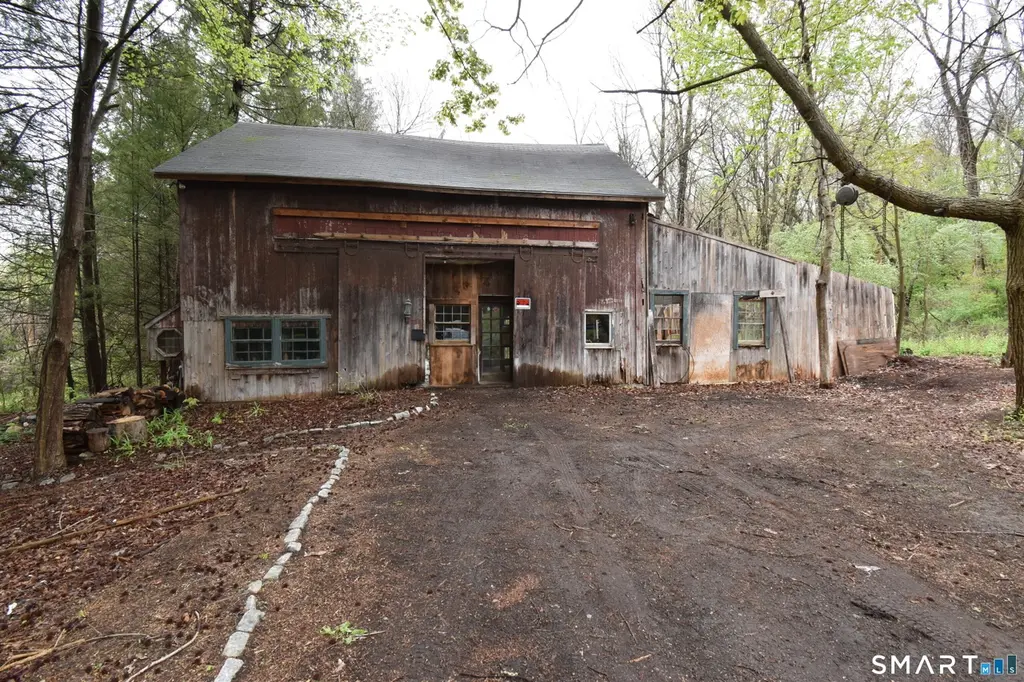
Listing remarks
Contractors, renovators, and dreamers-this is your opportunity to create something special. Set on 1.32 picturesque acres with a peaceful pond at the rear of the property, this rough and rustic house-barn is brimming with potential and country charm. A drilled well and septic system, installed in 1990 and reportedly hardly used, provide a solid starting point for your renovation plans. The home is listed as offering 3 bedrooms and a half bath, with some rough plumbing in place for a future full bath on the second floor. Inside, a massive fieldstone fireplace and exposed rustic beams set the stage for a warm, character-filled retreat once restored. Bring your tools, imagination, and vision-t
Key facts
- Fieldstone fireplace
- Exposed rustic beams
- Picturesque acres
Tags
Property features AI
Exterior
- Utilities: Private well water; Septic sewer
- Home design: Single-family home
- Construction: Frame construction; Wood exterior siding; Asphalt shingle roof; Block foundation; Brown exterior color
- Exterior features: Pond frontage; Some wetlands on the lot; Treed lot; Level and sloping areas
Interior
- Kitchen: Laundry area located in the kitchen
- Bedrooms: 3 bedrooms
- Bathrooms: 1 full bath; 1 half bath
- Heating & cooling: Wood/coal stove heating; No hot water (as listed)
- Interior features: Walk-up attic; One fireplace
- Laundry & utility: Main-level laundry
Neighborhood map
What this means for you Summary
Snapshot
- This is a 3-bed/1.0-bath single-family listed at $250k.
Deal economics
- At list price, monthly cash flow is $24 ($283/yr) — positive.
- The deal already cash-flows at list — no discount required.
- To meet the 1% rule (rent ≥ 1% of price), the offer needs to be $217k (13.1% below list).
- Recommended offer: $217k (13.1% below list) — sets the bar for 1% rule.
Location & tenants
- Location reads: area grade D — affects rentability + tenant quality, not the cash-flow math above.
- Regional School District 15 (suburban): math 56% / reading 64% proficiency, ranked #46 of 153 in CT (top 30%) — acceptable for families but not a draw, mixed tenant base, ~2y average lease; only 4% free/reduced lunch — higher-income household profile.
- Zoned schools: Pomperaug Regional High School (math 54% / reading 74%, grade B-, #37 of 194 statewide, top 19%, 1,039 students, 14% FRL).
- Market conditions: 156 active listings in the ZIP; 3 comparable units currently listed for rent nearby; rentals at typical pace (median 22d on market — plan ~3-4 weeks tenant-placement turnaround); 502 units permitted in Naugatuck Valley Planning Region in 2024 (171 in 5+ unit buildings).
Forward outlook
- Local home prices are declining (-3.0%/yr); year-one equity from $2k of loan paydown is wiped out by about $7k of value loss. Plan a longer hold.
Negotiation context
- It's been on market 48 days — a 3% lower offer ($242k) is reasonable based on typical stale-listing flexibility.
Risks & watch-outs
- Watch-outs: built in 1940 — expect roof / HVAC / electrical / plumbing capex.
- Climate carrying-cost: major wind risk, 27% chance of damaging wind over 30y; extreme-heat days projected 7→15/yr by 2055 (HVAC capex compounding) — expect insurance premiums to compound above CPI over the hold.
Questions for the listing agent
- It's been on market 48 days. Have you received any prior offers? Is the seller open to a 13% concession, seller financing, or rate buy-down credit?
- Built in 1940 — when were the roof, HVAC, electrical panel, plumbing, and water heater last replaced?
- Is there a deadline driving the sale (1031 exchange, divorce, estate, relocation)? That informs how much negotiation room exists.
- The area grade is low — what's the realistic commute time and amenity access for the typical tenant pool here? Any planned neighborhood developments (good or bad) we should know about?
- What's the average days-on-market for RENTAL listings here right now (not sales)? A rising rental-DOM trend means longer vacancies and softer asking-rent achievability than the comps imply.
- What's the recent tenant-quality profile in this submarket — average credit score on applications, eviction rate, late-payment / NSF rate, and stable-employment percentage? A property-management company in the area should have these aggregated.
- How much new for-sale + rental construction is in the pipeline within 1–3 miles? Heavy new supply typically softens prices + rents 12–24 months out; constrained supply supports both.
Investment metrics
- 1% rule
- 0.87% ✗
- Cap rate
- 6.41%
- Cash-on-cash
- 0.40%
- DSCR
- 1.02
- GRM
- 9.6
CMA / ARV
- ARV (median comp)
- $454,448
- List price
- $249,900
- Delta
- -45.01%
- Verdict
- UNDERPRICED
- Comps
- 12 within 1.0 mi
Show comp detail 2 sales within ~0.75 mi
| Address | Dist | Beds/Ba | Sqft | Sold | Price | $/sf | Match |
|---|---|---|---|---|---|---|---|
| 6 Spring Trl | 0.66mi | 3/2.0 | 1,509 (+14%) | 12mo | $433,000 | $287 | 32 |
| 115 River Trl | 0.72mi | 3/2.0 | 1,518 (+14%) | 23mo | $430,000 | $283 | 19 |
Match score weights: distance 35% · size 25% · config 20% · recency 20%. Top-matched comps best support the ARV.
Projected returns pro-forma
-3.0% appreciation · 3.0% rent growth · sell at horizon
- IRR
- -15.7%
- Equity multiple
- 0.44×
- Total profit
- $-38,980
- Equity at exit
- $37,261
- IRR
- -7.2%
- Equity multiple
- 0.54×
- Total profit
- $-31,961
- Equity at exit
- $21,607
Cash invested: $69,972 (down + closing). Projections, not guarantees.
Landlord ↔ Tenant lean methodology
- Overall (STATE)
- 27 Tenant-Leaning
- State Connecticut
- 27 Tenant-Leaning · D+7
- County
- — inherits STATE
- City
- — inherits STATE
ZIP-level market 06488
- Active inventory
- 156
- Price-to-rent
- 9.6×
Monthly cashflow live
- Estimated rent
- $2,172 medium interval (Pro) →
- Mortgage (P&I)
- −$1,311
- Tax from tax record
- −$278 /mo · $3,332/yr
- Insurance
- −$104
- HOA
- −$0
- Vacancy / Maint / Mgmt
- −$456
- Net cashflow
- $24
Break-even live
UW: 25.0% down · 7.5% · 30yr · 1.5% tax · 5.0% vac · 8.0% maint · 8.0% mgmt
Financing live
Cash to close
- Down payment
- $62,475
- Closing costs
- $7,497
- Reserves months
- —
- Total cash needed
- —
Loan-product check · same deal, 3 products live
Conventional
25% down · 7.5% · 30yr
- Down + closing
- —
- Monthly P&I
- —
- Monthly cashflow
- —
- DSCR
- —
- Eligible?
- —
Personal DTI + credit; lowest rate.
DSCR
20% down · 8.5% · 30yr
- Down + closing
- —
- Monthly P&I
- —
- Monthly cashflow
- —
- DSCR
- —
- Eligible?
- —
No personal income docs; deal must DSCR.
Hard money
10% down · 12.0% · 12mo
- Down + closing
- —
- Monthly P&I
- —
- Monthly cashflow
- —
- DSCR
- —
- Eligible?
- —
Short-term bridge; refi at stabilization.
Rent comps 3 comps
| Address | Beds | Baths | Sqft | Rent | $/sqft | DOM | Units | Dist |
|---|---|---|---|---|---|---|---|---|
| 298 Old Waterbury Rd Unit 1 Southbury, CT | 2.0 | 1.0 | 1014 | $2,000 | $1.97 | 3d | 1 | 1.46mi |
| 312 Old Waterbury Rd Apt 207 Southbury, CT | 2.0 | 1.0 | 970 | $2,750 | $2.84 | 23d | 1 | 1.47mi |
| 312 Old Waterbury Rd Unit 312-Apt 102 Southbury, CT | 2.0 | 2.0 | 1057 | $1,805 | $1.71 | 21d | 1 | 1.48mi |
Listing history 15 events
-
2026-06-18days on market $249,900 Active 48 DOM
-
2026-06-17days on market $249,900 Active 47 DOM
-
2026-06-16days on market $249,900 Active 46 DOM
-
2026-06-15days on market $249,900 Active 45 DOM
-
2026-06-14days on market $249,900 Active 43 DOM
-
2026-06-13days on market $249,900 Active 42 DOM
-
2026-06-10days on market $249,900 Active 40 DOM
-
2026-06-09days on market $249,900 Active 39 DOM
-
2026-06-08days on market $249,900 Active 38 DOM
-
2026-06-07days on market $249,900 Active 37 DOM
-
2026-06-03days on market $249,900 Active 33 DOM
-
2026-06-03days on market $249,900 Active 32 DOM
-
2026-06-01days on market $249,900 Active 31 DOM
-
2026-05-31days on market $249,900 Active 30 DOM
-
2026-04-30$249,900 Active 778-char remark
ⓘ Source: listings_history table (triggers on properties + properties_extension) + one-shot
backfill from property_details.listing_events for pre-trigger history.
Tax reassessment forecast CT · Partial reset (capped growth)
- Current annual tax
- $3,332 · $278/mo
- Projected year-2 tax
- $4,340 · $362/mo
- Expected delta
- +$1,008/yr (+$84/mo · 30.3%)
ⓘ Screening estimate from a state-policy table — verify with the county assessor before closing.
Climate risk First Street
- Flood 1/10 Low FEMA zone X (unshaded) · 0% chance over 30 yrs
- Wildfire 2/10 Low
- Heat 5/10 Major 7 d/yr ≥98°F today · 15 d/yr by 30 yrs out
- Wind 6/10 Major 27% chance of damaging wind over 30 yrs
- Air quality 3/10 Moderate 3 unhealthy d/yr today · 4 by 30 yrs out
Nearby sold comps map
Loading sold comps map…
Walkable amenities ~0.75 mi
Loading nearby amenities…
Taxation est. · year 1
- Rental income
- $26,064
- − Mortgage interest
- −$13,998
- − Property taxes
- −$3,332
- − Insurance
- −$1,250
- − Repairs & maintenance
- −$2,085
- − Management
- −$2,085
- − Depreciation
- −$7,270
- Taxable loss
- −$3,956
- Est. tax savings @ 24.0%
- +$949
- After-tax cash flow
- $1,233/yr
For passive investors: Depreciation is non-cash, so a rental often shows a tax loss while cash-flowing — sheltering income. Rental losses are passive: they offset passive income freely, and up to $25,000/yr can offset ordinary (W-2) income if you actively participate and your MAGI is under $100k (phasing out to $0 by $150k); unused losses carry forward. On sale, claimed depreciation is recaptured at up to 25%, and gains may owe capital-gains tax (a 1031 exchange can defer both). Figures are a year-1 estimate at your 24.0% rate — not tax advice; consult a CPA.
Schools (NCES district)
- District
- Regional School District 15
- NCES district ID
- 0903537
- Math proficiency
- 56% ▼ -15.00%
- Reading proficiency
- 64% ▼ -11.00%
- Median HH income
- $84,697
- Composite
- 54.36/100
- National rank
- #1361
- State rank
- #46 of 153 in CT
Livability — Southbury
No livability data for this city. (Only ~50 U.S. cities are tracked.)
Census & demographics
- Population (ZIP)
- 19,973
Population outlook (Naugatuck Valley County) Hauer SSP2
- By 2040
- 496,846
Race, ethnicity, and origin ACS 2023
- Neighborhood character
- Predominantly White (83%)
- Race & ethnicity
- White 83% Hispanic / Latino 9% Two or more races 7% Asian 3% Black 2%
- Hispanic origin (detail)
- Puerto Rican 4%
- Common ancestry
- Romanian 5% Lithuanian 3% Scotch-Irish 2%
- Foreign-born
- 8% · China, Canada, Jamaica
- Languages at home
- 89% English-only · Spanish 4% Chinese 2% Other Indo-European 2%
Political lean MEDSL · Naugatuck Valley
- 2024 margin
- Lean R (+7.4) · D 45.6% · R 53.0% · Other 1.4%
- All cycles
- 2024: R+7.4
Not yet ingested
- Civics
- —
Market trends
- HPI YoY
- ▼ -124.35%
- Current HPI
- 165.0514
- Rent YoY
- —
- Metro
- —
- State GDP YoY
- ▲ 1.06%
- F500 in state
- 38
Industry mix (Fortune 500 HQ in CT)
| Industry | F500 HQs | Revenue |
|---|---|---|
| Industrial Machinery | 4 | $38B |
|
||
| Insurance | 3 | $71B |
|
||
| Financial Services | 2 | $25B |
|
||
| Transportation / Logistics | 2 | $18B |
|
||
| Healthcare | 1 | $247B |
|
||
| Telecommunications | 1 | $55B |
|
||
Price history
1 event — show timeline
- 2026-04-30 Listed $249,900 Smart MLS
Property tax history
-0.7%/yrLatest (2023): $3,332 · -12.8% YoY. Source: county tax records.
Cash-flow waterfall
monthlySold comps — $/sqft
last 12 mo · ≤1 miLoading sold comps…