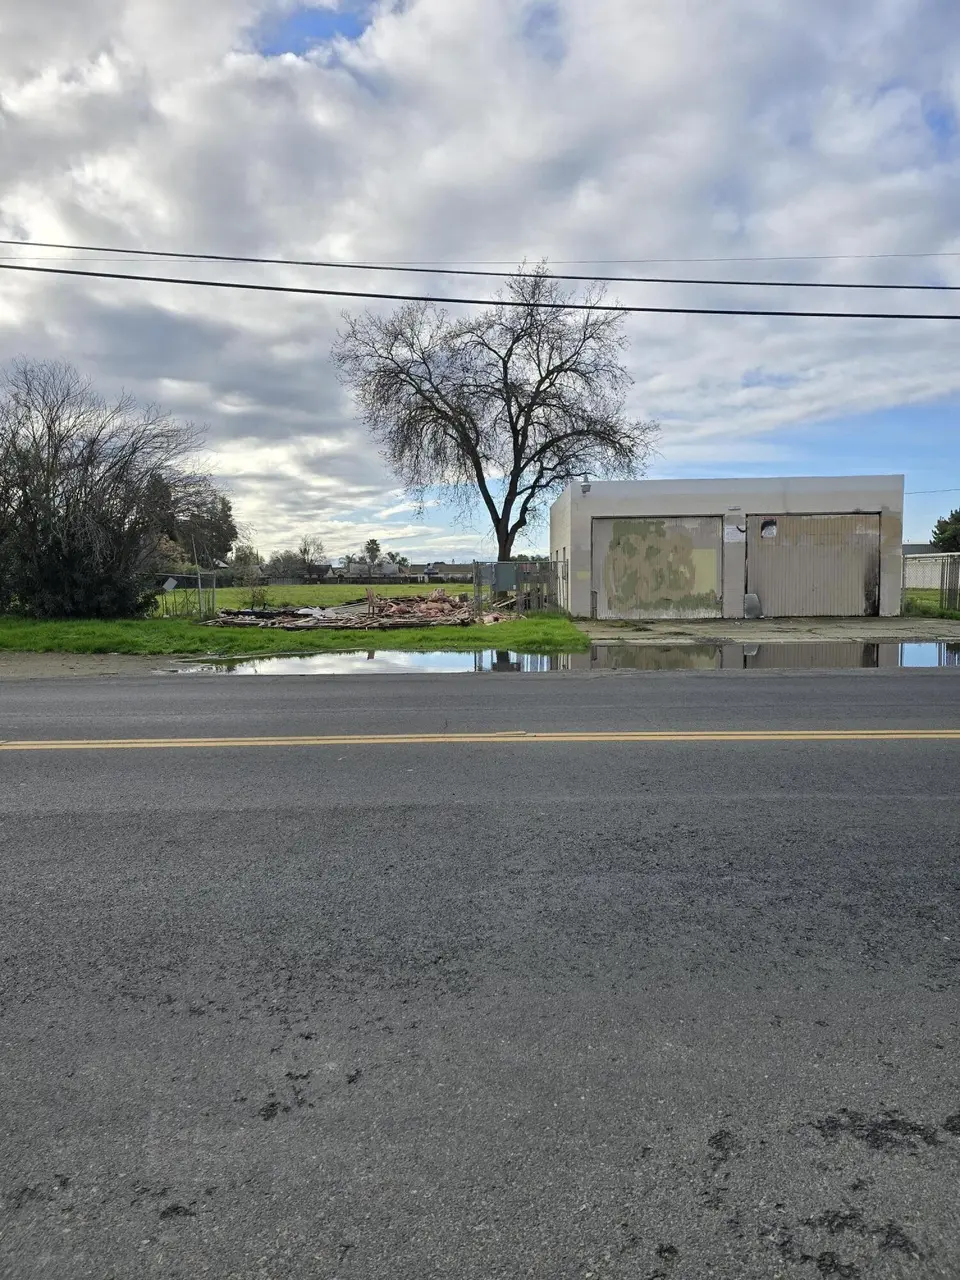
1915 E Houston Ave · Visalia, CA
Flood risk 5/10 · Moderate
- FEMA flood zone
- AE
- Chance of flooding over 30 yrs
- 0.67%
- Est. flood insurance / yr
- $1,737 – $8,500
Fire risk 7/10 · Major
- Est. fire insurance / yr
- $659 – $1,223
Heat risk 8/10 · Major
- Hot days now (above 105°F)
- 7 days/yr
- Hot days in 30 yrs
- 18 days/yr
Wind risk 1/10 · Minimal
- Chance of severe wind over 30 yrs
- —
Air-quality risk 10/10 · Severe
- Unhealthy air days now
- 40 days/yr
- Unhealthy air days in 30 yrs
- 43 days/yr
Risk factors via First Street. Map © Google.
Why this score? — see what drove the C- grade
The composite is a weighted blend of 9 inputs, each scored 0–100. Each bar is that input's sub-score; the figure is the points it added to the 100-point composite (weight × sub-score).
- Cash flow +21.9/30.0
- ARV discount +7.5/15.0
- DSCR +7.0/10.0
- 1% rule +5.7/10.0
- Livability +3.6/5.0
- Rent growth +3.0/5.0
- Schools +3.0/10.0
- Condition / age +2.5/5.0
- Appreciation +0.0/10.0
$169,900
🖨 Deal sheet 📄 Offer letter ✓ Due diligence
Listing remarks MLS
One building on this lot. Zoned High Density Multi Family. It is unlikely the city will grant a commercial use here but you can ask them. There is water service and electricity to the property not currently connected.
Key facts
- Vacant down to studs
- Two buildings on lot
- 0.26 acre lot
Tags
Neighborhood map
What this means for you Summary
Snapshot
- This is a ?-bed/1.0-bath single-family listed at $170k.
Deal economics
- At list price, monthly cash flow is $-158 ($-2k/yr) — negative.
- To cash-flow at today's rent, offer at most $147k (13.4% below list).
- Meets the 1% rule at list price ($2k rent vs $170k).
- Recommended offer: $147k (13.4% below list) — sets the bar for cash-flow.
- Cap rate 8.2% vs local median 3.3% in Visalia — top-decile yield for the area; either an underpriced asset or a hidden risk that comps aren't pricing in. Stress-test before assuming the spread holds.
Location & tenants
- Location reads 72/100 on livability (#196 in CA) — a middle-class / working-renter tenant base. Strengths: commute A+, housing A+, employment B; Watch: amenities D, crime D-, cost of living F.
- Visalia Unified (urban): math 30% / reading 40% proficiency, ranked #273 of 517 in CA (top 53%) — families likely to look elsewhere, expect single-tenant / working-renter base with shorter leases.
- Market conditions: Rents rising (+2.0%/yr); 309 active listings in the ZIP; 13 comparable units currently listed for rent nearby; rentals at typical pace (median 21d on market — plan ~3-4 weeks tenant-placement turnaround); 46% of comp listings sitting > 30 days — soft ceiling on asking rent; solid renter incomes; 1,447 units permitted in Tulare County in 2024 (307 in 5+ unit buildings).
Forward outlook
- Local home prices are declining (-3.0%/yr); year-one equity from $1k of loan paydown is wiped out by about $5k of value loss. Plan a longer hold.
- Tulare County population projected at +10% by 2050 — modest demand growth; plan on rents tracking national, not racing it.
Negotiation context
- It's been on market 729 days — a 12% lower offer ($150k) is reasonable based on typical stale-listing flexibility.
Risks & watch-outs
- Watch-outs: flood insurance adds $427/mo; built in 1900 — expect roof / HVAC / electrical / plumbing capex.
- Climate carrying-cost: in FEMA flood zone AE (mandatory federal flood insurance); major wildfire risk; extreme-heat days projected 7→18/yr by 2055 (HVAC capex compounding) — expect insurance premiums to compound above CPI over the hold.
Questions for the listing agent
- What do current leases actually rent for vs. the listed asking? Can we see a recent rent roll and the last 12 months of T-12 income?
- It's been on market 729 days. Have you received any prior offers? Is the seller open to a 13% concession, seller financing, or rate buy-down credit?
- Built in 1900 — when were the roof, HVAC, electrical panel, plumbing, and water heater last replaced?
- What's the actual annual flood-insurance premium (NFIP or private), and is the property in a SFHA with mandatory coverage?
- Why hasn't it sold? Are there any deal-killer items the seller is aware of (foundation, flood, title, zoning, code violations)?
- Is there a deadline driving the sale (1031 exchange, divorce, estate, relocation)? That informs how much negotiation room exists.
- Crime grade is D in this area — have there been break-ins, vandalism, or insurance claims at this property in the last 3 years? What carrier currently insures it and at what premium?
- What's the average days-on-market for RENTAL listings here right now (not sales)? A rising rental-DOM trend means longer vacancies and softer asking-rent achievability than the comps imply.
- What's the recent tenant-quality profile in this submarket — average credit score on applications, eviction rate, late-payment / NSF rate, and stable-employment percentage? A property-management company in the area should have these aggregated.
- How much new for-sale + rental construction is in the pipeline within 1–3 miles? Heavy new supply typically softens prices + rents 12–24 months out; constrained supply supports both.
Investment metrics
- 1% rule
- 1.07% ✓
- Cap rate
- 8.19%
- Cash-on-cash
- 6.78%
- DSCR
- 1.30
- GRM
- 7.8
CMA / ARV
- ARV (median comp)
- $372,381
- List price
- $169,900
- Delta
- -54.37%
- Verdict
- UNDERPRICED
- Comps
- 6 within 2.0 mi
Show comp detail 12 sales within ~0.75 mi
| Address | Dist | Beds/Ba | Sqft | Sold | Price | $/sf | Match |
|---|---|---|---|---|---|---|---|
| 2005 E Roosevelt Ct | 0.17mi | 3/2.0 | 1,171 (+2%) | 0mo | $337,000 | $288 | 85 |
| 1029 N Gowdy St | 0.31mi | 3/2.0 | 1,120 (-3%) | 5mo | $299,000 | $267 | 72 |
| 2238 N Gowdy St | 0.61mi | 3/2.0 | 1,148 (-0%) | 1mo | $310,000 | $270 | 66 |
| 1301 N Enos St | 0.30mi | 3/2.0 | 1,015 (-12%) | 3mo | $305,000 | $300 | 60 |
| 1441 E Sunnyview Ave | 0.68mi | 3/2.0 | 1,148 (-0%) | 6mo | $215,000 | $187 | 59 |
| 1107 N Enos St | 0.33mi | 3/2.0 | 1,008 (-12%) | 7mo | $304,000 | $302 | 54 |
| 1835 E Babcock Ave | 0.51mi | 2/1.8 | 1,051 (-9%) | 6mo | $270,000 | $257 | 53 |
| 123 Omalley St Unit Mw123 | 0.52mi | 3/2.0 | 1,298 (+13%) | 3mo | $387,700 | $299 | 48 |
| 1315 E Vine Ct | 0.48mi | 3/2.0 | 1,295 (+12%) | 6mo | $359,000 | $277 | 48 |
| 1908 N Cedar Ct | 0.59mi | 4/2.0 | 1,299 (+13%) | 2mo | $305,000 | $235 | 46 |
| 233 N O'malley St Unit Mw131 | 0.61mi | 3/2.0 | 1,298 (+13%) | 7mo | $403,943 | $311 | 40 |
| 323 Omalley St Unit Mw136 | 0.61mi | 3/2.0 | 1,298 (+13%) | 8mo | $389,900 | $300 | 39 |
Match score weights: distance 35% · size 25% · config 20% · recency 20%. Top-matched comps best support the ARV.
Projected returns pro-forma
-3.0% appreciation · 1.99% rent growth · sell at horizon
- IRR
- -24.4%
- Equity multiple
- 0.18×
- Total profit
- $-39,131
- Equity at exit
- $25,333
- IRR
- -23.7%
- Equity multiple
- -0.12×
- Total profit
- $-53,230
- Equity at exit
- $14,690
Cash invested: $47,572 (down + closing). Projections, not guarantees.
Landlord ↔ Tenant lean methodology
- Overall (STATE)
- 18 Strongly Tenant-Friendly
- State California
- 18 Strongly Tenant-Friendly · D+13
- County
- — inherits STATE
- City
- — inherits STATE
ZIP-level market 93292
- Rents YoY
- 2.0%
- Active inventory
- 309
- Price-to-rent
- 7.8×
Monthly cashflow live
- Estimated rent
- $1,826 high interval (Pro) →
- Mortgage (P&I)
- −$891
- Tax est. 1.5%
- −$212 /mo · $2,548/yr
- Insurance
- −$71
- Flood insurance flood zone
- −$427 /mo · $5,118/yr
- HOA
- −$0
- Vacancy / Maint / Mgmt
- −$384
- Net cashflow
- $-158
Break-even live
UW: 25.0% down · 7.5% · 30yr · 1.5% tax · 5.0% vac · 8.0% maint · 8.0% mgmt
Financing live
Cash to close
- Down payment
- $42,475
- Closing costs
- $5,097
- Reserves months
- —
- Total cash needed
- —
Loan-product check · same deal, 3 products live
Conventional
25% down · 7.5% · 30yr
- Down + closing
- —
- Monthly P&I
- —
- Monthly cashflow
- —
- DSCR
- —
- Eligible?
- —
Personal DTI + credit; lowest rate.
DSCR
20% down · 8.5% · 30yr
- Down + closing
- —
- Monthly P&I
- —
- Monthly cashflow
- —
- DSCR
- —
- Eligible?
- —
No personal income docs; deal must DSCR.
Hard money
10% down · 12.0% · 12mo
- Down + closing
- —
- Monthly P&I
- —
- Monthly cashflow
- —
- DSCR
- —
- Eligible?
- —
Short-term bridge; refi at stabilization.
Rent comps 13 comps
| Address | Beds | Baths | Sqft | Rent | $/sqft | DOM | Units | Dist |
|---|---|---|---|---|---|---|---|---|
| 2008 E Douglas Ave Visalia, CA | 3.0 | 2.0 | 1171 | $1,900 | $1.62 | 43d | 1 | 0.25mi |
| 1630 E Knight Ct Visalia, CA | 3.0 | 2.0 | 1419 | $1,895 | $1.34 | 43d | 1 | 0.58mi |
| 803 E Prospect Ave Visalia, CA | 2.0 | 1.0 | 960 | $1,495 | $1.56 | 21d | 1 | 0.73mi |
| 907 E Oakridge Ave Visalia, CA | 2.0 | 2.0 | 1009 | $1,695 | $1.68 | 21d | 1 | 0.94mi |
| 3510 E Roosevelt Ave Visalia, CA | 3.0 | 2.0 | 1376 | $1,800 | $1.31 | 43d | 1 | 1.01mi |
| 723 N Simon St Visalia, CA | 3.0 | 2.0 | 1450 | $2,100 | $1.45 | 13d | 1 | 1.01mi |
| 3822 E Four Creeks Ct Visalia, CA | 3.0 | 2.0 | 1425 | $1,895 | $1.33 | 43d | 1 | 1.20mi |
| 711 E Noble Ave Unit 82504 Visalia, CA | 2.0 | 1.0 | 792 | $1,350 | $1.70 | 43d | 1 | 1.31mi |
| 711 E Noble Ave Unit 711C5 Visalia, CA | 2.0 | 1.0 | 900 | $1,350 | $1.50 | 21d | 1 | 1.31mi |
| 528 N Encina St Unit 530A Visalia, CA | 3.0 | 1.0 | 1125 | $1,795 | $1.60 | 21d | 1 | 1.34mi |
| 2521 E Westcott Ave Visalia, CA | 2.0 | 1.0 | 1050 | $1,650 | $1.57 | 43d | 1 | 1.43mi |
| 1113 S Pinkham St Visalia, CA | 2.0 | 2.5 | 1450 | $1,695 | $1.17 | 21d | 1 | 1.45mi |
| 432 S Bridge St Visalia, CA | 3.0 | 2.0 | 1200 | $1,895 | $1.58 | 13d | 1 | 1.46mi |
Listing history 21 events
-
2026-06-18days on market $169,900 Active 729 DOM
-
2026-06-17days on market $169,900 Active 728 DOM
-
2026-06-16days on market $169,900 Active 727 DOM
-
2026-06-15days on market $169,900 Active 726 DOM
-
2026-06-14days on market $169,900 Active 724 DOM
-
2026-06-13days on market $169,900 Active 723 DOM
-
2026-06-10days on market $169,900 Active 721 DOM
-
2026-06-09days on market $169,900 Active 720 DOM
-
2026-06-08days on market $169,900 Active 719 DOM
-
2026-06-07days on market $169,900 Active 718 DOM
-
2026-06-05days on market $169,900 Active 715 DOM
-
2026-06-03days on market $169,900 Active 714 DOM
-
2026-06-02days on market $169,900 Active 713 DOM
-
2026-06-01days on market $169,900 Active 712 DOM
-
2026-05-31days on market $169,900 Active 711 DOM
-
2026-05-30days on market $169,900 Active 710 DOM
-
2025-12-18price $169,900 217-char remark
Show marketing remark (217 chars)
One building on this lot. Zoned High Density Multi Family. It is unlikely the city will grant a commercial use here but you can ask them. There is water service and electricity to the property not currently connected.
-
2024-06-19$189,000 Active 217-char remark
Show marketing remark (217 chars)
One building on this lot. Zoned High Density Multi Family. It is unlikely the city will grant a commercial use here but you can ask them. There is water service and electricity to the property not currently connected.
-
2021-04-23soldstatus $255,000
-
2012-05-18soldstatus $65,000
-
2012-04-16soldstatus $50,000
ⓘ Source: listings_history table (triggers on properties + properties_extension) + one-shot
backfill from property_details.listing_events for pre-trigger history.
Climate risk First Street
- Flood 5/10 Major FEMA zone AE · 67% chance over 30 yrs
- Wildfire 7/10 Severe
- Heat 8/10 Severe 7 d/yr ≥105°F today · 18 d/yr by 30 yrs out
- Wind 1/10 Low
- Air quality 10/10 Extreme 40 unhealthy d/yr today · 43 by 30 yrs out
Nearby sold comps map
Loading sold comps map…
Walkable amenities ~0.75 mi
Loading nearby amenities…
Taxation est. · year 1
- Rental income
- $21,917
- − Mortgage interest
- −$9,517
- − Property taxes
- −$2,548
- − Insurance
- −$5,968
- − Repairs & maintenance
- −$1,753
- − Management
- −$1,753
- − Depreciation
- −$4,943
- Taxable loss
- −$4,566
- Est. tax savings @ 24.0%
- +$1,096
- After-tax cash flow
- $-798/yr
For passive investors: Depreciation is non-cash, so a rental often shows a tax loss while cash-flowing — sheltering income. Rental losses are passive: they offset passive income freely, and up to $25,000/yr can offset ordinary (W-2) income if you actively participate and your MAGI is under $100k (phasing out to $0 by $150k); unused losses carry forward. On sale, claimed depreciation is recaptured at up to 25%, and gains may owe capital-gains tax (a 1031 exchange can defer both). Figures are a year-1 estimate at your 24.0% rate — not tax advice; consult a CPA.
Schools (NCES district)
- District
- Visalia Unified
- NCES district ID
- 0641160
- Math proficiency
- 30% ▼ -3.00%
- Reading proficiency
- 40% ▼ -10.00%
- Median HH income
- $51,672
- Composite
- 30.47/100
- National rank
- #6223
- State rank
- #273 of 517 in CA
Livability — Visalia
- Score
- 72/100
- State rank
- #196
- US rank
- #6351
Category grades
Schools grade is shown separately in the Schools card above.
Census & demographics
- Census place
- Visalia, CA
- County
- Tulare County · 323,826 people
- City population
- 163,333
- Metro
- Visalia, CA
- Population (ZIP)
- 45,780
- Household income
- $82,872
- Rent vs Own
- Severe rent burden
- 962.0
Population outlook (Tulare County) Hauer SSP2
- Today (2025)
- 484,681 people
- By 2030
- 496,241 · +2.4%
- By 2040
- 518,507 · +7.0%
- By 2050
- 534,920 · +10.4%
- By 2075
- 548,417 · +13.2%
- By 2100
- 513,085 · +5.9%
Race, ethnicity, and origin ACS 2023
- Neighborhood character
- Diverse neighborhood (Simpson 0.56)
- Race & ethnicity
- Hispanic / Latino 57% White 35% Two or more races 19% Asian 3% Black 2% Native American 1%
- Hispanic origin (detail)
- Mexican 51%
- Common ancestry
- Russian 2% Lithuanian 2% Iranian 1%
- Foreign-born
- 14% · Canada
- Languages at home
- 63% English-only · Spanish 33% Other Indo-European 1% Korean 1%
Political lean MEDSL · Tulare
- 2024 margin
- Strong R (+20.7) · D 38.5% · R 59.2% · Other 2.3%
- 2008→2024 swing
- -5.4pp toward R · 2008: -15.3pp · 2024: -20.7pp
- All cycles
- 2024: R+20.7 2020: R+7.8 2016: R+12.1 2012: R+17.8 2008: R+15.3
Not yet ingested
- Civics
- —
Market trends
- HPI YoY
- ▼ -238.10%
- Current HPI
- 323.2649
- Rent YoY
- ▲ 1.99%
- Metro
- Visalia, CA
- State GDP YoY
- ▲ 3.21%
- F500 in state
- 116
Industry mix (Fortune 500 HQ in CA)
| Industry | F500 HQs | Revenue |
|---|---|---|
| Technology | 27 | $1,492B |
|
||
| Financial Services | 3 | $174B |
|
||
| Retail | 3 | $44B |
|
||
| Insurance | 3 | $26B |
|
||
| Media / Entertainment | 2 | $115B |
|
||
| Pharmaceuticals / Biotech | 2 | $62B |
|
||
Price history
+239.8% since first listed5 events — show timeline
- 2025-12-18 Price Changed $169,900 TCMLS
- 2024-06-19 Listed $189,000 TCMLS
- 2021-04-23 Sold (Public Records) $255,000 Public Records
- 2012-05-18 Sold (Public Records) $65,000 Public Records
- 2012-04-16 Sold (Public Records) $50,000 Public Records
Property tax history
-42.2%/yrLatest (2021): $12 · -94.9% YoY. Source: county tax records.
Cash-flow waterfall
monthlySold comps — $/sqft
last 12 mo · ≤1 miLoading sold comps…