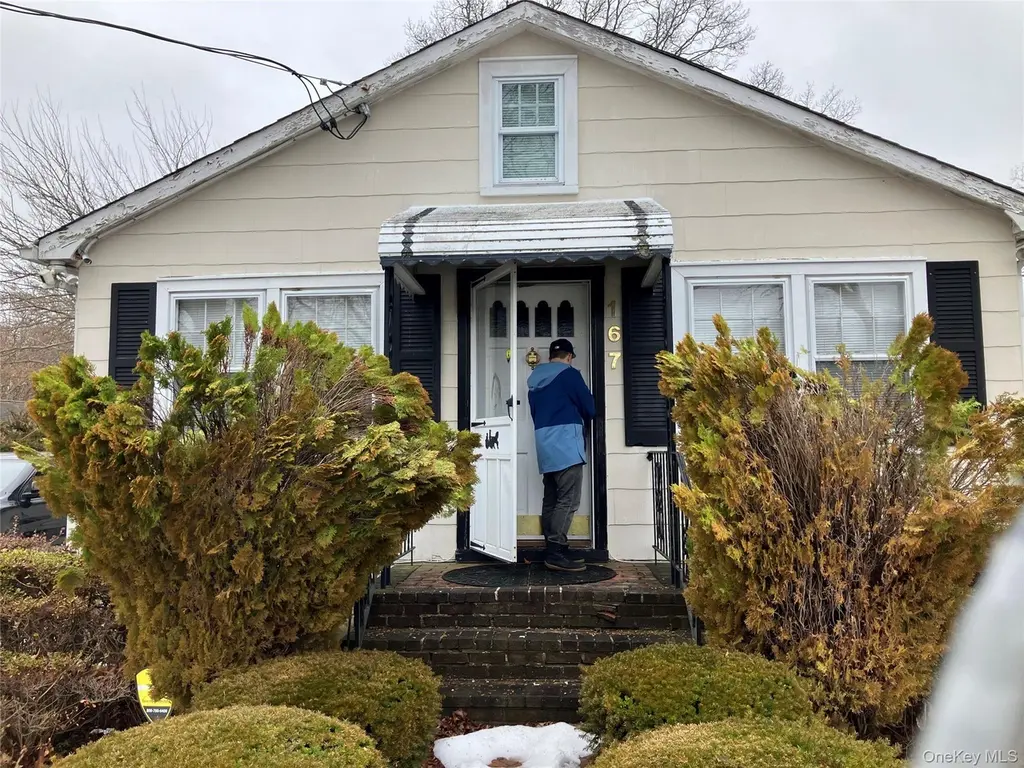
167 Cedar Rd E · Mastic Beach, NY
Flood risk 1/10 · Minimal
- FEMA flood zone
- X (unshaded)
- Chance of flooding over 30 yrs
- 0.0%
- Est. flood insurance / yr
- $473 – $860
Fire risk 1/10 · Minimal
- Est. fire insurance / yr
- $691 – $1,283
Heat risk 4/10 · Minor
- Hot days now (above 91°F)
- 7 days/yr
- Hot days in 30 yrs
- 19 days/yr
Wind risk 8/10 · Major
- Chance of severe wind over 30 yrs
- 80.0%
Air-quality risk 4/10 · Minor
- Unhealthy air days now
- 3 days/yr
- Unhealthy air days in 30 yrs
- 5 days/yr
Risk factors via First Street. Map © Google.
Why this score? — see what drove the B- grade
The composite is a weighted blend of 9 inputs, each scored 0–100. Each bar is that input's sub-score; the figure is the points it added to the 100-point composite (weight × sub-score).
- Cash flow +20.4/30.0
- ARV discount +15.0/15.0
- Appreciation +10.0/10.0
- DSCR +6.5/10.0
- 1% rule +5.1/10.0
- Schools +4.7/10.0
- Livability +3.1/5.0
- Rent growth +2.5/5.0
- Condition / age +2.5/5.0
$299,000
🖨 Deal sheet (PDF) 📄 Offer letter ✓ Due diligence
Listing remarks MLS
Premises in fair condition. Good bones, needs renovation. Spacious lot size.
Key facts
- 7,841 sq ft lot
- Pool
- Built 1940
Neighborhood map
What this means for you Summary
Snapshot
- This is a 2-bed/1.0-bath single-family listed at $299k.
Deal economics
- At list price, monthly cash flow is $386 ($5k/yr) — positive.
- The deal already cash-flows at list — no discount required.
- Meets the 1% rule at list price ($3k rent vs $299k).
- Recommended offer: $281k (6.0% below list) — sets the bar for market timing.
- Cap rate 7.8% vs local median 4.7% in Mastic Beach — top-decile yield for the area; either an underpriced asset or a hidden risk that comps aren't pricing in. Stress-test before assuming the spread holds.
Location & tenants
- Location reads 61/100 on livability (#936 in NY) — a middle-class / working-renter tenant base. Strengths: employment A+, housing A+; Watch: crime D, amenities F, commute F.
- William Floyd Union Free School District (suburban): math 48% / reading 57% proficiency, ranked #309 of 590 in NY (top 52%) — acceptable for families but not a draw, mixed tenant base, ~2y average lease.
- Zoned schools: Tangier Smith Elementary School (math 43% / reading 54%, grade D, #1,181 of 2,108 statewide, top 56%, 755 students, 61% FRL); William Paca Middle School (math 31% / reading 37%, grade F, #497 of 729 statewide, top 69%, 1,009 students, 59% FRL); William Floyd High School (math 65% / reading 87%, grade A-, #616 of 1,100 statewide, top 57%, 3,013 students, 54% FRL) — zoned schools average 58% FRL vs 43% district-wide (15 pts higher); higher-poverty schools than district average — tighter screening recommended.
- Market conditions: 135 active listings in the ZIP; 2 comparable units currently listed for rent nearby; 1,366 units permitted in Suffolk County in 2024 (216 in 5+ unit buildings).
Forward outlook
- In year one you build about $32k of equity ($2k loan paydown + $30k appreciation (10.0% local appreciation)).
- Suffolk County population projected to shrink 5% by 2050 — rents likely to lag national; underwrite the cash flow, not the appreciation.
- At projected returns (10.0% appreciation + 3.0% rent growth), your $84k cash investment doubles in ~3 years — after that, you're playing with house money.
- By year 2, paydown + projected appreciation supports a ~$51k cash-out refi (75% LTV) — recoverable capital for the next deal without selling this one.
Negotiation context
- It's been on market 76 days — a 6% lower offer ($281k) is reasonable based on typical stale-listing flexibility.
Risks & watch-outs
- Watch-outs: built in 1940 — expect roof / HVAC / electrical / plumbing capex.
- Climate carrying-cost: severe wind risk, 80% chance of damaging wind over 30y — expect insurance premiums to compound above CPI over the hold.
Questions for the listing agent
- It's been on market 76 days. Have you received any prior offers? Is the seller open to a 6% concession, seller financing, or rate buy-down credit?
- Built in 1940 — when were the roof, HVAC, electrical panel, plumbing, and water heater last replaced?
- Why hasn't it sold? Are there any deal-killer items the seller is aware of (foundation, flood, title, zoning, code violations)?
- Is there a deadline driving the sale (1031 exchange, divorce, estate, relocation)? That informs how much negotiation room exists.
- Schools are D-rated, which usually means shorter tenancies and higher turnover. Who's the typical renter profile here, and what's been the actual vacancy rate?
- Crime grade is D in this area — have there been break-ins, vandalism, or insurance claims at this property in the last 3 years? What carrier currently insures it and at what premium?
- What's the average days-on-market for RENTAL listings here right now (not sales)? A rising rental-DOM trend means longer vacancies and softer asking-rent achievability than the comps imply.
- What's the recent tenant-quality profile in this submarket — average credit score on applications, eviction rate, late-payment / NSF rate, and stable-employment percentage? A property-management company in the area should have these aggregated.
- How much new for-sale + rental construction is in the pipeline within 1–3 miles? Heavy new supply typically softens prices + rents 12–24 months out; constrained supply supports both.
Investment metrics
- 1% rule
- 1.01% ✓
- Cap rate
- 7.84%
- Cash-on-cash
- 5.54%
- DSCR
- 1.25
- GRM
- 8.3
CMA / ARV
- ARV (median comp)
- $408,374
- List price
- $299,000
- Delta
- -26.78%
- Verdict
- UNDERPRICED
- Comps
- 20 within 1.0 mi
Show comp detail 12 sales within ~0.75 mi
| Address | Dist | Beds/Ba | Sqft | Sold | Price | $/sf | Match |
|---|---|---|---|---|---|---|---|
| 154 Jefferson Dr | 0.17mi | 2/1.0 | 836 (-2%) | 4mo | $380,000 | $455 | 86 |
| 129 Locust Dr | 0.06mi | 2/1.0 | 800 (-6%) | 8mo | $371,000 | $464 | 81 |
| 119 Hemlock Dr | 0.23mi | 2/1.0 | 824 (-3%) | 13mo | $458,000 | $556 | 73 |
| 19 Lacrosse Rd | 0.10mi | 2/1.0 | 740 (-13%) | 3mo | $275,000 | $372 | 71 |
| 186 Cranberry Dr | 0.43mi | 2/1.0 | 900 (+6%) | 11mo | $320,000 | $356 | 62 |
| 113 Mckinley Dr | 0.40mi | 2/1.0 | 918 (+8%) | 10mo | $417,000 | $454 | 59 |
| 142 Daisy Dr | 0.22mi | 3/1.0 (+1) | 957 (+13%) | 8mo | $315,000 | $329 | 57 |
| 255 Mckinley Dr | 0.48mi | 3/1.0 (+1) | 798 (-6%) | 11mo | $387,500 | $486 | 53 |
| 80 Diana Dr | 0.67mi | 1/1.0 (-1) | 835 (-2%) | 11mo | $375,000 | $449 | 52 |
| 94 Elder Dr | 0.62mi | 3/1.0 (+1) | 900 (+6%) | 8mo | $368,000 | $409 | 50 |
| 21 Sherwood Dr | 0.67mi | 3/1.0 (+1) | 800 (-6%) | 9mo | $350,000 | $438 | 47 |
| 129 Lakeview Dr | 0.72mi | 3/1.0 (+1) | 954 (+12%) | 1mo | $515,000 | $540 | 40 |
Match score weights: distance 35% · size 25% · config 20% · recency 20%. Top-matched comps best support the ARV.
Projected returns pro-forma
10.0% appreciation · 3.0% rent growth · sell at horizon
- IRR
- 28.3%
- Equity multiple
- 3.24×
- Total profit
- $187,453
- Equity at exit
- $269,363
- IRR
- 24.6%
- Equity multiple
- 7.36×
- Total profit
- $532,666
- Equity at exit
- $580,891
Cash invested: $83,720 (down + closing). Projections, not guarantees.
Landlord ↔ Tenant lean methodology
- Overall (STATE)
- 15 Strongly Tenant-Friendly
- State New York
- 15 Strongly Tenant-Friendly · D+10
- County
- — inherits STATE
- City
- — inherits STATE
ZIP-level market 11951
- Home prices YoY
- 4.3%
- Active inventory
- 135
- Price-to-rent
- 8.3×
Monthly cashflow live
- Estimated rent
- $3,011 medium interval (Pro) →
- Mortgage (P&I)
- −$1,568
- Tax from tax record
- −$300 /mo · $3,600/yr
- Insurance
- −$125
- HOA
- −$0
- Vacancy / Maint / Mgmt
- −$632
- Net cashflow
- $386
Break-even live
Sensitivity live
| Price | -10% $556 | -5% $471 | +0% $386 | +5% $302 | +10% $217 |
|---|---|---|---|---|---|
| Rent | -10% $149 | -5% $267 | +0% $386 | +5% $505 | +10% $624 |
| Rate | -1.0pp $537 | -0.5pp $462 | base $386 | +0.5pp $309 | +1.0pp $230 |
UW: 25.0% down · 7.5% · 30yr · 1.5% tax · 5.0% vac · 8.0% maint · 8.0% mgmt
Financing live
Cash to close
- Down payment
- $74,750
- Closing costs
- $8,970
- Reserves months
- —
- Total cash needed
- —
Loan-product check · same deal, 3 products live
Conventional
25% down · 7.5% · 30yr
- Down + closing
- —
- Monthly P&I
- —
- Monthly cashflow
- —
- DSCR
- —
- Eligible?
- —
Personal DTI + credit; lowest rate.
DSCR
20% down · 8.5% · 30yr
- Down + closing
- —
- Monthly P&I
- —
- Monthly cashflow
- —
- DSCR
- —
- Eligible?
- —
No personal income docs; deal must DSCR.
Hard money
10% down · 12.0% · 12mo
- Down + closing
- —
- Monthly P&I
- —
- Monthly cashflow
- —
- DSCR
- —
- Eligible?
- —
Short-term bridge; refi at stabilization.
Rent comps 2 comps
| Address | Beds | Baths | Sqft | Rent | $/sqft | DOM | Units | Dist |
|---|---|---|---|---|---|---|---|---|
| 5 Cedar Rd E Mastic Beach, NY | 3.0 | 1.0 | 740 | $2,900 | $3.92 | 0d | 1 | 0.76mi |
| 12 Hackensack Rd Mastic Beach, NY | 3.0 | 1.0 | 792 | $3,150 | $3.98 | 18d | 1 | 1.01mi |
Listing history 16 events
-
2026-06-21days on market $299,000 Active 76 DOM
-
2026-06-18days on market $299,000 Active 73 DOM
-
2026-06-17days on market $299,000 Active 72 DOM
-
2026-06-16days on market $299,000 Active 71 DOM
-
2026-06-15days on market $299,000 Active 70 DOM
-
2026-06-13days on market $299,000 Active 68 DOM
-
2026-06-13days on market $299,000 Active 67 DOM
-
2026-06-09days on market $299,000 Active 64 DOM
-
2026-06-08days on market $299,000 Active 63 DOM
-
2026-06-07days on market $299,000 Active 62 DOM
-
2026-06-04days on market $299,000 Active 59 DOM
-
2026-06-03days on market $299,000 Active 58 DOM
-
2026-06-02days on market $299,000 Active 57 DOM
-
2026-06-01days on market $299,000 Active 56 DOM
-
2026-05-31days on market $299,000 Active 55 DOM
-
2026-04-06$299,000 Active 76-char remark
Show marketing remark (76 chars)
Premises in fair condition. Good bones, needs renovation. Spacious lot size.
ⓘ Source: listings_history table (triggers on properties + properties_extension) + one-shot
backfill from property_details.listing_events for pre-trigger history.
Tax reassessment forecast NY · Partial reset (capped growth)
- Current annual tax
- $3,600 · $300/mo
- Projected year-2 tax
- $4,326 · $361/mo
- Expected delta
- +$727/yr (+$61/mo · 20.2%)
ⓘ Screening estimate from a state-policy table — verify with the county assessor before closing.
Climate risk First Street
- Flood 1/10 Low FEMA zone X (unshaded) · 0% chance over 30 yrs
- Wildfire 1/10 Low
- Heat 4/10 Moderate 7 d/yr ≥91°F today · 19 d/yr by 30 yrs out
- Wind 8/10 Severe 80% chance of damaging wind over 30 yrs
- Air quality 4/10 Moderate 3 unhealthy d/yr today · 5 by 30 yrs out
Nearby sold comps map
Loading sold comps map…
Walkable amenities ~0.75 mi
Loading nearby amenities…
Taxation est. · year 1
- Rental income
- $36,136
- − Mortgage interest
- −$16,749
- − Property taxes
- −$3,600
- − Insurance
- −$1,495
- − Repairs & maintenance
- −$2,891
- − Management
- −$2,891
- − Depreciation
- −$8,698
- Taxable loss
- −$187
- Est. tax savings @ 24.0%
- +$45
- After-tax cash flow
- $4,682/yr
For passive investors: Depreciation is non-cash, so a rental often shows a tax loss while cash-flowing — sheltering income. Rental losses are passive: they offset passive income freely, and up to $25,000/yr can offset ordinary (W-2) income if you actively participate and your MAGI is under $100k (phasing out to $0 by $150k); unused losses carry forward. On sale, claimed depreciation is recaptured at up to 25%, and gains may owe capital-gains tax (a 1031 exchange can defer both). Figures are a year-1 estimate at your 24.0% rate — not tax advice; consult a CPA.
Schools (NCES district)
- District
- William Floyd Union Free School District
- NCES district ID
- 3618690
- Math proficiency
- 48% ▲ 3.00%
- Reading proficiency
- 57% ▲ 11.00%
- Median HH income
- $70,564
- Composite
- 46.79/100
- National rank
- #2383
- State rank
- #309 of 590 in NY
Livability — Mastic Beach
- Score
- 61/100
- State rank
- #936
- US rank
- #18216
Category grades
Schools grade is shown separately in the Schools card above.
Census & demographics
- Census place
- Mastic Beach, NY
- City population
- 15,830
- Population (ZIP)
- 15,830
Population outlook (Suffolk County) Hauer SSP2
- Today (2025)
- 1,505,262 people
- By 2030
- 1,498,318 · -0.5%
- By 2040
- 1,471,101 · -2.3%
- By 2050
- 1,424,848 · -5.3%
- By 2075
- 1,337,157 · -11.2%
- By 2100
- 1,217,720 · -19.1%
Race, ethnicity, and origin ACS 2023
- Neighborhood character
- Predominantly White (68%)
- Race & ethnicity
- White 68% Hispanic / Latino 17% Two or more races 9% Black 6% Asian 2%
- Hispanic origin (detail)
- Mexican 1% Puerto Rican 6% Cuban 2%
- Common ancestry
- Lithuanian 3% Romanian 2% Italian 2%
- Foreign-born
- 7% · Canada, Vietnam
- Languages at home
- 84% English-only · Spanish 10% Other Indo-European 3% Chinese 1%
Political lean MEDSL · Suffolk
- 2024 margin
- Lean R (+10.0) · D 45.0% · R 55.0%
- 2008→2024 swing
- -16.0pp toward R · 2008: 6.0pp · 2024: -10.0pp
- All cycles
- 2024: R+10.0 2020: R+0.0 2016: R+8.2 2012: D+2.9 2008: D+6.0
Not yet ingested
- Civics
- —
Market trends
- HPI YoY
- ▲ 34.46%
- Current HPI
- 829.86
- Rent YoY
- —
- Metro
- —
- State GDP YoY
- ▲ 2.60%
- F500 in state
- 92
Industry mix (Fortune 500 HQ in NY)
| Industry | F500 HQs | Revenue |
|---|---|---|
| Financial Services | 10 | $950B |
|
||
| Consumer Goods | 9 | $162B |
|
||
| Insurance | 4 | $225B |
|
||
| Telecommunications | 2 | $144B |
|
||
| Pharmaceuticals | 2 | $112B |
|
||
| Media / Entertainment | 2 | $69B |
|
||
Price history
1 event — show timeline
- 2026-04-06 Listed $299,000 OneKey® MLS as Distributed by MLS Grid
Property tax history
+17.3%/yrLatest (2025): $3,600 · +0.0% YoY. Source: county tax records.
Cash-flow waterfall
monthlySold comps — $/sqft
last 12 mo · ≤1 miLoading sold comps…