 🏷️ Likely Rental
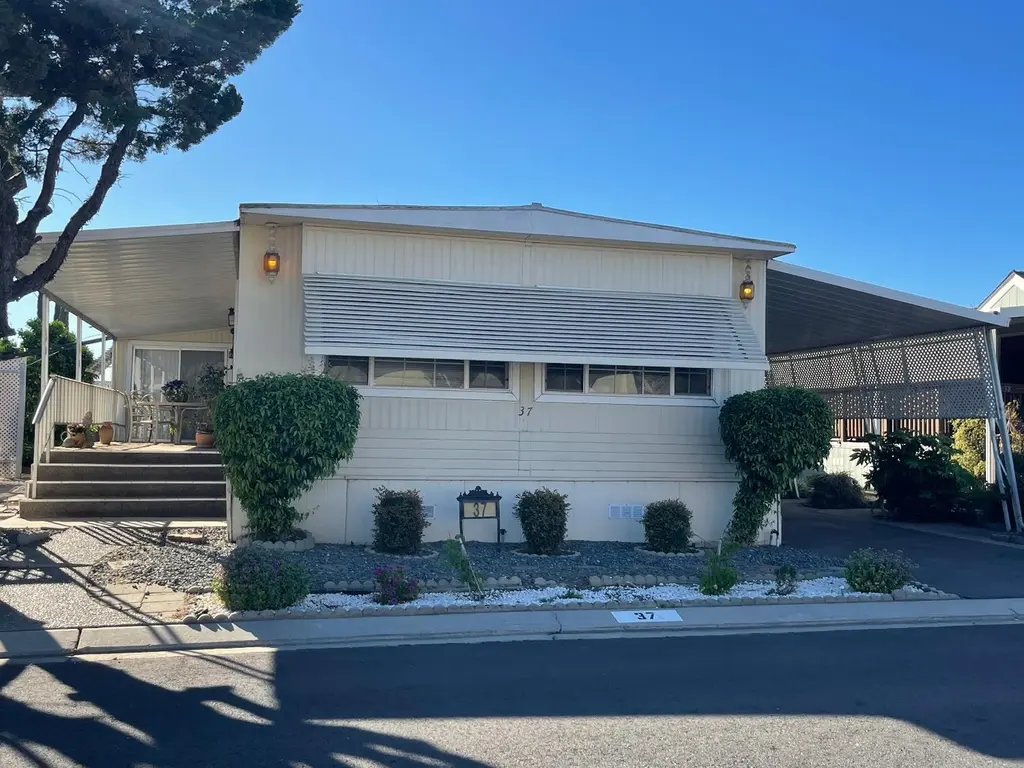
2621 Prescott Rd #37 · Modesto, CA
Flood risk 1/10 · Minimal
- FEMA flood zone
- X (unshaded)
- Chance of flooding over 30 yrs
- 0.0%
- Est. flood insurance / yr
- $507 – $1,088
Fire risk 5/10 · Moderate
- Est. fire insurance / yr
- $659 – $1,223
Heat risk 6/10 · Moderate
- Hot days now (above 102°F)
- 7 days/yr
- Hot days in 30 yrs
- 15 days/yr
Wind risk 1/10 · Minimal
- Chance of severe wind over 30 yrs
- —
Air-quality risk 10/10 · Severe
- Unhealthy air days now
- 28 days/yr
- Unhealthy air days in 30 yrs
- 32 days/yr
Risk factors via First Street. Map © Google.
Why this score? — see what drove the B+ grade
The composite is a weighted blend of 9 inputs, each scored 0–100. Each bar is that input's sub-score; the figure is the points it added to the 100-point composite (weight × sub-score).
- Cash flow +30.0/30.0
- ARV discount +15.0/15.0
- 1% rule +10.0/10.0
- DSCR +10.0/10.0
- Livability +3.2/5.0
- Rent growth +3.1/5.0
- Schools +2.6/10.0
- Condition / age +2.5/5.0
- Appreciation +0.0/10.0
$77,000
🖨 Deal sheet 📄 Offer letter ✓ Due diligence
Listing remarks
Welcome to the desirable Friendly Village of Modesto- 55+ active community park offering a peaceful, park like setting with incredible amenities and active lifestyle! Weekly social events, heated pool and spa, fitness center, clubhouse, movie nights, monthly dinners, mini putting green. Pet friendly (most animals welcome) Make this well maintained mobile home yours. Features spacious primary suite with add 104sq pop out. Covered patio- perfect for relaxing out doors, open back yard ready for gardening or lawn space. Large 8ft X 19ft work shop shed with electricity. Enjoy quiet living with room to garden, relax or socialize. Don't miss this opportunity to own in one of Modesto's most welc
Key facts
- Open back yard
- Fitness center
- Clubhouse
Tags
Property features AI
Finance
- Financial info: Land lease: No (listed land lease amount noted but property is not land-lease)
- HOA & community: No association; Senior community
Exterior
- Parking: Attached covered parking; Guest parking available
- Utilities: Public water; Public sewer; Cable connected; Internet available; Gas plumbed with individual gas meter; 220 volts in kitchen and laundry
- Home design: Manufactured in park (double wide); Original condition; Built in 1971
- Construction: Metal roof; Lakewood make; Skirt: Other
- Exterior features: Storage; Workshop; Shed(s); Close to clubhouse
Interior
- Kitchen: Island; Built-in electric oven; Electric cooktop; Hood over range; Microwave; Dishwasher; Plumbed for ice maker
- Bedrooms: 2 bedrooms
- Flooring: Carpet; Tile
- Bathrooms: 2 full bathrooms; Tub with shower over; Shower stall(s)
- Heating & cooling: Central heating; Central air conditioning; Ceiling fan(s)
- Interior features: Accessible approach with ramp; Carpeted covered patio; Dual-pane full windows; Storage area
- Laundry & utility: Stacked washer/dryer included (in kitchen)
Neighborhood map
What this means for you Summary
Snapshot
- This is a 2-bed/2.0-bath manufactured listed at $77k.
Deal economics
- At list price, monthly cash flow is $1k ($12k/yr) — positive.
- The deal already cash-flows at list — no discount required.
- Meets the 1% rule at list price ($2k rent vs $77k).
- Recommended offer: $75k (3.0% below list) — sets the bar for market timing.
- Cap rate 22.1% vs local median 3.2% in Modesto — top-decile yield for the area; either an underpriced asset or a hidden risk that comps aren't pricing in. Stress-test before assuming the spread holds.
Location & tenants
- Location reads 63/100 on livability (#451 in CA) — a middle-class / working-renter tenant base. Strengths: housing A+; Watch: amenities C-, schools D+, health & safety D+.
- Stanislaus Union Elementary (urban): math 24% / reading 35% proficiency, ranked #344 of 517 in CA (top 66%) — low school quality limits family demand, transient renter base, plan for 1-2y turnover.
- Market conditions: Rents rising (+2.2%/yr); 161 active listings in the ZIP; 29 comparable units currently listed for rent nearby; rentals leasing fast (median 14d on market — plan ~1-2 weeks tenant-placement turnaround); solid renter incomes; 923 units permitted in Stanislaus County in 2024 (63 in 5+ unit buildings).
- This rent runs 31% of the median local income ($76k/yr) — at the standard rent-burdened threshold; future hikes will face affordability resistance.
Forward outlook
- Local home prices are declining (-3.0%/yr); year-one equity from $532 of loan paydown is wiped out by about $2k of value loss. Plan a longer hold.
- Stanislaus County population projected at +14% by 2050 — modest demand growth; plan on rents tracking national, not racing it.
- At projected returns (-3.0% appreciation + 2.2% rent growth), your $22k cash investment doubles in ~3 years — after that, you're playing with house money.
Negotiation context
- It's been on market 45 days — a 3% lower offer ($75k) is reasonable based on typical stale-listing flexibility.
Risks & watch-outs
- Climate carrying-cost: moderate wildfire risk; extreme-heat days projected 7→15/yr by 2055 (HVAC capex compounding) — expect insurance premiums to compound above CPI over the hold.
Questions for the listing agent
- It's been on market 45 days. Have you received any prior offers? Is the seller open to a 3% concession, seller financing, or rate buy-down credit?
- Built in 1971 — when were the roof, HVAC, electrical panel, plumbing, and water heater last replaced?
- Is there a deadline driving the sale (1031 exchange, divorce, estate, relocation)? That informs how much negotiation room exists.
- Schools are D-rated, which usually means shorter tenancies and higher turnover. Who's the typical renter profile here, and what's been the actual vacancy rate?
- Crime grade is F in this area — have there been break-ins, vandalism, or insurance claims at this property in the last 3 years? What carrier currently insures it and at what premium?
- What's the average days-on-market for RENTAL listings here right now (not sales)? A rising rental-DOM trend means longer vacancies and softer asking-rent achievability than the comps imply.
- What's the recent tenant-quality profile in this submarket — average credit score on applications, eviction rate, late-payment / NSF rate, and stable-employment percentage? A property-management company in the area should have these aggregated.
- How much new for-sale + rental construction is in the pipeline within 1–3 miles? Heavy new supply typically softens prices + rents 12–24 months out; constrained supply supports both.
Investment metrics
- 1% rule
- 2.54% ✓
- Cap rate
- 22.12%
- Cash-on-cash
- 56.53%
- DSCR
- 3.52
- GRM
- 3.3
CMA / ARV
- ARV (on-the-fly)
- $102,432
- Comps found
- 12
Show comp detail 12 sales within ~0.75 mi
| Address | Dist | Beds/Ba | Sqft | Sold | Price | $/sf | Match |
|---|---|---|---|---|---|---|---|
| 2621 Prescott Rd #37 | 0.00mi | 2/2.0 | 1,164 (0%) | 1mo | $70,500 | $61 | 99 |
| 2621 Prescott Rd #29 | 0.00mi | 2/2.0 | 1,152 (-1%) | 8mo | $85,000 | $74 | 91 |
| 2621 Prescott Rd #163 | 0.07mi | 2/2.0 | 1,120 (-4%) | 10mo | $119,000 | $106 | 82 |
| 2621 Prescott Rd #115 | 0.00mi | 2/2.0 | 1,248 (+7%) | 10mo | $85,000 | $68 | 80 |
| 2621 Prescott Rd #187 | 0.00mi | 3/2.0 (+1) | 1,248 (+7%) | 7mo | $125,000 | $100 | 77 |
| 2621 Prescott Rd #132 | 0.07mi | 3/2.0 (+1) | 1,188 (+2%) | 16mo | $105,000 | $88 | 75 |
| 2621 Prescott Rd #186 | 0.07mi | 2/2.0 | 1,056 (-9%) | 10mo | $66,000 | $63 | 73 |
| 2621 Prescott Rd #205 | 0.00mi | 2/2.0 | 1,054 (-10%) | 14mo | $80,000 | $76 | 72 |
| 2621 Prescott Rd #188 | 0.05mi | 2/1.0 | 1,056 (-9%) | 7mo | $70,000 | $66 | 72 |
| 3201 Broadmore Ln | 0.36mi | 3/2.0 (+1) | 1,120 (-4%) | 20mo | $285,000 | $254 | 55 |
| 3024 Celebrity Ln | 0.24mi | 3/2.0 (+1) | 1,296 (+11%) | 16mo | $300,000 | $231 | 52 |
| 2137 Key West Ln | 0.40mi | 2/2.0 | 1,272 (+9%) | 20mo | $195,000 | $153 | 49 |
Match score weights: distance 35% · size 25% · config 20% · recency 20%. Top-matched comps best support the ARV.
Projected returns pro-forma
-3.0% appreciation · 2.25% rent growth · sell at horizon
- IRR
- 54.1%
- Equity multiple
- 3.35×
- Total profit
- $50,768
- Equity at exit
- $11,481
- IRR
- 58.9%
- Equity multiple
- 6.64×
- Total profit
- $121,687
- Equity at exit
- $6,658
Cash invested: $21,560 (down + closing). Projections, not guarantees.
Landlord ↔ Tenant lean methodology
- Overall (STATE)
- 18 Strongly Tenant-Friendly
- State California
- 18 Strongly Tenant-Friendly · D+13
- County
- — inherits STATE
- City
- — inherits STATE
ZIP-level market 95350
- Rents YoY
- 2.2%
- Active inventory
- 161
- Price-to-rent
- 3.3×
Monthly cashflow live
- Estimated rent
- $1,959 high interval (Pro) →
- Mortgage (P&I)
- −$404
- Tax est. 1.5%
- −$96 /mo · $1,155/yr
- Insurance
- −$32
- HOA
- −$0
- Vacancy / Maint / Mgmt
- −$411
- Net cashflow
- $1,016
Break-even live
UW: 25.0% down · 7.5% · 30yr · 1.5% tax · 5.0% vac · 8.0% maint · 8.0% mgmt
Financing live
Cash to close
- Down payment
- $19,250
- Closing costs
- $2,310
- Reserves months
- —
- Total cash needed
- —
Loan-product check · same deal, 3 products live
Conventional
25% down · 7.5% · 30yr
- Down + closing
- —
- Monthly P&I
- —
- Monthly cashflow
- —
- DSCR
- —
- Eligible?
- —
Personal DTI + credit; lowest rate.
DSCR
20% down · 8.5% · 30yr
- Down + closing
- —
- Monthly P&I
- —
- Monthly cashflow
- —
- DSCR
- —
- Eligible?
- —
No personal income docs; deal must DSCR.
Hard money
10% down · 12.0% · 12mo
- Down + closing
- —
- Monthly P&I
- —
- Monthly cashflow
- —
- DSCR
- —
- Eligible?
- —
Short-term bridge; refi at stabilization.
Rent comps 29 comps
| Address | Beds | Baths | Sqft | Rent | $/sqft | DOM | Units | Dist |
|---|---|---|---|---|---|---|---|---|
| 2120 Chrysler Dr Modesto, CA | 2.0 | 1.0 | 850 | $1,695 | $1.99 | 13d | 1 | 0.14mi |
| 2140 Palisade Ave #4 Modesto, CA | 2.0 | 1.0 | 924 | $1,850 | $2.00 | 13d | 1 | 0.21mi |
| 2112 Eicher Ave Modesto, CA | 2.0 | 1.0 | 1100 | $1,995 | $1.81 | 13d | 1 | 0.31mi |
| 1808 W Rumble Rd Modesto, CA | 2.0 | 2.0 | 1000 | $1,800 | $1.80 | 13d | 1 | 0.46mi |
| 2531 W Rumble Rd Unit 16 Modesto, CA | 2.0 | 2.0 | 891 | $1,795 | $2.01 | 13d | 1 | 0.50mi |
| 2531 W Rumble Rd Unit 13 Modesto, CA | 2.0 | 2.0 | 887 | $1,825 | $2.06 | 13d | 1 | 0.50mi |
| 1712 Applegate Dr Modesto, CA | 3.0 | 2.0 | 1120 | $2,595 | $2.32 | 13d | 1 | 0.53mi |
| 2600 W Rumble Rd Unit 20 Modesto, CA | 1.0 | 1.0 | 700 | $1,600 | $2.29 | 13d | 1 | 0.55mi |
| 2404 Strivens Ave Modesto, CA | 3.0 | 1.0 | 1200 | $2,498 | $2.08 | 13d | 1 | 0.64mi |
| 2821 Lou Ann Dr Modesto, CA | 2.0 | 1.5–2.0 | 1035 | $2,150 | $2.08 | 11d | 3 | 0.73mi |
| 1713 Randazzo Ave Unit 1713 Modesto, CA | 2.0 | 2.0 | 960 | $1,895 | $1.97 | 13d | 1 | 0.75mi |
| 3501 Shawnee Dr Modesto, CA | 1.0 | 1.0 | 859 | $1,550 | $1.80 | 21d | 1 | 0.75mi |
| 3500 Shawnee Dr Modesto, CA | 2.0 | 2.0 | 1100 | $2,100 | $1.91 | 13d | 1 | 0.76mi |
| 3601 Prescott Rd Modesto, CA | 1.0–2.0 | 1.0–2.0 | 798 | $2,075 | $2.60 | 11d | 1 | 0.78mi |
| 3200 Hahn Dr Modesto, CA | 2.0–3.0 | 2.0–2.5 | 1262 | $2,317 | $1.84 | 3d | 5 | 0.80mi |
| 1809 La Corunna Pl Modesto, CA | 2.0 | 3.0 | 1300 | $2,100 | $1.62 | 13d | 1 | 0.82mi |
| 2900 W Rumble Rd Modesto, CA | 2.0 | 2.0 | 936 | $1,795 | $1.92 | 10d | 1 | 0.84mi |
| 2020 Cheyenne Way Modesto, CA | 1.0–2.0 | 1.0–2.0 | 783 | $1,825 | $2.33 | 3d | 2 | 0.85mi |
| 2213 Camborne Dr Unit 1 Modesto, CA | 2.0 | 2.0 | 1220 | $2,395 | $1.96 | 23d | 1 | 0.85mi |
| 2800 Braden Ave Modesto, CA | 1.0–2.0 | 1.0–2.0 | 779 | $1,960 | $2.52 | 2d | 9 | 0.89mi |
| 1712 Carver Rd Modesto, CA | 1.0–2.0 | 1.0 | 704 | $1,825 | $2.59 | 13d | 4 | 0.96mi |
| 3600 Dale Rd Modesto, CA | 2.0 | 1.0 | 935 | $2,100 | $2.25 | 11d | 1 | 1.16mi |
| 3600 Dale Rd Unit 1 Modesto, CA | 2.0 | 1.5 | 935 | $2,100 | $2.25 | 3d | 1 | 1.16mi |
| 1701 Linwood Dr Modesto, CA | 3.0 | 2.0 | 1499 | $2,050 | $1.37 | 13d | 1 | 1.16mi |
| 3401 Tully Rd Modesto, CA | 2.0 | 2.0 | 1024 | $2,095 | $2.05 | 13d | 2 | 1.22mi |
| 3820 Gareth Ln Apt C Modesto, CA | 2.0 | 2.0 | 1100 | $1,895 | $1.72 | 13d | 1 | 1.36mi |
| 1506 W Orangeburg Ave Unit 1506 Modesto, CA | 2.0 | 1.0 | 780 | $1,600 | $2.05 | 13d | 1 | 1.41mi |
| 3445 Colonial Dr Modesto, CA | 1.0–2.0 | 1.0 | 918 | $2,295 | $2.50 | 13d | 10 | 1.41mi |
| 3905 Dale Rd Unit B Modesto, CA | 2.0 | 2.0 | 1020 | $1,750 | $1.72 | 3d | 1 | 1.48mi |
Climate risk First Street
- Flood 1/10 Low FEMA zone X (unshaded) · 0% chance over 30 yrs
- Wildfire 5/10 Major
- Heat 6/10 Major 7 d/yr ≥102°F today · 15 d/yr by 30 yrs out
- Wind 1/10 Low
- Air quality 10/10 Extreme 28 unhealthy d/yr today · 32 by 30 yrs out
Nearby sold comps map
Loading sold comps map…
Walkable amenities ~0.75 mi
Loading nearby amenities…
Taxation est. · year 1
- Rental income
- $23,510
- − Mortgage interest
- −$4,313
- − Property taxes
- −$1,155
- − Insurance
- −$385
- − Repairs & maintenance
- −$1,881
- − Management
- −$1,881
- − Depreciation
- −$2,240
- Taxable income
- $11,655
- Est. tax owed @ 24.0%
- −$2,797
- After-tax cash flow
- $9,390/yr
For passive investors: Depreciation is non-cash, so a rental often shows a tax loss while cash-flowing — sheltering income. Rental losses are passive: they offset passive income freely, and up to $25,000/yr can offset ordinary (W-2) income if you actively participate and your MAGI is under $100k (phasing out to $0 by $150k); unused losses carry forward. On sale, claimed depreciation is recaptured at up to 25%, and gains may owe capital-gains tax (a 1031 exchange can defer both). Figures are a year-1 estimate at your 24.0% rate — not tax advice; consult a CPA.
Schools (NCES district)
- District
- Stanislaus Union Elementary
- NCES district ID
- 0637950
- Math proficiency
- 24% ▼ -14.00%
- Reading proficiency
- 35% ▼ -12.00%
- Median HH income
- $53,731
- Composite
- 26.11/100
- National rank
- #7286
- State rank
- #344 of 517 in CA
Livability — Modesto
- Score
- 63/100
- State rank
- #451
- US rank
- #15229
Category grades
Schools grade is shown separately in the Schools card above.
Census & demographics
- Census place
- Modesto, CA
- County
- Stanislaus County · 445,786 people
- City population
- 225,261
- Metro
- Modesto, CA
- Population (ZIP)
- 57,136
- Household income
- $75,621
- Rent vs Own
- Severe rent burden
- 2163.0
Population outlook (Stanislaus County) Hauer SSP2
- Today (2025)
- 579,493 people
- By 2030
- 598,000 · +3.2%
- By 2040
- 630,930 · +8.9%
- By 2050
- 658,300 · +13.6%
- By 2075
- 712,363 · +22.9%
- By 2100
- 719,805 · +24.2%
Race, ethnicity, and origin ACS 2023
- Neighborhood character
- Diverse neighborhood (Simpson 0.64)
- Race & ethnicity
- White 45% Hispanic / Latino 39% Two or more races 19% Asian 6% Black 5% Native American 2%
- Hispanic origin (detail)
- Mexican 35%
- Common ancestry
- Russian 3% Slovak 2% Portuguese 1%
- Foreign-born
- 14% · Canada, Vietnam
- Languages at home
- 70% English-only · Spanish 23% Other Indo-European 3% Other Asian/Pacific 1%
Political lean MEDSL · Stanislaus
- 2024 margin
- R (+11.0) · D 43.2% · R 54.2% · Other 2.6%
- 2008→2024 swing
- -12.7pp toward R · 2008: 1.7pp · 2024: -11.0pp
- All cycles
- 2024: R+11.0 2020: D+0.8 2016: D+0.6 2012: D+0.7 2008: D+1.7
Not yet ingested
- Civics
- —
Market trends
- HPI YoY
- ▼ -555.05%
- Current HPI
- 307.9532
- Rent YoY
- ▲ 2.25%
- Metro
- Modesto, CA
- State GDP YoY
- ▲ 3.21%
- F500 in state
- 116
Industry mix (Fortune 500 HQ in CA)
| Industry | F500 HQs | Revenue |
|---|---|---|
| Technology | 27 | $1,492B |
|
||
| Financial Services | 3 | $174B |
|
||
| Retail | 3 | $44B |
|
||
| Insurance | 3 | $26B |
|
||
| Media / Entertainment | 2 | $115B |
|
||
| Pharmaceuticals / Biotech | 2 | $62B |
|
||
Cash-flow waterfall
monthlySold comps — $/sqft
last 12 mo · ≤1 miLoading sold comps…