 15-Plex
119 K St · Salt Lake City, UT
Flood risk 1/10 · Minimal
- FEMA flood zone
- X (unshaded)
- Chance of flooding over 30 yrs
- 0.0%
- Est. flood insurance / yr
- $507 – $1,088
Fire risk 6/10 · Moderate
- Est. fire insurance / yr
- $453 – $841
Heat risk 4/10 · Minor
- Hot days now (above 94°F)
- 7 days/yr
- Hot days in 30 yrs
- 19 days/yr
Wind risk 1/10 · Minimal
- Chance of severe wind over 30 yrs
- —
Air-quality risk 4/10 · Minor
- Unhealthy air days now
- 5 days/yr
- Unhealthy air days in 30 yrs
- 7 days/yr
Risk factors via First Street. Map © Google.
Why this score? — see what drove the B- grade
The composite is a weighted blend of 9 inputs, each scored 0–100. Each bar is that input's sub-score; the figure is the points it added to the 100-point composite (weight × sub-score).
- Cash flow +30.0/30.0
- 1% rule +10.0/10.0
- DSCR +10.0/10.0
- ARV discount +7.5/15.0
- Livability +3.8/5.0
- Rent growth +2.9/5.0
- Schools +2.9/10.0
- Condition / age +2.5/5.0
- Appreciation +0.0/10.0
$1,800,000
🖨 Deal sheet 📄 Offer letter ✓ Due diligence
Multi-family units
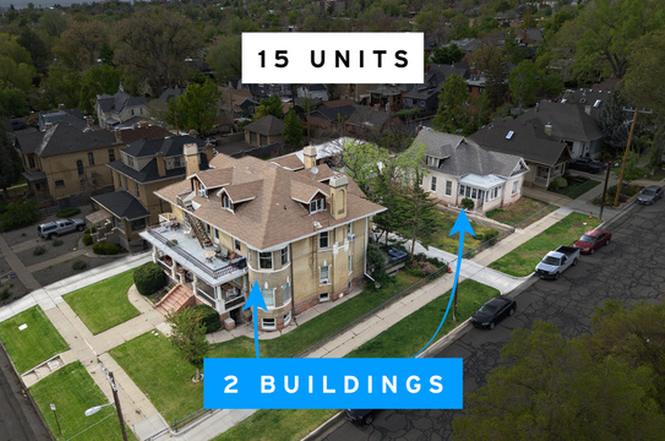
County records classify this as Multi-Family (5+ Unit). Listing-text estimate: 15 units. confirmed
5+ unit building — per-unit beds/baths from public records are typically unavailable; the breakdown below (if shown) is an estimate from the listing text.
Listing remarks
Rare 15-unit acquisition opportunity in the highly sought-after Salt Lake City Avenues (687 E 2nd Ave & 119 N K St). This historic 1905 trophy asset offers massive, immediate upside. Three units are scheduled for vacancy in March 2026, allowing the new owner to capture top-of-market rents on Day 1 and force instant equity. Current average rents are significantly below market (Studios averaging $560/mo; 1-Bedrooms averaging $882/mo), providing a clear and proven path to aggressive revenue growth. -------------- The heavy lifting has already been completed with over $62,000 in recent CapEx, including a $32,000 driveway replacement, a $22,000 electrical upgrade, and an $8,000 new porch.
Key facts
- Force instant equity
- Vacancy in march
- Top of market rents
Tags
Property features AI
Finance
- Other: Two structures on the property; 119 K St is the northernmost building
- Financial info: Annual tax amount reported (see listing for details)
Exterior
- Parking: Covered parking; Carport available; Eight total covered/carport parking spaces
- Utilities: Natural gas connected; Electricity connected; Water connected; Sewer connected
- Home design: Multi-family property; Built/Standing condition
- Construction: Built in 1980; Asphalt roof; SR-1A zoning (Multi-Family)
- Exterior features: Paved road access; Sidewalks; Gradual sloping terrain; Mountain and valley views; Property faces south
Interior
- Bedrooms: Eleven 1-bedroom units; Four studio/efficiency units (baths listed but no beds specified)
- Bathrooms: One bathroom in each unit (where specified)
- Interior features: Residential multi-family use; Total of 15 units on the property
Neighborhood map
What this means for you Summary
Snapshot
- This is a 15 × 10-bed/15.0-bath units multifamily listed at $1.80M.
Deal economics
- At list price, monthly cash flow is $12k ($143k/yr) — positive. Per door: $796/mo.
- The deal already cash-flows at list — no discount required.
- Meets the 1% rule at list price ($29k rent vs $1.80M).
- Recommended offer: $1.64M (9.0% below list) — sets the bar for market timing.
Location & tenants
- Location reads 75/100 on livability (#64 in UT, #3,994 nationally) — a middle-class / working-renter tenant base. Strengths: amenities A+, commute A+, housing A; Watch: cost of living D+, crime F.
- Salt Lake District (urban): math 30% / reading 37% proficiency, ranked #65 of 80 in UT (top 81%) — families likely to look elsewhere, expect single-tenant / working-renter base with shorter leases.
- Zoned schools: Wasatch School (math 53% / reading 56%, grade C, #106 of 585 statewide, top 19%, 337 students, 31% FRL); Salt Lake Center For Science Education Bryant (math 14% / reading 29%, grade F, #125 of 138 statewide, top 91%, 407 students, 64% FRL); West High (math 33% / reading 60%, grade D-, #38 of 171 statewide, top 24%, 2,600 students, 51% FRL).
- Market conditions: Rents rising (+1.6%/yr); 205 active listings in the ZIP; solid renter incomes; 4,970 units permitted in Salt Lake County in 2024 (1,963 in 5+ unit buildings).
- At $29,012/mo this rent would consume 415% of the median local household income ($84k/yr) (locally 1273% of renters already pay >50% of income on rent) — very limited rent-growth headroom before tenants either downsize or default.
Forward outlook
- Local home prices are declining (-3.0%/yr); year-one equity from $12k of loan paydown is wiped out by about $54k of value loss. Plan a longer hold.
- Salt Lake County population projected at +37% by 2050 — long-run rental-demand tailwind backs the buy-and-hold thesis.
- At projected returns (-3.0% appreciation + 1.6% rent growth), your $504k cash investment doubles in ~5 years — after that, you're playing with house money.
Negotiation context
- It's been on market 104 days — a 9% lower offer ($1.64M) is reasonable based on typical stale-listing flexibility.
Risks & watch-outs
- Watch-outs: built in 1905 — expect roof / HVAC / electrical / plumbing capex.
- Climate carrying-cost: major wildfire risk — expect insurance premiums to compound above CPI over the hold.
Questions for the listing agent
- It's been on market 104 days. Have you received any prior offers? Is the seller open to a 9% concession, seller financing, or rate buy-down credit?
- Can we see the unit-by-unit rent roll, current vacancy, and any below-market leases? What's the average tenancy length?
- What capital expenditures (roof, boiler, parking lot, exteriors) have been made in the last 5 years, and what's planned in the next 2?
- Built in 1905 — when were the roof, HVAC, electrical panel, plumbing, and water heater last replaced?
- Why hasn't it sold? Are there any deal-killer items the seller is aware of (foundation, flood, title, zoning, code violations)?
- Is there a deadline driving the sale (1031 exchange, divorce, estate, relocation)? That informs how much negotiation room exists.
- Crime grade is F in this area — have there been break-ins, vandalism, or insurance claims at this property in the last 3 years? What carrier currently insures it and at what premium?
- What's the average days-on-market for RENTAL listings here right now (not sales)? A rising rental-DOM trend means longer vacancies and softer asking-rent achievability than the comps imply.
- What's the recent tenant-quality profile in this submarket — average credit score on applications, eviction rate, late-payment / NSF rate, and stable-employment percentage? A property-management company in the area should have these aggregated.
- How much new apartment / multifamily construction is in the pipeline within 1–3 miles? Heavy new supply (>2% of stock underway) typically softens rents 12–24 months out; light construction supports rent growth.
Investment metrics
- 1% rule
- 1.61% ✓
- Cap rate
- 14.26%
- Cash-on-cash
- 28.44%
- DSCR
- 2.27
- GRM
- 5.2
CMA / ARV
No comps found within radius.
Projected returns pro-forma
-3.0% appreciation · 1.57% rent growth · sell at horizon
- IRR
- 21.1%
- Equity multiple
- 1.85×
- Total profit
- $427,546
- Equity at exit
- $268,386
- IRR
- 28.4%
- Equity multiple
- 3.35×
- Total profit
- $1,186,027
- Equity at exit
- $155,631
Cash invested: $504,000 (down + closing). Projections, not guarantees.
Landlord ↔ Tenant lean methodology
- Overall (STATE)
- 86 Strongly Landlord-Friendly
- State Utah
- 86 Strongly Landlord-Friendly · R+15
- County
- — inherits STATE
- City
- — inherits STATE
ZIP-level market 84103
- Rents YoY
- 1.6%
- Active inventory
- 205
- Price-to-rent
- 77.6×
Monthly cashflow live
- Estimated rent
- $29,012 medium interval (Pro) →
- Mortgage (P&I)
- −$9,439
- Tax from tax record
- −$784 /mo · $9,409/yr
- Insurance
- −$750
- HOA
- −$0
- Vacancy / Maint / Mgmt
- −$6,093
- Net cashflow
- $11,946
Break-even live
15-unit breakdown (identical units grouped — click to expand)
| Units | Beds | Baths | Est. rent |
|---|---|---|---|
| 15× units | 10 | 15 | $29,010 |
| #1 | 10 | 15 | $1,934 |
| #2 | 10 | 15 | $1,934 |
| #3 | 10 | 15 | $1,934 |
| #4 | 10 | 15 | $1,934 |
| #5 | 10 | 15 | $1,934 |
| #6 | 10 | 15 | $1,934 |
| #7 | 10 | 15 | $1,934 |
| #8 | 10 | 15 | $1,934 |
| #9 | 10 | 15 | $1,934 |
| #10 | 10 | 15 | $1,934 |
| #11 | 10 | 15 | $1,934 |
| #12 | 10 | 15 | $1,934 |
| #13 | 10 | 15 | $1,934 |
| #14 | 10 | 15 | $1,934 |
| #15 | 10 | 15 | $1,934 |
| Total (15 units) | $29,012 | ||
UW: 25.0% down · 7.5% · 30yr · 1.5% tax · 5.0% vac · 8.0% maint · 8.0% mgmt
Financing live
Cash to close
- Down payment
- $450,000
- Closing costs
- $54,000
- Reserves months
- —
- Total cash needed
- —
Loan-product check · same deal, 3 products live
Conventional
25% down · 7.5% · 30yr
- Down + closing
- —
- Monthly P&I
- —
- Monthly cashflow
- —
- DSCR
- —
- Eligible?
- —
Personal DTI + credit; lowest rate.
DSCR
20% down · 8.5% · 30yr
- Down + closing
- —
- Monthly P&I
- —
- Monthly cashflow
- —
- DSCR
- —
- Eligible?
- —
No personal income docs; deal must DSCR.
Hard money
10% down · 12.0% · 12mo
- Down + closing
- —
- Monthly P&I
- —
- Monthly cashflow
- —
- DSCR
- —
- Eligible?
- —
Short-term bridge; refi at stabilization.
Listing history 17 events
-
2026-06-19price $1,800,000 Active 104 DOM
-
2026-06-18days on market $1,930,000 Active 104 DOM
-
2026-06-17days on market $1,930,000 Active 103 DOM
-
2026-06-16days on market $1,930,000 Active 102 DOM
-
2026-06-15days on market $1,930,000 Active 101 DOM
-
2026-06-13days on market $1,930,000 Active 99 DOM
-
2026-06-13pricedays on market $1,930,000 Active 98 DOM
-
2026-06-09days on market $1,940,000 Active 95 DOM
-
2026-06-08days on market $1,940,000 Active 94 DOM
-
2026-06-07days on market $1,940,000 Active 93 DOM
-
2026-06-05days on market $1,940,000 Active 90 DOM
-
2026-06-03days on market $1,940,000 Active 89 DOM
-
2026-06-02days on market $1,940,000 Active 88 DOM
-
2026-06-01days on market $1,940,000 Active 87 DOM
-
2026-05-31days on market $1,940,000 Active 86 DOM
-
2026-04-16price $1,950,000
-
2026-03-07$2,100,000 Active
ⓘ Source: listings_history table (triggers on properties + properties_extension) + one-shot
backfill from property_details.listing_events for pre-trigger history.
Tax reassessment forecast UT · Resets to sale price
- Current annual tax
- $9,409 · $784/mo
- Projected year-2 tax
- $11,880 · $990/mo
- Expected delta
- +$2,471/yr (+$206/mo · 26.3%)
ⓘ Screening estimate from a state-policy table — verify with the county assessor before closing.
Climate risk First Street
- Flood 1/10 Low FEMA zone X (unshaded) · 0% chance over 30 yrs
- Wildfire 6/10 Major
- Heat 4/10 Moderate 7 d/yr ≥94°F today · 19 d/yr by 30 yrs out
- Wind 1/10 Low
- Air quality 4/10 Moderate 5 unhealthy d/yr today · 7 by 30 yrs out
Nearby sold comps map
Loading sold comps map…
Walkable amenities ~0.75 mi
Loading nearby amenities…
Taxation est. · year 1
- Rental income
- $348,144
- − Mortgage interest
- −$100,828
- − Property taxes
- −$9,409
- − Insurance
- −$9,000
- − Repairs & maintenance
- −$27,852
- − Management
- −$27,852
- − Depreciation
- −$52,364
- Taxable income
- $120,840
- Est. tax owed @ 24.0%
- −$29,002
- After-tax cash flow
- $114,350/yr
For passive investors: Depreciation is non-cash, so a rental often shows a tax loss while cash-flowing — sheltering income. Rental losses are passive: they offset passive income freely, and up to $25,000/yr can offset ordinary (W-2) income if you actively participate and your MAGI is under $100k (phasing out to $0 by $150k); unused losses carry forward. On sale, claimed depreciation is recaptured at up to 25%, and gains may owe capital-gains tax (a 1031 exchange can defer both). Figures are a year-1 estimate at your 24.0% rate — not tax advice; consult a CPA.
Schools (NCES district)
- District
- Salt Lake District
- NCES district ID
- 4900870
- Math proficiency
- 30% ▼ -13.00%
- Reading proficiency
- 37% ▼ -6.00%
- Median HH income
- $47,550
- Composite
- 28.85/100
- National rank
- #6645
- State rank
- #65 of 80 in UT
Livability — Salt Lake City
- Score
- 75/100
- State rank
- #64
- US rank
- #3994
Category grades
Schools grade is shown separately in the Schools card above.
Census & demographics
- Census place
- Salt Lake City, UT
- County
- Salt Lake County · 1,195,750 people
- City population
- 172,615
- Metro
- Salt Lake City, UT
- Population (ZIP)
- 23,749
- Household income
- $83,916
- Rent vs Own
- Severe rent burden
- 1273.0
Population outlook (Salt Lake County) Hauer SSP2
- Today (2025)
- 1,305,860 people
- By 2030
- 1,402,611 · +7.4%
- By 2040
- 1,594,533 · +22.1%
- By 2050
- 1,787,244 · +36.9%
- By 2075
- 2,224,138 · +70.3%
- By 2100
- 2,551,390 · +95.4%
Race, ethnicity, and origin ACS 2023
- Neighborhood character
- Predominantly White (79%)
- Race & ethnicity
- White 79% Hispanic / Latino 10% Two or more races 9% Asian 3% Black 2%
- Hispanic origin (detail)
- Mexican 5%
- Common ancestry
- Slovak 5% Italian 3% Portuguese 3%
- Foreign-born
- 11% · Canada, China, Jamaica
- Languages at home
- 88% English-only · Spanish 5% Other Indo-European 3% Other Asian/Pacific 1%
Political lean MEDSL · Salt Lake
- 2024 margin
- D (+10.2) · D 53.7% · R 43.5% · Other 2.8%
- 2008→2024 swing
- +10.1pp toward D · 2008: 0.1pp · 2024: 10.2pp
- All cycles
- 2024: D+10.2 2020: D+11.0 2016: D+10.2 2012: R+19.3 2008: D+0.1
Not yet ingested
- Civics
- —
Market trends
- HPI YoY
- ▼ -623.62%
- Current HPI
- 276.3149
- Rent YoY
- ▲ 1.57%
- Metro
- Salt Lake City, UT
- State GDP YoY
- ▲ 3.54%
- F500 in state
- 2
Industry mix (Fortune 500 HQ in UT)
| Industry | F500 HQs | Revenue |
|---|---|---|
| Financial Services | 1 | $3B |
|
||
Price history
-7.1% since first listed2 events — show timeline
- 2026-04-16 Price Changed $1,950,000 WFRMLS
- 2026-03-07 Listed $2,100,000 WFRMLS
Property tax history
+1.9%/yrLatest (2025): $9,409 · +8.3% YoY. Source: county tax records.
Cash-flow waterfall
monthlySold comps — $/sqft
last 12 mo · ≤1 miLoading sold comps…