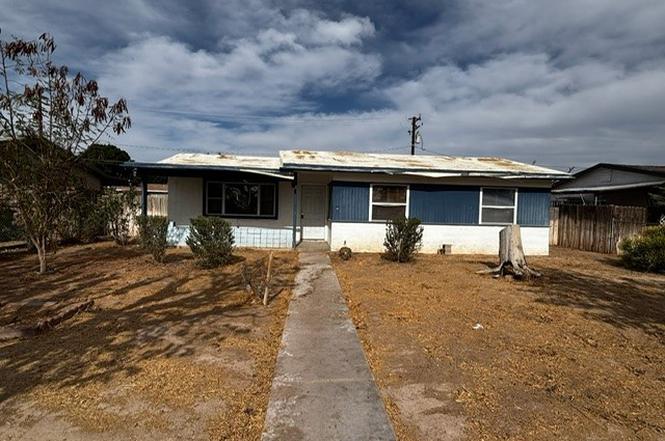
330 S 3rd · Blythe, CA
Flood risk 1/10 · Minimal
- FEMA flood zone
- D
- Chance of flooding over 30 yrs
- 0.0%
- Est. flood insurance / yr
- $544 – $1,084
Fire risk 1/10 · Minimal
- Est. fire insurance / yr
- $659 – $1,223
Heat risk 9/10 · Severe
- Hot days now (above 116°F)
- 7 days/yr
- Hot days in 30 yrs
- 18 days/yr
Wind risk 1/10 · Minimal
- Chance of severe wind over 30 yrs
- —
Air-quality risk 2/10 · Minimal
- Unhealthy air days now
- 1 days/yr
- Unhealthy air days in 30 yrs
- 1 days/yr
Risk factors via First Street. Map © Google.
Why this score? — see what drove the B grade
The composite is a weighted blend of 9 inputs, each scored 0–100. Each bar is that input's sub-score; the figure is the points it added to the 100-point composite (weight × sub-score).
- Cash flow +30.0/30.0
- ARV discount +15.0/15.0
- DSCR +10.0/10.0
- 1% rule +8.6/10.0
- Livability +3.7/5.0
- Schools +2.6/10.0
- Rent growth +2.5/5.0
- Condition / age +2.5/5.0
- Appreciation +0.0/10.0
$95,000
🖨 Deal sheet 📄 Offer letter ✓ Due diligence
Listing remarks MLS
Cute and Quant 3 bedroom 2 bathroom nestled in the heart of Blythe. This home includes a 2 car garage, with washer and drywer in garage as well as a whole house water filtration system. The house sits on a very spacious parcel, with plenty of trees for shade and privacy.
Key facts
- Alley access
- Large back yard
- Close to amenities
Tags
Property features AI
Finance
- Other: Property has no ADU; Single-unit property with no common walls
- HOA & community: Curbs, street lighting, and sidewalks in the neighborhood
Exterior
- Parking: Rear-entry garage; 2 garage spaces and 2 uncovered spaces (4 total parking spaces)
- Utilities: Electricity on property; Public/district water; Public sewer
- Home design: Single-story house; Concrete slab foundation; Front entry; One-level living
- Construction: Frame and stucco construction with drywall interior walls; Composition roof; Built year source: Assessor
- Exterior features: Covered porch and patio; Lot is level/flat with front and back yards; Chain link and wood fencing; No pool; Has a view
Interior
- Kitchen: Eating area; Water heater unit (appliance listed)
- Bedrooms: 3 main-level bedrooms; Primary bedroom
- Flooring: Carpet; Laminate; Concrete
- Bathrooms: Two 3/4 baths with walk-in shower
- Heating & cooling: Central furnace heating; Central air conditioning
- Interior features: Ceiling fan; Front entry
- Laundry & utility: Laundry in garage
Neighborhood map
What this means for you Summary
Snapshot
- This is a 3-bed/2.0-bath single-family listed at $95k.
Deal economics
- At list price, monthly cash flow is $356 ($4k/yr) — positive.
- The deal already cash-flows at list — no discount required.
- Meets the 1% rule at list price ($1k rent vs $95k).
- Cap rate 10.8% vs local median 4.6% in Blythe — top-decile yield for the area; either an underpriced asset or a hidden risk that comps aren't pricing in. Stress-test before assuming the spread holds.
Location & tenants
- Location reads 74/100 on livability (#143 in CA, #4,910 nationally) — a middle-class / working-renter tenant base. Strengths: commute A+, housing A+, health & safety A+; Watch: employment D, schools F, amenities F.
- Palo Verde Unified (town): math 20% / reading 34% proficiency, ranked #1,133 of 1,400 in CA (top 81%) — low school quality limits family demand, transient renter base, plan for 1-2y turnover; 64% free/reduced lunch — lower-income household profile, screen leases tightly.
- Market conditions: 189 active listings in the ZIP; 8 comparable units currently listed for rent nearby; rentals leasing fast (median 13d on market — plan ~1-2 weeks tenant-placement turnaround); 9,195 units permitted in Riverside County in 2024 (1,512 in 5+ unit buildings).
Forward outlook
- Local home prices are declining (-3.0%/yr); year-one equity from $657 of loan paydown is wiped out by about $3k of value loss. Plan a longer hold.
- Riverside County population projected at +22% by 2050 — long-run rental-demand tailwind backs the buy-and-hold thesis.
- At projected returns (-3.0% appreciation + 3.0% rent growth), your $27k cash investment doubles in ~8 years — after that, you're playing with house money.
Negotiation context
- Only 1 days on market — expect competitive offers; lowballing is unlikely to land.
- 2 sale attempts since 5y ago with the ask held roughly flat each time — persistent listings suggest the price (not the market) is what's stuck; bring a comps-based counter.
Risks & watch-outs
- Climate carrying-cost: extreme-heat days projected 7→18/yr by 2055 (HVAC capex compounding) — expect insurance premiums to compound above CPI over the hold.
Questions for the listing agent
- Built in 1964 — when were the roof, HVAC, electrical panel, plumbing, and water heater last replaced?
- Is there a deadline driving the sale (1031 exchange, divorce, estate, relocation)? That informs how much negotiation room exists.
- Schools are F-rated, which usually means shorter tenancies and higher turnover. Who's the typical renter profile here, and what's been the actual vacancy rate?
- What's the average days-on-market for RENTAL listings here right now (not sales)? A rising rental-DOM trend means longer vacancies and softer asking-rent achievability than the comps imply.
- What's the recent tenant-quality profile in this submarket — average credit score on applications, eviction rate, late-payment / NSF rate, and stable-employment percentage? A property-management company in the area should have these aggregated.
- How much new for-sale + rental construction is in the pipeline within 1–3 miles? Heavy new supply typically softens prices + rents 12–24 months out; constrained supply supports both.
Investment metrics
- 1% rule
- 1.36% ✓
- Cap rate
- 10.80%
- Cash-on-cash
- 16.08%
- DSCR
- 1.72
- GRM
- 6.1
CMA / ARV
- ARV (on-the-fly)
- $180,540
- Comps found
- 12
Show comp detail 12 sales within ~0.75 mi
| Address | Dist | Beds/Ba | Sqft | Sold | Price | $/sf | Match |
|---|---|---|---|---|---|---|---|
| 321 Alice Ln | 0.07mi | 3/1.5 | 1,033 (-3%) | 10mo | $189,900 | $184 | 82 |
| 361 Alice Ln | 0.08mi | 3/1.5 | 1,006 (-5%) | 9mo | $91,000 | $90 | 78 |
| 490 S 1st St | 0.25mi | 3/1.0 | 1,125 (+6%) | 8mo | $165,000 | $147 | 68 |
| 310 S 1st | 0.16mi | 3/1.0 | 936 (-12%) | 2mo | $163,000 | $174 | 67 |
| 974 E Barnard St | 0.68mi | 3/2.0 | 1,084 (+2%) | 10mo | $190,000 | $175 | 56 |
| 951 E Ave. A | 0.54mi | 2/1.0 (-1) | 1,003 (-6%) | 1mo | $119,800 | $119 | 56 |
| 934 E Avenue B | 0.60mi | 3/1.0 | 1,142 (+8%) | 1mo | $120,000 | $105 | 55 |
| 201 3rd St N | 0.45mi | 3/2.5 | 1,200 (+13%) | 9mo | $205,000 | $171 | 48 |
| 343 S Spring St | 0.35mi | 2/2.0 (-1) | 908 (-14%) | 12mo | $55,000 | $61 | 45 |
| 722 E Wisconsin St | 0.74mi | 2/1.0 (-1) | 1,041 (-2%) | 16mo | $169,900 | $163 | 40 |
| 338 N 3rd St | 0.62mi | 3/2.0 | 1,220 (+15%) | 14mo | $240,000 | $197 | 34 |
| 350 N Sola Ave | 0.73mi | 3/1.0 | 1,176 (+11%) | 13mo | $200,000 | $170 | 33 |
Match score weights: distance 35% · size 25% · config 20% · recency 20%. Top-matched comps best support the ARV.
Projected returns pro-forma
-3.0% appreciation · 3.0% rent growth · sell at horizon
- IRR
- 7.1%
- Equity multiple
- 1.28×
- Total profit
- $7,333
- Equity at exit
- $14,165
- IRR
- 16.4%
- Equity multiple
- 2.34×
- Total profit
- $35,712
- Equity at exit
- $8,214
Cash invested: $26,600 (down + closing). Projections, not guarantees.
Landlord ↔ Tenant lean methodology
- Overall (STATE)
- 18 Strongly Tenant-Friendly
- State California
- 18 Strongly Tenant-Friendly · D+13
- County
- — inherits STATE
- City
- — inherits STATE
ZIP-level market 92225
- Home prices YoY
- -15.8%
- Active inventory
- 189
- Price-to-rent
- 6.1×
Monthly cashflow live
- Estimated rent
- $1,288 high interval (Pro) →
- Mortgage (P&I)
- −$498
- Tax from tax record
- −$123 /mo · $1,479/yr
- Insurance
- −$40
- HOA
- −$0
- Vacancy / Maint / Mgmt
- −$270
- Net cashflow
- $356
Break-even live
UW: 25.0% down · 7.5% · 30yr · 1.5% tax · 5.0% vac · 8.0% maint · 8.0% mgmt
Financing live
Cash to close
- Down payment
- $23,750
- Closing costs
- $2,850
- Reserves months
- —
- Total cash needed
- —
Loan-product check · same deal, 3 products live
Conventional
25% down · 7.5% · 30yr
- Down + closing
- —
- Monthly P&I
- —
- Monthly cashflow
- —
- DSCR
- —
- Eligible?
- —
Personal DTI + credit; lowest rate.
DSCR
20% down · 8.5% · 30yr
- Down + closing
- —
- Monthly P&I
- —
- Monthly cashflow
- —
- DSCR
- —
- Eligible?
- —
No personal income docs; deal must DSCR.
Hard money
10% down · 12.0% · 12mo
- Down + closing
- —
- Monthly P&I
- —
- Monthly cashflow
- —
- DSCR
- —
- Eligible?
- —
Short-term bridge; refi at stabilization.
Rent comps 8 comps
| Address | Beds | Baths | Sqft | Rent | $/sqft | DOM | Units | Dist |
|---|---|---|---|---|---|---|---|---|
| 238 E Rice St Blythe, CA | 2.0 | 1.0 | 800 | $1,100 | $1.38 | 43d | 1 | 0.22mi |
| 551 S 3rd St Blythe, CA | 2.0–3.0 | 1.0–2.0 | 885 | $1,120 | $1.27 | 13d | 9 | 0.25mi |
| 10340 E Vernon Ave Unit 1 Blythe, CA | 2.0 | 1.0 | 800 | $1,195 | $1.49 | 13d | 1 | 0.45mi |
| 10340 E Vernon Ave Blythe, CA | 2.0 | 1.0 | 800 | $1,195 | $1.49 | 43d | 1 | 0.45mi |
| 460 River Valley Ave Blythe, CA | 3.0 | 2.0 | 1344 | $2,600 | $1.93 | 13d | 1 | 0.65mi |
| 450 W Barnard St Blythe, CA | 2.0–3.0 | 1.0–2.0 | 935 | $1,095 | $1.17 | 13d | 2 | 0.76mi |
| 400 N Palm Dr Blythe, CA | 2.0–3.0 | 1.0–1.5 | 928 | $1,100 | $1.18 | 13d | 1 | 0.91mi |
| 381 San Luis Way Blythe, CA | 4.0 | 2.0 | 1316 | $1,800 | $1.37 | 43d | 1 | 1.29mi |
Listing history 2 events
-
2026-06-17remarks 370-char remark
-
2026-06-17$95,000 Active 1 DOM
ⓘ Source: listings_history table (triggers on properties + properties_extension) + one-shot
backfill from property_details.listing_events for pre-trigger history.
Tax reassessment forecast CA · Resets to sale price
- Current annual tax
- $1,479 · $123/mo
- Projected year-2 tax
- $1,479 · $123/mo
- Expected delta
- $0/yr ($0/mo · 0.0%)
ⓘ Screening estimate from a state-policy table — verify with the county assessor before closing.
Climate risk First Street
- Flood 1/10 Low FEMA zone D · 0% chance over 30 yrs
- Wildfire 1/10 Low
- Heat 9/10 Extreme 7 d/yr ≥116°F today · 18 d/yr by 30 yrs out
- Wind 1/10 Low
- Air quality 2/10 Low 1 unhealthy d/yr today · 1 by 30 yrs out
Nearby sold comps map
Loading sold comps map…
Walkable amenities ~0.75 mi
Loading nearby amenities…
Taxation est. · year 1
- Rental income
- $15,456
- − Mortgage interest
- −$5,321
- − Property taxes
- −$1,479
- − Insurance
- −$475
- − Repairs & maintenance
- −$1,236
- − Management
- −$1,236
- − Depreciation
- −$2,764
- Taxable income
- $2,944
- Est. tax owed @ 24.0%
- −$707
- After-tax cash flow
- $3,571/yr
For passive investors: Depreciation is non-cash, so a rental often shows a tax loss while cash-flowing — sheltering income. Rental losses are passive: they offset passive income freely, and up to $25,000/yr can offset ordinary (W-2) income if you actively participate and your MAGI is under $100k (phasing out to $0 by $150k); unused losses carry forward. On sale, claimed depreciation is recaptured at up to 25%, and gains may owe capital-gains tax (a 1031 exchange can defer both). Figures are a year-1 estimate at your 24.0% rate — not tax advice; consult a CPA.
Schools (NCES district)
- District
- Palo Verde Unified
- NCES district ID
- 0629640
- Math proficiency
- 20% ▲ 3.00%
- Reading proficiency
- 34% ▲ 5.00%
- Median HH income
- $40,808
- Composite
- 25.77/100
- National rank
- #12796
- State rank
- #1133 of 1400 in CA
Livability — Blythe
- Score
- 74/100
- State rank
- #143
- US rank
- #4910
Category grades
Schools grade is shown separately in the Schools card above.
Census & demographics
- Census place
- Blythe, CA
- Population (ZIP)
- 21,101
Population outlook (Riverside County) Hauer SSP2
- Today (2025)
- 2,664,475 people
- By 2030
- 2,802,692 · +5.2%
- By 2040
- 3,050,904 · +14.5%
- By 2050
- 3,256,783 · +22.2%
- By 2075
- 3,655,058 · +37.2%
- By 2100
- 3,766,594 · +41.4%
Race, ethnicity, and origin ACS 2023
- Neighborhood character
- Diverse neighborhood (Simpson 0.58)
- Race & ethnicity
- Hispanic / Latino 59% White 26% Two or more races 13% Black 10% Asian 2% Native American 2%
- Hispanic origin (detail)
- Mexican 54%
- Common ancestry
- Lithuanian 1% Romanian 1% Iranian 1%
- Foreign-born
- 18% · Canada
- Languages at home
- 55% English-only · Spanish 42% Other Indo-European 1% Tagalog/Filipino 0%
Political lean MEDSL · Riverside
- 2024 margin
- Toss-up / Even · D 48.0% · R 49.3% · Other 2.6%
- 2008→2024 swing
- -3.6pp toward R · 2008: 2.3pp · 2024: -1.3pp
- All cycles
- 2024: R+1.3 2020: D+8.0 2016: D+4.3 2012: R+0.4 2008: D+2.3
Not yet ingested
- Civics
- —
Market trends
- HPI YoY
- ▼ -40.53%
- Current HPI
- 215.4794
- Rent YoY
- —
- Metro
- —
- State GDP YoY
- ▲ 3.21%
- F500 in state
- 116
Industry mix (Fortune 500 HQ in CA)
| Industry | F500 HQs | Revenue |
|---|---|---|
| Technology | 27 | $1,492B |
|
||
| Financial Services | 3 | $174B |
|
||
| Retail | 3 | $44B |
|
||
| Insurance | 3 | $26B |
|
||
| Media / Entertainment | 2 | $115B |
|
||
| Pharmaceuticals / Biotech | 2 | $62B |
|
||
Price history
-26.9% since first listed6 events — show timeline
- 2026-06-17 Listed $95,000 CRMLS
- 2021-04-29 Sold (Public Records) $125,000 Public Records
- 2021-04-29 Sold (MLS) $125,000 GPSMLS
- 2021-03-18 Pending — GPSMLS
- 2021-02-25 Listed $130,000 GPSMLS
- 2021-02-23 Coming Soon $130,000 GPSMLS
Property tax history
+8.7%/yrLatest (2025): $1,479 · -0.9% YoY. Source: county tax records.
Cash-flow waterfall
monthlySold comps — $/sqft
last 12 mo · ≤1 miLoading sold comps…