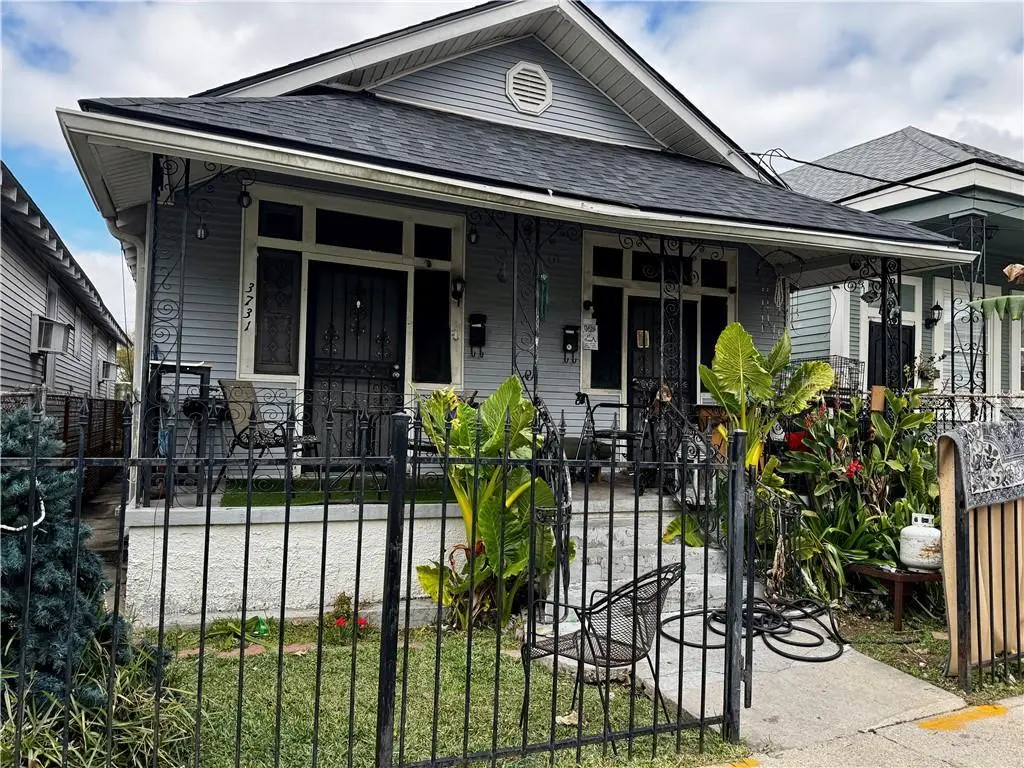
3729-31 Willow St · New Orleans, LA
Flood risk 8/10 · Major
- FEMA flood zone
- AE
- Chance of flooding over 30 yrs
- 0.77%
- Est. flood insurance / yr
- $1,737 – $8,500
Fire risk 1/10 · Minimal
- Est. fire insurance / yr
- $1,269 – $2,357
Heat risk 10/10 · Severe
- Hot days now (above 108°F)
- 7 days/yr
- Hot days in 30 yrs
- 21 days/yr
Wind risk 10/10 · Severe
- Chance of severe wind over 30 yrs
- 99.0%
Air-quality risk 3/10 · Minor
- Unhealthy air days now
- 3 days/yr
- Unhealthy air days in 30 yrs
- 4 days/yr
Risk factors via First Street. Map © Google.
Why this score? — see what drove the C- grade
The composite is a weighted blend of 9 inputs, each scored 0–100. Each bar is that input's sub-score; the figure is the points it added to the 100-point composite (weight × sub-score).
- Cash flow +18.3/30.0
- ARV discount +15.0/15.0
- DSCR +5.7/10.0
- 1% rule +4.9/10.0
- Livability +4.0/5.0
- Condition / age +2.5/5.0
- Rent growth +2.1/5.0
- Schools +1.6/10.0
- Appreciation +0.0/10.0
$275,000
🖨 Deal sheet (PDF) 📄 Offer letter ✓ Due diligence
Listing remarks MLS
Fabulous Uptown double located blocks from Ochsner Baptist, Trader Joes, Freret Street restaurants, and more! Enjoy relaxing on the fabulous front porch while living minutes from all of the fun and action that New Orleans has to offer or add a wonderful rental to your portfolio. This shotgun style double has 3 bedrooms/1 bath in one unit and 2 bedrooms/2 baths in the other. Brand new roof!
Key facts
- Uptown double
- Front porch
- New roof
Tags
Neighborhood map
What this means for you Summary
Snapshot
- This is a 9-bed/6.0-bath single-family listed at $275k.
Deal economics
- At list price, monthly cash flow is $-175 ($-2k/yr) — negative.
- To cash-flow at today's rent, offer at most $250k (9.2% below list).
- To meet the 1% rule (rent ≥ 1% of price), the offer needs to be $272k (0.9% below list).
- Recommended offer: $242k (12.0% below list) — sets the bar for market timing.
- Cap rate 7.4% vs local median 4.4% in New Orleans — top-decile yield for the area; either an underpriced asset or a hidden risk that comps aren't pricing in. Stress-test before assuming the spread holds.
Location & tenants
- Location reads 81/100 on livability (#3 in LA, #1,383 nationally) — a professional / high-income tenant draw. Strengths: amenities A+, commute A+, health & safety A+; Watch: crime C-, employment D.
- Orleans Parish (urban): math 11% / reading 27% proficiency, ranked #69 of 98 in LA (top 70%) — low school quality limits family demand, transient renter base, plan for 1-2y turnover; 68% free/reduced lunch — lower-income household profile, screen leases tightly.
- Zoned schools: Benjamin Franklin Elem. Math And Science (math 12% / reading 23%, grade F, #479 of 646 statewide, top 75%, 747 students, 98% FRL, charter) — zoned schools average 98% FRL vs 68% district-wide (30 pts higher); higher-poverty schools than district average — tighter screening recommended.
- Market conditions: Rents soft (-1.4%/yr); 280 active listings in the ZIP; solid renter incomes; 710 units permitted in Orleans Parish in 2024 (244 in 5+ unit buildings).
- This rent runs 36% of the median local income ($90k/yr) — at the standard rent-burdened threshold; future hikes will face affordability resistance.
Forward outlook
- Local home prices are declining (-3.0%/yr); year-one equity from $2k of loan paydown is wiped out by about $8k of value loss. Plan a longer hold.
- Orleans County population projected at +61% by 2050 — long-run rental-demand tailwind backs the buy-and-hold thesis.
Negotiation context
- It's been on market 149 days — a 12% lower offer ($242k) is reasonable based on typical stale-listing flexibility.
- 2 sale attempts since 13y ago with the ask held roughly flat each time — persistent listings suggest the price (not the market) is what's stuck; bring a comps-based counter.
Risks & watch-outs
- Watch-outs: flood insurance adds $427/mo.
- Climate carrying-cost: in FEMA flood zone AE (mandatory federal flood insurance); severe wind risk, 99% chance of damaging wind over 30y; extreme-heat days projected 7→21/yr by 2055 (HVAC capex compounding) — expect insurance premiums to compound above CPI over the hold.
Questions for the listing agent
- What do current leases actually rent for vs. the listed asking? Can we see a recent rent roll and the last 12 months of T-12 income?
- It's been on market 149 days. Have you received any prior offers? Is the seller open to a 12% concession, seller financing, or rate buy-down credit?
- What's the actual annual flood-insurance premium (NFIP or private), and is the property in a SFHA with mandatory coverage?
- Why hasn't it sold? Are there any deal-killer items the seller is aware of (foundation, flood, title, zoning, code violations)?
- Is there a deadline driving the sale (1031 exchange, divorce, estate, relocation)? That informs how much negotiation room exists.
- What's the average days-on-market for RENTAL listings here right now (not sales)? A rising rental-DOM trend means longer vacancies and softer asking-rent achievability than the comps imply.
- What's the recent tenant-quality profile in this submarket — average credit score on applications, eviction rate, late-payment / NSF rate, and stable-employment percentage? A property-management company in the area should have these aggregated.
- How much new for-sale + rental construction is in the pipeline within 1–3 miles? Heavy new supply typically softens prices + rents 12–24 months out; constrained supply supports both.
Investment metrics
- 1% rule
- 0.99% ✗
- Cap rate
- 7.39%
- Cash-on-cash
- 3.93%
- DSCR
- 1.17
- GRM
- 8.4
CMA / ARV
- ARV (median comp)
- $371,346
- List price
- $275,000
- Delta
- -25.95%
- Verdict
- UNDERPRICED
- Comps
- 20 within 1.0 mi
Projected returns pro-forma
-3.0% appreciation · 0.0% rent growth · sell at horizon
- IRR
- -25.0%
- Equity multiple
- 0.18×
- Total profit
- $-63,361
- Equity at exit
- $41,003
- IRR
- -38.4%
- Equity multiple
- -0.29×
- Total profit
- $-99,116
- Equity at exit
- $23,777
Cash invested: $77,000 (down + closing). Projections, not guarantees.
Landlord ↔ Tenant lean methodology
- Overall (STATE)
- 90 Strongly Landlord-Friendly
- State Louisiana
- 90 Strongly Landlord-Friendly · R+12
- County
- — inherits STATE
- City
- — inherits STATE
ZIP-level market 70115
- Rents YoY
- -1.4%
- Active inventory
- 280
- Price-to-rent
- 8.4×
Monthly cashflow live
- Estimated rent
- $2,725 medium interval (Pro) →
- Mortgage (P&I)
- −$1,442
- Tax est. 1.5%
- −$344 /mo · $4,125/yr
- Insurance
- −$115
- Flood insurance flood zone
- −$427 /mo · $5,118/yr
- HOA
- −$0
- Vacancy / Maint / Mgmt
- −$572
- Net cashflow
- $-175
Break-even live
Sensitivity live
| Price | -10% $15 | -5% $-80 | +0% $-175 | +5% $-270 | +10% $-365 |
|---|---|---|---|---|---|
| Rent | -10% $-390 | -5% $-282 | +0% $-175 | +5% $-67 | +10% $41 |
| Rate | -1.0pp $-36 | -0.5pp $-105 | base $-175 | +0.5pp $-246 | +1.0pp $-318 |
UW: 25.0% down · 7.5% · 30yr · 1.5% tax · 5.0% vac · 8.0% maint · 8.0% mgmt
Financing live
Cash to close
- Down payment
- $68,750
- Closing costs
- $8,250
- Reserves months
- —
- Total cash needed
- —
Loan-product check · same deal, 3 products live
Conventional
25% down · 7.5% · 30yr
- Down + closing
- —
- Monthly P&I
- —
- Monthly cashflow
- —
- DSCR
- —
- Eligible?
- —
Personal DTI + credit; lowest rate.
DSCR
20% down · 8.5% · 30yr
- Down + closing
- —
- Monthly P&I
- —
- Monthly cashflow
- —
- DSCR
- —
- Eligible?
- —
No personal income docs; deal must DSCR.
Hard money
10% down · 12.0% · 12mo
- Down + closing
- —
- Monthly P&I
- —
- Monthly cashflow
- —
- DSCR
- —
- Eligible?
- —
Short-term bridge; refi at stabilization.
Listing history 17 events
-
2026-06-21days on market $275,000 Active 149 DOM
-
2026-06-18days on market $275,000 Active 146 DOM
-
2026-06-17days on market $275,000 Active 145 DOM
-
2026-06-16days on market $275,000 Active 144 DOM
-
2026-06-15days on market $275,000 Active 143 DOM
-
2026-06-13days on market $275,000 Active 141 DOM
-
2026-06-10days on market $275,000 Active 138 DOM
-
2026-06-09days on market $275,000 Active 137 DOM
-
2026-06-08days on market $275,000 Active 136 DOM
-
2026-06-07days on market $275,000 Active 135 DOM
-
2026-06-05days on market $275,000 Active 132 DOM
-
2026-06-03days on market $275,000 Active 131 DOM
-
2026-06-02days on market $275,000 Active 130 DOM
-
2026-06-01days on market $275,000 Active 129 DOM
-
2026-05-31days on market $275,000 Active 128 DOM
-
2026-01-23$275,000 Active 392-char remark
Show marketing remark (392 chars)
Fabulous Uptown double located blocks from Ochsner Baptist, Trader Joes, Freret Street restaurants, and more! Enjoy relaxing on the fabulous front porch while living minutes from all of the fun and action that New Orleans has to offer or add a wonderful rental to your portfolio. This shotgun style double has 3 bedrooms/1 bath in one unit and 2 bedrooms/2 baths in the other. Brand new roof!
-
2013-03-28$140,000 158-char remark
Show marketing remark (158 chars)
Renovated double, 2br/2ba on one side 3br/1ba on the other, rented section 8. each unit has HVAC and is in excellent condition, long term tenant on left side.
ⓘ Source: listings_history table (triggers on properties + properties_extension) + one-shot
backfill from property_details.listing_events for pre-trigger history.
Climate risk First Street
- Flood 8/10 Severe FEMA zone AE · 77% chance over 30 yrs
- Wildfire 1/10 Low
- Heat 10/10 Extreme 7 d/yr ≥108°F today · 21 d/yr by 30 yrs out
- Wind 10/10 Extreme 99% chance of damaging wind over 30 yrs
- Air quality 3/10 Moderate 3 unhealthy d/yr today · 4 by 30 yrs out
Nearby sold comps map
Loading sold comps map…
Walkable amenities ~0.75 mi
Loading nearby amenities…
Taxation est. · year 1
- Rental income
- $32,695
- − Mortgage interest
- −$15,404
- − Property taxes
- −$4,125
- − Insurance
- −$6,494
- − Repairs & maintenance
- −$2,616
- − Management
- −$2,616
- − Depreciation
- −$8,000
- Taxable loss
- −$6,559
- Est. tax savings @ 24.0%
- +$1,574
- After-tax cash flow
- $-521/yr
For passive investors: Depreciation is non-cash, so a rental often shows a tax loss while cash-flowing — sheltering income. Rental losses are passive: they offset passive income freely, and up to $25,000/yr can offset ordinary (W-2) income if you actively participate and your MAGI is under $100k (phasing out to $0 by $150k); unused losses carry forward. On sale, claimed depreciation is recaptured at up to 25%, and gains may owe capital-gains tax (a 1031 exchange can defer both). Figures are a year-1 estimate at your 24.0% rate — not tax advice; consult a CPA.
Schools (NCES district)
- District
- Orleans Parish
- NCES district ID
- 2201170
- Math proficiency
- 11% ▼ -52.00%
- Reading proficiency
- 27% ▼ -46.00%
- Median HH income
- $37,011
- Composite
- 15.78/100
- National rank
- #9271
- State rank
- #69 of 98 in LA
Livability — New Orleans
- Score
- 81/100
- State rank
- #3
- US rank
- #1383
Category grades
Schools grade is shown separately in the Schools card above.
Census & demographics
- Census place
- New Orleans, LA
- County
- Orleans Parish · 338,817 people
- City population
- 338,817
- Metro
- New Orleans-Metairie, LA
- Population (ZIP)
- 31,183
- Household income
- $90,182
- Rent vs Own
- Severe rent burden
- 1756.0
Population outlook (Orleans County) Hauer SSP2
- Today (2025)
- 513,025 people
- By 2030
- 575,781 · +12.2%
- By 2040
- 700,174 · +36.5%
- By 2050
- 826,541 · +61.1%
- By 2075
- 1,123,374 · +119.0%
- By 2100
- 1,355,609 · +164.2%
Race, ethnicity, and origin ACS 2023
- Neighborhood character
- Diverse neighborhood (Simpson 0.58)
- Race & ethnicity
- White 59% Black 26% Two or more races 8% Hispanic / Latino 7% Asian 3%
- Hispanic origin (detail)
- Mexican 1%
- Common ancestry
- Lithuanian 8% Italian 3% Slovak 3%
- Foreign-born
- 5% · Canada, China
- Languages at home
- 91% English-only · Spanish 4% French/Haitian/Cajun 2% Other Indo-European 1%
Political lean MEDSL · Orleans
- 2024 margin
- Solid D (+67.0) · D 82.2% · R 15.2% · Other 2.7%
- 2008→2024 swing
- +6.7pp toward D · 2008: 60.3pp · 2024: 67.0pp
- All cycles
- 2024: D+67.0 2020: D+68.2 2016: D+66.2 2012: D+62.5 2008: D+60.3
Not yet ingested
- Civics
- —
Market trends
- HPI YoY
- ▼ -272.08%
- Current HPI
- 287.2138
- Rent YoY
- ▼ -1.42%
- Metro
- New Orleans-Metairie, LA
- State GDP YoY
- ▲ 3.29%
- F500 in state
- 10
Industry mix (Fortune 500 HQ in LA)
| Industry | F500 HQs | Revenue |
|---|---|---|
| Telecommunications | 2 | $23B |
|
||
| Utilities | 1 | $12B |
|
||
| Wholesale / Distribution | 1 | $5B |
|
||
| Advertising | 1 | $2B |
|
||
Price history
+96.4% since first listed2 events — show timeline
- 2026-01-23 Listed $275,000 AcadianaMLS
- 2013-03-28 Listed $140,000 AcadianaMLS
Cash-flow waterfall
monthlySold comps — $/sqft
last 12 mo · ≤1 miLoading sold comps…