2915 Emma Ln · Mabank, TX
Flood risk 1/10 · Minimal
- FEMA flood zone
- X (unshaded)
- Chance of flooding over 30 yrs
- 0.0%
- Est. flood insurance / yr
- $507 – $1,088
Fire risk 3/10 · Minor
- Est. fire insurance / yr
- $1,222 – $2,270
Heat risk 7/10 · Major
- Hot days now (above 110°F)
- 7 days/yr
- Hot days in 30 yrs
- 26 days/yr
Wind risk 7/10 · Major
- Chance of severe wind over 30 yrs
- 78.0%
Air-quality risk 2/10 · Minimal
- Unhealthy air days now
- 0 days/yr
- Unhealthy air days in 30 yrs
- 1 days/yr
Risk factors via First Street. Map © Google.
Why this score? — see what drove the D- grade
The composite is a weighted blend of 9 inputs, each scored 0–100. Each bar is that input's sub-score; the figure is the points it added to the 100-point composite (weight × sub-score).
- Appreciation +10.0/10.0
- ARV discount +6.3/15.0
- Cash flow +6.0/30.0
- Rent growth +4.5/5.0
- Schools +3.8/10.0
- Livability +3.5/5.0
- Condition / age +2.5/5.0
- 1% rule +1.9/10.0
- DSCR +0.3/10.0
$235,000
🖨 Deal sheet (PDF) 📄 Offer letter ✓ Due diligence
Listing remarks MLS
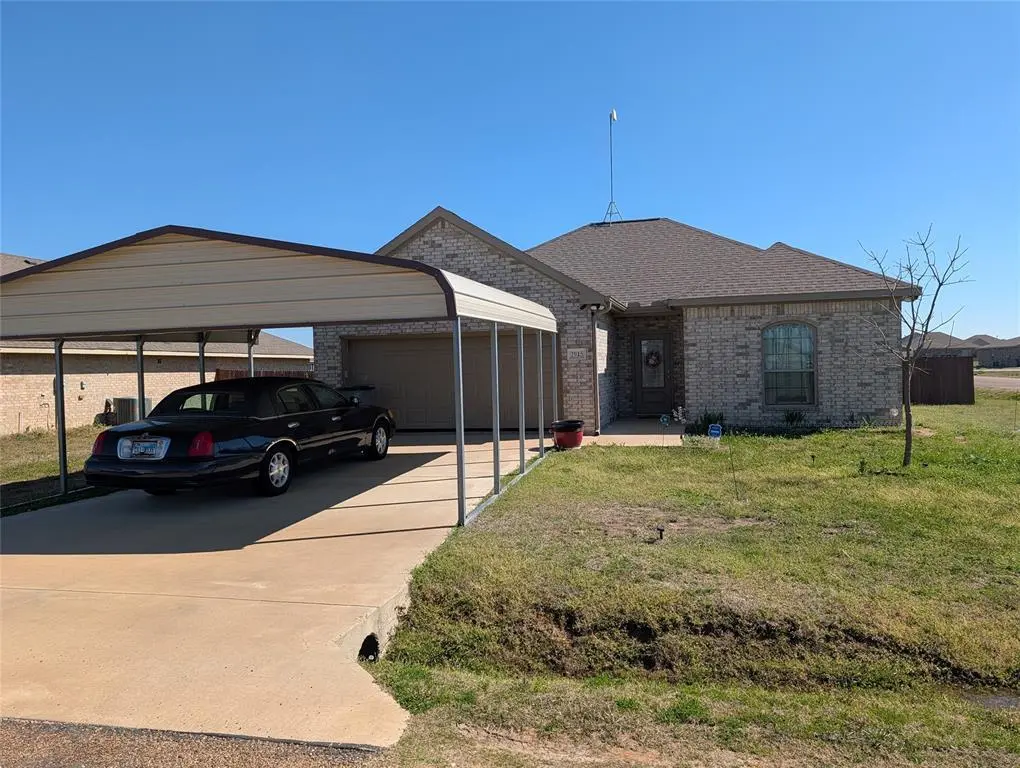
Built in 2021, this well-cared-for 3 bedroom, 2 bathroom, 2 car garage home in Mabank offers modern comfort with a practical layout. With 1,239 square feet, the open design makes great use of space while providing a warm and inviting feel throughout. Enjoy the covered back patio overlooking a privacy-fenced yard making it perfect for relaxing, pets, or entertaining. The insulated storage building adds extra space for tools and equipment, and the 2 car carport provides additional covered parking. This home is move-in ready and offers the benefits of newer construction without the wait.
Key facts
- Covered parking
- Covered back patio
- Privacy fenced yard
Tags
Neighborhood map
What this means for you Summary
Snapshot
- This is a 3-bed/2.0-bath single-family listed at $235k.
Deal economics
- At list price, monthly cash flow is $-451 ($-5k/yr) — negative.
- To cash-flow at today's rent, offer at most $155k (33.9% below list).
- To meet the 1% rule (rent ≥ 1% of price), the offer needs to be $162k (31.2% below list).
- Recommended offer: $155k (33.9% below list) — sets the bar for cash-flow.
- Cap rate 4.0% vs local median 3.1% in Mabank — meaningfully above typical; check what's discounted (condition, days-on-market, listing class) to confirm the premium yield is real.
Location & tenants
- Location reads 69/100 on livability (#446 in TX) — a middle-class / working-renter tenant base. Strengths: cost of living A+, housing A+, crime B+; Watch: amenities F, commute F, employment D-.
- Mabank ISD (town): math 47% / reading 44% proficiency, ranked #273 of 826 in TX (top 33%) — families likely to look elsewhere, expect single-tenant / working-renter base with shorter leases.
- Zoned schools: Central El (math 48% / reading 42%, grade D-, #1,133 of 4,322 statewide, top 27%, 675 students, 64% FRL); Mabank Int (math 49% / reading 34%, grade F, #595 of 1,662 statewide, top 37%, 611 students, 66% FRL); Mabank H S (math 36% / reading 53%, grade F, #652 of 1,632 statewide, top 43%, 1,111 students, 57% FRL).
- Market conditions: Rents rising fast (+8.1%/yr); 215 active listings in the ZIP; 10 comparable units currently listed for rent nearby; rentals leasing fast (median 8d on market — plan ~1-2 weeks tenant-placement turnaround); 1,747 units permitted in Kaufman County in 2024 (180 in 5+ unit buildings).
- This rent runs 34% of the median local income ($57k/yr) — at the standard rent-burdened threshold; future hikes will face affordability resistance.
Forward outlook
- In year one you build about $25k of equity ($2k loan paydown + $24k appreciation (10.0% local appreciation)).
- Kaufman County population projected at +43% by 2050 — long-run rental-demand tailwind backs the buy-and-hold thesis.
- By year 2, paydown + projected appreciation supports a ~$40k cash-out refi (75% LTV) — recoverable capital for the next deal without selling this one.
Negotiation context
- It's been on market 114 days — a 9% lower offer ($214k) is reasonable based on typical stale-listing flexibility.
- 4 sale attempts since 4y ago; this cycle's ask has dropped $29k (11%) from the opening price — seller is motivated, your offer sets the floor, not the list.
Risks & watch-outs
- Climate carrying-cost: major wind risk, 78% chance of damaging wind over 30y; extreme-heat days projected 7→26/yr by 2055 (HVAC capex compounding) — expect insurance premiums to compound above CPI over the hold.
Questions for the listing agent
- What do current leases actually rent for vs. the listed asking? Can we see a recent rent roll and the last 12 months of T-12 income?
- It's been on market 114 days. Have you received any prior offers? Is the seller open to a 34% concession, seller financing, or rate buy-down credit?
- Why hasn't it sold? Are there any deal-killer items the seller is aware of (foundation, flood, title, zoning, code violations)?
- Is there a deadline driving the sale (1031 exchange, divorce, estate, relocation)? That informs how much negotiation room exists.
- The area grade is low — what's the realistic commute time and amenity access for the typical tenant pool here? Any planned neighborhood developments (good or bad) we should know about?
- What's the average days-on-market for RENTAL listings here right now (not sales)? A rising rental-DOM trend means longer vacancies and softer asking-rent achievability than the comps imply.
- What's the recent tenant-quality profile in this submarket — average credit score on applications, eviction rate, late-payment / NSF rate, and stable-employment percentage? A property-management company in the area should have these aggregated.
- How much new for-sale + rental construction is in the pipeline within 1–3 miles? Heavy new supply typically softens prices + rents 12–24 months out; constrained supply supports both.
Investment metrics
- 1% rule
- 0.69% ✗
- Cap rate
- 3.99%
- Cash-on-cash
- -8.22%
- DSCR
- 0.63
- GRM
- 12.1
CMA / ARV
- ARV (median comp)
- $229,122
- List price
- $235,000
- Delta
- 2.57%
- Verdict
- FAIR
- Comps
- 20 within 1.0 mi
Show comp detail 11 sales within ~0.75 mi
| Address | Dist | Beds/Ba | Sqft | Sold | Price | $/sf | Match |
|---|---|---|---|---|---|---|---|
| 2906 Emma Ln | 0.08mi | 3/2.0 | 1,220 (-2%) | 4mo | $207,900 | $170 | 91 |
| 2908 Emma Ln | 0.07mi | 3/2.0 | 1,314 (+6%) | 4mo | $217,900 | $166 | 83 |
| 2901 Emma Ln | 0.10mi | 3/2.0 | 1,276 (+3%) | 9mo | $237,000 | $186 | 83 |
| 1023 Baker Ln | 0.32mi | 3/2.0 | 1,275 (+3%) | 4mo | $179,500 | $141 | 76 |
| 2020 Clay St | 0.17mi | 3/2.0 | 1,276 (+3%) | 15mo | $239,000 | $187 | 75 |
| 2213 Samuel St | 0.13mi | 3/2.0 | 1,272 (+3%) | 18mo | $238,900 | $188 | 74 |
| 1002 Baker Ln | 0.40mi | 3/2.0 | 1,289 (+4%) | 5mo | $234,623 | $182 | 70 |
| 2211 Samuel St | 0.15mi | 3/2.0 | 1,272 (+3%) | 24mo | $241,900 | $190 | 69 |
| 1034 Springview Ln | 0.57mi | 3/2.0 | 1,301 (+5%) | 10mo | $249,000 | $191 | 57 |
| 1043 Springview Ln | 0.62mi | 3/2.0 | 1,301 (+5%) | 10mo | $249,000 | $191 | 55 |
| 1042 Springview Ln | 0.61mi | 3/2.0 | 1,301 (+5%) | 12mo | $249,000 | $191 | 53 |
Match score weights: distance 35% · size 25% · config 20% · recency 20%. Top-matched comps best support the ARV.
Projected returns pro-forma
10.0% appreciation · 8.0% rent growth · sell at horizon
- IRR
- 19.9%
- Equity multiple
- 2.64×
- Total profit
- $107,905
- Equity at exit
- $211,707
- IRR
- 19.4%
- Equity multiple
- 6.50×
- Total profit
- $361,682
- Equity at exit
- $456,553
Cash invested: $65,800 (down + closing). Projections, not guarantees.
Landlord ↔ Tenant lean methodology
- Overall (STATE)
- 87 Strongly Landlord-Friendly
- State Texas
- 87 Strongly Landlord-Friendly · R+5
- County
- — inherits STATE
- City
- — inherits STATE
ZIP-level market 75147
- Home prices YoY
- 4.6%
- Rents YoY
- 8.1%
- Active inventory
- 215
- Price-to-rent
- 12.1×
Monthly cashflow live
- Estimated rent
- $1,616 high interval (Pro) →
- Mortgage (P&I)
- −$1,232
- Tax from tax record
- −$398 /mo · $4,770/yr
- Insurance
- −$98
- HOA
- −$0
- Vacancy / Maint / Mgmt
- −$339
- Net cashflow
- $-451
Break-even live
Sensitivity live
| Price | -10% $-318 | -5% $-384 | +0% $-451 | +5% $-517 | +10% $-584 |
|---|---|---|---|---|---|
| Rent | -10% $-579 | -5% $-515 | +0% $-451 | +5% $-387 | +10% $-323 |
| Rate | -1.0pp $-332 | -0.5pp $-391 | base $-451 | +0.5pp $-512 | +1.0pp $-574 |
UW: 25.0% down · 7.5% · 30yr · 1.5% tax · 5.0% vac · 8.0% maint · 8.0% mgmt
Financing live
Cash to close
- Down payment
- $58,750
- Closing costs
- $7,050
- Reserves months
- —
- Total cash needed
- —
Loan-product check · same deal, 3 products live
Conventional
25% down · 7.5% · 30yr
- Down + closing
- —
- Monthly P&I
- —
- Monthly cashflow
- —
- DSCR
- —
- Eligible?
- —
Personal DTI + credit; lowest rate.
DSCR
20% down · 8.5% · 30yr
- Down + closing
- —
- Monthly P&I
- —
- Monthly cashflow
- —
- DSCR
- —
- Eligible?
- —
No personal income docs; deal must DSCR.
Hard money
10% down · 12.0% · 12mo
- Down + closing
- —
- Monthly P&I
- —
- Monthly cashflow
- —
- DSCR
- —
- Eligible?
- —
Short-term bridge; refi at stabilization.
Rent comps 10 comps
| Address | Beds | Baths | Sqft | Rent | $/sqft | DOM | Units | Dist |
|---|---|---|---|---|---|---|---|---|
| 2712 William St Mabank, TX | 3.0 | 2.0 | 1028 | $1,440 | $1.40 | 45d | 1 | 0.04mi |
| 2904 Emma Ln Mabank, TX | 3.0 | 2.0 | 1298 | $1,499 | $1.15 | 45d | 1 | 0.08mi |
| 2033 Clay St Mabank, TX | 3.0 | 2.0 | 1028 | $1,414 | $1.38 | 0d | 1 | 0.08mi |
| 2034 Clay St Mabank, TX | 3.0 | 2.0 | 1298 | $1,465 | $1.13 | 0d | 1 | 0.09mi |
| 2031 Clay St Mabank, TX | 3.0 | 2.0 | 1298 | $1,314 | $1.01 | 0d | 1 | 0.09mi |
| 2032 Clay St Mabank, TX | 3.0 | 2.0 | 1197 | $1,314 | $1.10 | 7d | 1 | 0.10mi |
| 2029 Clay St Mabank, TX | 3.0 | 2.0 | 1028 | $1,414 | $1.38 | 45d | 1 | 0.11mi |
| 2503 Jax St Mabank, TX | 3.0 | 2.0 | 1079 | $1,695 | $1.57 | 23d | 1 | 0.12mi |
| 2027 Clay St Mabank, TX | 3.0 | 2.0 | 1298 | $1,414 | $1.09 | 8d | 1 | 0.12mi |
| 18409 County Road 4001 Mabank, TX | 3.0–4.0 | 2.0 | 1750 | $1,725 | $0.99 | 0d | 16 | 0.27mi |
Listing history 28 events
-
2026-06-21days on market $235,000 Active 114 DOM
-
2026-06-19days on market $235,000 Active 112 DOM
-
2026-06-18days on market $235,000 Active 111 DOM
-
2026-06-17days on market $235,000 Active 110 DOM
-
2026-06-16days on market $235,000 Active 109 DOM
-
2026-06-15days on market $235,000 Active 108 DOM
-
2026-06-14days on market $235,000 Active 106 DOM
-
2026-06-12days on market $235,000 Active 105 DOM
-
2026-06-09days on market $235,000 Active 102 DOM
-
2026-06-08days on market $235,000 Active 101 DOM
-
2026-06-07days on market $235,000 Active 100 DOM
-
2026-06-05days on market $235,000 Active 97 DOM
-
2026-06-03days on market $235,000 Active 96 DOM
-
2026-06-02days on market $235,000 Active 95 DOM
-
2026-06-01days on market $235,000 Active 94 DOM
-
2026-05-31days on market $235,000 Active 93 DOM
-
2026-05-30days on market $235,000 Active 92 DOM
-
2026-05-15price $235,000 591-char remark
Show marketing remark (591 chars)
Built in 2021, this well-cared-for 3 bedroom, 2 bathroom, 2 car garage home in Mabank offers modern comfort with a practical layout. With 1,239 square feet, the open design makes great use of space while providing a warm and inviting feel throughout. Enjoy the covered back patio overlooking a privacy-fenced yard making it perfect for relaxing, pets, or entertaining. The insulated storage building adds extra space for tools and equipment, and the 2 car carport provides additional covered parking. This home is move-in ready and offers the benefits of newer construction without the wait.
-
2026-02-28$264,000 Active 591-char remark
Show marketing remark (591 chars)
Built in 2021, this well-cared-for 3 bedroom, 2 bathroom, 2 car garage home in Mabank offers modern comfort with a practical layout. With 1,239 square feet, the open design makes great use of space while providing a warm and inviting feel throughout. Enjoy the covered back patio overlooking a privacy-fenced yard making it perfect for relaxing, pets, or entertaining. The insulated storage building adds extra space for tools and equipment, and the 2 car carport provides additional covered parking. This home is move-in ready and offers the benefits of newer construction without the wait.
-
2026-02-27$264,000 Active 591-char remark
Show marketing remark (591 chars)
Built in 2021, this well-cared-for 3 bedroom, 2 bathroom, 2 car garage home in Mabank offers modern comfort with a practical layout. With 1,239 square feet, the open design makes great use of space while providing a warm and inviting feel throughout. Enjoy the covered back patio overlooking a privacy-fenced yard making it perfect for relaxing, pets, or entertaining. The insulated storage building adds extra space for tools and equipment, and the 2 car carport provides additional covered parking. This home is move-in ready and offers the benefits of newer construction without the wait.
-
2022-05-12soldstatus
-
2022-05-11soldstatus Closed
-
2022-04-18status Pending
-
2022-04-08historical Active Option Contract
-
2022-04-05$225,900 Active
-
2022-04-05historical
-
2022-04-05$225,900 Active
ⓘ Source: listings_history table (triggers on properties + properties_extension) + one-shot
backfill from property_details.listing_events for pre-trigger history.
Tax reassessment forecast TX · Resets to sale price
- Current annual tax
- $4,770 · $398/mo
- Projected year-2 tax
- $4,770 · $398/mo
- Expected delta
- $0/yr ($0/mo · 0.0%)
ⓘ Screening estimate from a state-policy table — verify with the county assessor before closing.
Climate risk First Street
- Flood 1/10 Low FEMA zone X (unshaded) · 0% chance over 30 yrs
- Wildfire 3/10 Moderate
- Heat 7/10 Severe 7 d/yr ≥110°F today · 26 d/yr by 30 yrs out
- Wind 7/10 Severe 78% chance of damaging wind over 30 yrs
- Air quality 2/10 Low 0 unhealthy d/yr today · 1 by 30 yrs out
Nearby sold comps map
Loading sold comps map…
Walkable amenities ~0.75 mi
Loading nearby amenities…
Taxation est. · year 1
- Rental income
- $19,398
- − Mortgage interest
- −$13,164
- − Property taxes
- −$4,770
- − Insurance
- −$1,175
- − Repairs & maintenance
- −$1,552
- − Management
- −$1,552
- − Depreciation
- −$6,836
- Taxable loss
- −$9,652
- Est. tax savings @ 24.0%
- +$2,316
- After-tax cash flow
- $-3,093/yr
For passive investors: Depreciation is non-cash, so a rental often shows a tax loss while cash-flowing — sheltering income. Rental losses are passive: they offset passive income freely, and up to $25,000/yr can offset ordinary (W-2) income if you actively participate and your MAGI is under $100k (phasing out to $0 by $150k); unused losses carry forward. On sale, claimed depreciation is recaptured at up to 25%, and gains may owe capital-gains tax (a 1031 exchange can defer both). Figures are a year-1 estimate at your 24.0% rate — not tax advice; consult a CPA.
Schools (NCES district)
- District
- Mabank ISD
- NCES district ID
- 4828680
- Math proficiency
- 47% ▼ -19.00%
- Reading proficiency
- 44% ▼ -11.00%
- Median HH income
- $40,321
- Composite
- 38.15/100
- National rank
- #4267
- State rank
- #273 of 826 in TX
Livability — Mabank
- Score
- 69/100
- State rank
- #446
- US rank
- #9068
Category grades
Schools grade is shown separately in the Schools card above.
Census & demographics
- Census place
- Mabank, TX
- County
- Van Zandt County · 9,177 people
- Metro
- Dallas-Fort Worth-Arlington, TX
- Population (ZIP)
- 9,177
- Household income
- $56,940
- Rent vs Own
- Severe rent burden
- 279.0
Population outlook (Kaufman County) Hauer SSP2
- Today (2025)
- 138,716 people
- By 2030
- 150,815 · +8.7%
- By 2040
- 174,877 · +26.1%
- By 2050
- 198,020 · +42.8%
- By 2075
- 251,908 · +81.6%
- By 2100
- 285,325 · +105.7%
Race, ethnicity, and origin ACS 2023
- Neighborhood character
- Predominantly White (86%)
- Race & ethnicity
- White 86% Hispanic / Latino 10% Two or more races 8% Black 2%
- Hispanic origin (detail)
- Mexican 10%
- Common ancestry
- Lithuanian 2% Serbian 2% Romanian 1%
- Foreign-born
- 2% · Canada
- Languages at home
- 95% English-only · Spanish 4%
Political lean MEDSL · Kaufman
- 2024 margin
- Strong R (+27.9) · D 35.6% · R 63.5%
- 2008→2024 swing
- +7.9pp toward D · 2008: -35.8pp · 2024: -27.9pp
- All cycles
- 2024: R+27.9 2020: R+33.9 2016: R+47.0 2012: R+44.4 2008: R+35.8
Not yet ingested
- Civics
- —
Market trends
- HPI YoY
- ▲ 11.14%
- Current HPI
- 254.32
- Rent YoY
- ▲ 8.13%
- Metro
- Dallas-Fort Worth-Arlington, TX
- State GDP YoY
- ▲ 3.95%
- F500 in state
- 110
Industry mix (Fortune 500 HQ in TX)
| Industry | F500 HQs | Revenue |
|---|---|---|
| Energy | 16 | $1,198B |
|
||
| Technology | 5 | $198B |
|
||
| Engineering / Construction | 4 | $72B |
|
||
| Energy Services | 3 | $60B |
|
||
| Utilities | 3 | $41B |
|
||
| Healthcare | 2 | $330B |
|
||
Price history
+4.0% since first listed11 events — show timeline
- 2026-05-15 Price Changed $235,000 NTREIS
- 2026-05-15 Price Changed $235,000 HCBOR
- 2026-02-28 Listed $264,000 HCBOR
- 2026-02-27 Listed $264,000 NTREIS
- 2022-05-12 Sold (Public Records) — Public Records
- 2022-05-11 Sold (MLS) — NTREIS
- 2022-04-18 Pending — NTREIS
- 2022-04-08 Contingent — NTREIS
- 2022-04-05 Listed $225,900 NTREIS
- 2022-04-05 Listing Removed — NTREIS
- 2022-04-05 Listed $225,900 NTREIS
Property tax history
+72.6%/yrLatest (2025): $4,770 · +3.8% YoY. Source: county tax records.
Cash-flow waterfall
monthlySold comps — $/sqft
last 12 mo · ≤1 miLoading sold comps…