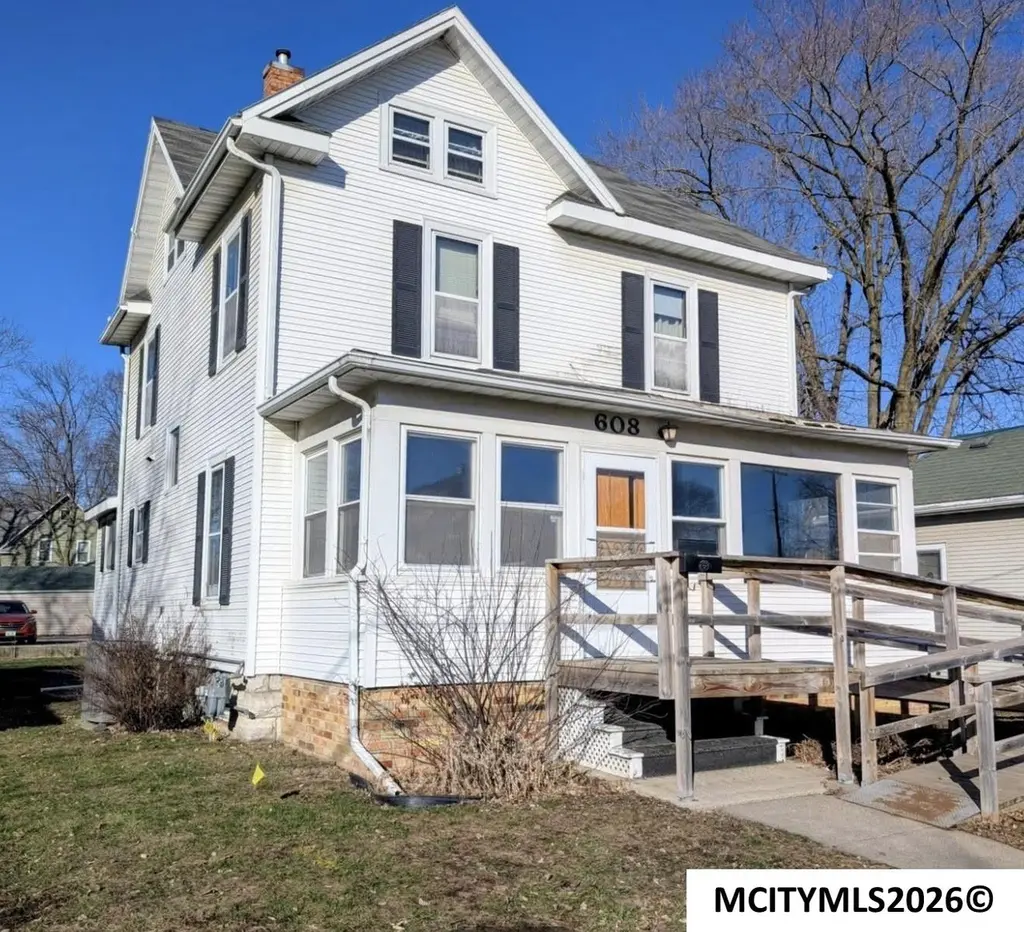
608 S Carolina Ave Ave · Mason City, IA
Flood risk 1/10 · Minimal
- FEMA flood zone
- X (unshaded)
- Chance of flooding over 30 yrs
- 0.0%
- Est. flood insurance / yr
- $473 – $860
Fire risk 2/10 · Minimal
- Est. fire insurance / yr
- $902 – $1,676
Heat risk 2/10 · Minimal
- Hot days now (above 100°F)
- 7 days/yr
- Hot days in 30 yrs
- 16 days/yr
Wind risk 2/10 · Minimal
- Chance of severe wind over 30 yrs
- —
Air-quality risk 1/10 · Minimal
- Unhealthy air days now
- 0 days/yr
- Unhealthy air days in 30 yrs
- 0 days/yr
Risk factors via First Street. Map © Google.
Why this score? — see what drove the D+ grade
The composite is a weighted blend of 9 inputs, each scored 0–100. Each bar is that input's sub-score; the figure is the points it added to the 100-point composite (weight × sub-score).
- ARV discount +15.0/15.0
- Cash flow +14.0/30.0
- Schools +4.5/10.0
- DSCR +4.2/10.0
- Livability +4.0/5.0
- 1% rule +3.2/10.0
- Rent growth +2.5/5.0
- Condition / age +2.5/5.0
- Appreciation +0.0/10.0
$189,000
🖨 Deal sheet 📄 Offer letter ✓ Due diligence
Listing remarks MLS
Great 4plus bedroom home with all of the original character/charm and has all of the updates needed. Beautiful open staircase, leaded glass windows, hardwood trim, pocket doors, huge kitchen, main floor laundry, walk in pantry, formal entry, 4 season porches on both main and second level, finished attic, over sized 2 stall garage and storage shed with alley access and spacious patio! Call today
Key facts
- Open staircase
- Pocket doors
- Grand foyer
Tags
Property features AI
Exterior
- Parking: Detached concrete garage with 2 spaces
- Utilities: Public water; Public sewer
- Home design: Single family residence; 2 stories; Residential property
- Construction: Frame construction; Asphalt roof; Below-grade finished area (part of basement): 450
- Exterior features: Patio; Shed(s)
Interior
- Kitchen: Dishwasher; Gas range; Microwave; Refrigerator
- Flooring: Carpet; Laminate; Wood
- Heating & cooling: Forced air heating (Natural Gas); Central air conditioning
- Interior features: Eat-in kitchen; Full, partially finished basement
Neighborhood map
What this means for you Summary
Snapshot
- This is a 5-bed/2.0-bath single-family listed at $189k.
Deal economics
- At list price, monthly cash flow is $23 ($274/yr) — positive.
- The deal already cash-flows at list — no discount required.
- To meet the 1% rule (rent ≥ 1% of price), the offer needs to be $155k (17.9% below list).
- Recommended offer: $155k (17.9% below list) — sets the bar for 1% rule.
- Cap rate 6.4% vs local median 5.2% in Mason City — meaningfully above typical; check what's discounted (condition, days-on-market, listing class) to confirm the premium yield is real.
Location & tenants
- Location reads 81/100 on livability (#67 in IA, #1,477 nationally) — a professional / high-income tenant draw. Strengths: commute A+, cost of living A+, housing A+; Watch: amenities F.
- Mason City Community School District (town): math 50% / reading 58% proficiency, ranked #271 of 289 in IA (top 94%) — acceptable for families but not a draw, mixed tenant base, ~2y average lease.
- Market conditions: 153 active listings in the ZIP; 54 units permitted in Cerro Gordo County in 2024 (6 in 5+ unit buildings).
Forward outlook
- Local home prices are declining (-3.0%/yr); year-one equity from $1k of loan paydown is wiped out by about $6k of value loss. Plan a longer hold.
- Cerro Gordo County population projected at -18% by 2050 — secular population decline; favor cash flow + early exit over multi-decade hold.
Negotiation context
- Only 14 days on market — expect competitive offers; lowballing is unlikely to land.
- 2 sale attempts since 2y ago with the ask held roughly flat each time — persistent listings suggest the price (not the market) is what's stuck; bring a comps-based counter.
- Current owner paid $150k; 26% above their basis — modest negotiation headroom, anchor on the comps not their cost.
Risks & watch-outs
- Watch-outs: built in 1916 — expect roof / HVAC / electrical / plumbing capex.
Questions for the listing agent
- Built in 1916 — when were the roof, HVAC, electrical panel, plumbing, and water heater last replaced?
- Is there a deadline driving the sale (1031 exchange, divorce, estate, relocation)? That informs how much negotiation room exists.
- The area grade is low — what's the realistic commute time and amenity access for the typical tenant pool here? Any planned neighborhood developments (good or bad) we should know about?
- What's the average days-on-market for RENTAL listings here right now (not sales)? A rising rental-DOM trend means longer vacancies and softer asking-rent achievability than the comps imply.
- What's the recent tenant-quality profile in this submarket — average credit score on applications, eviction rate, late-payment / NSF rate, and stable-employment percentage? A property-management company in the area should have these aggregated.
- How much new for-sale + rental construction is in the pipeline within 1–3 miles? Heavy new supply typically softens prices + rents 12–24 months out; constrained supply supports both.
Investment metrics
- 1% rule
- 0.82% ✗
- Cap rate
- 6.44%
- Cash-on-cash
- 0.52%
- DSCR
- 1.02
- GRM
- 10.2
CMA / ARV
- ARV (on-the-fly)
- $246,558
- Comps found
- 12
Show comp detail 12 sales within ~0.75 mi
| Address | Dist | Beds/Ba | Sqft | Sold | Price | $/sf | Match |
|---|---|---|---|---|---|---|---|
| 706 6th St SE | 0.24mi | 4/2.0 (-1) | 2,184 (-3%) | 0mo | $238,000 | $109 | 78 |
| 834 4th St SE | 0.38mi | 5/2.5 | 2,322 (+3%) | 6mo | $159,900 | $69 | 70 |
| 215 S Vermont Ave | 0.53mi | 4/2.2 (-1) | 2,267 (+0%) | 4mo | $245,000 | $108 | 66 |
| 419 1st St SE | 0.35mi | 4/2.5 (-1) | 2,288 (+1%) | 14mo | $257,500 | $113 | 63 |
| 104 River Heights Dr Dr | 0.26mi | 4/2.2 (-1) | 2,451 (+8%) | 11mo | $288,775 | $118 | 59 |
| 35 S Tennessee Ave | 0.67mi | 5/1.8 | 2,368 (+5%) | 3mo | $189,000 | $80 | 58 |
| 950 7th St SE | 0.50mi | 4/2.0 (-1) | 2,163 (-4%) | 13mo | $199,500 | $92 | 53 |
| 201 S Vermont Ave | 0.54mi | 4/1.8 (-1) | 2,093 (-8%) | 7mo | $180,000 | $86 | 51 |
| 30 Kentucky Ct Ct | 0.57mi | 4/1.8 (-1) | 2,112 (-7%) | 9mo | $265,000 | $125 | 49 |
| 612 S Pennsylvania Ave | 0.38mi | 4/2.2 (-1) | 2,055 (-9%) | 15mo | $91,000 | $44 | 49 |
| 647 E State St | 0.41mi | 4/3.0 (-1) | 2,004 (-11%) | 12mo | $235,000 | $117 | 43 |
| 330 E State St | 0.46mi | 4/2.5 (-1) | 1,929 (-15%) | 8mo | $268,000 | $139 | 40 |
Match score weights: distance 35% · size 25% · config 20% · recency 20%. Top-matched comps best support the ARV.
Projected returns pro-forma
-3.0% appreciation · 3.0% rent growth · sell at horizon
- IRR
- -15.5%
- Equity multiple
- 0.45×
- Total profit
- $-29,213
- Equity at exit
- $28,181
- IRR
- -7.1%
- Equity multiple
- 0.55×
- Total profit
- $-23,730
- Equity at exit
- $16,341
Cash invested: $52,920 (down + closing). Projections, not guarantees.
Landlord ↔ Tenant lean methodology
- Overall (STATE)
- 83 Strongly Landlord-Friendly
- State Iowa
- 83 Strongly Landlord-Friendly · R+6
- County
- — inherits STATE
- City
- — inherits STATE
ZIP-level market 50401
- Active inventory
- 153
- Price-to-rent
- 10.2×
Monthly cashflow live
- Estimated rent
- $1,551 medium interval (Pro) →
- Mortgage (P&I)
- −$991
- Tax from tax record
- −$133 /mo · $1,592/yr
- Insurance
- −$79
- HOA
- −$0
- Vacancy / Maint / Mgmt
- −$326
- Net cashflow
- $23
Break-even live
UW: 25.0% down · 7.5% · 30yr · 1.5% tax · 5.0% vac · 8.0% maint · 8.0% mgmt
Financing live
Cash to close
- Down payment
- $47,250
- Closing costs
- $5,670
- Reserves months
- —
- Total cash needed
- —
Loan-product check · same deal, 3 products live
Conventional
25% down · 7.5% · 30yr
- Down + closing
- —
- Monthly P&I
- —
- Monthly cashflow
- —
- DSCR
- —
- Eligible?
- —
Personal DTI + credit; lowest rate.
DSCR
20% down · 8.5% · 30yr
- Down + closing
- —
- Monthly P&I
- —
- Monthly cashflow
- —
- DSCR
- —
- Eligible?
- —
No personal income docs; deal must DSCR.
Hard money
10% down · 12.0% · 12mo
- Down + closing
- —
- Monthly P&I
- —
- Monthly cashflow
- —
- DSCR
- —
- Eligible?
- —
Short-term bridge; refi at stabilization.
Listing history 11 events
-
2026-06-18days on market $189,000 Active 14 DOM
-
2026-06-17days on market $189,000 Active 13 DOM
-
2026-06-16days on market $189,000 Active 12 DOM
-
2026-06-15days on market $189,000 Active 11 DOM
-
2026-06-13days on market $189,000 Active 9 DOM
-
2026-06-12days on market $189,000 Active 8 DOM
-
2026-06-09days on market $189,000 Active 5 DOM
-
2026-06-08days on market $189,000 Active 4 DOM
-
2026-06-07days on market $189,000 Active 3 DOM
-
2026-06-07remarks 687-char remark
-
2026-06-07$189,000 Active 2 DOM
ⓘ Source: listings_history table (triggers on properties + properties_extension) + one-shot
backfill from property_details.listing_events for pre-trigger history.
Tax reassessment forecast IA · Partial reset (capped growth)
- Current annual tax
- $1,592 · $133/mo
- Projected year-2 tax
- $2,280 · $190/mo
- Expected delta
- +$688/yr (+$57/mo · 43.2%)
ⓘ Screening estimate from a state-policy table — verify with the county assessor before closing.
Climate risk First Street
- Flood 1/10 Low FEMA zone X (unshaded) · 0% chance over 30 yrs
- Wildfire 2/10 Low
- Heat 2/10 Low 7 d/yr ≥100°F today · 16 d/yr by 30 yrs out
- Wind 2/10 Low
- Air quality 1/10 Low 0 unhealthy d/yr today · 0 by 30 yrs out
Nearby sold comps map
Loading sold comps map…
Walkable amenities ~0.75 mi
Loading nearby amenities…
Taxation est. · year 1
- Rental income
- $18,613
- − Mortgage interest
- −$10,587
- − Property taxes
- −$1,592
- − Insurance
- −$945
- − Repairs & maintenance
- −$1,489
- − Management
- −$1,489
- − Depreciation
- −$5,498
- Taxable loss
- −$2,987
- Est. tax savings @ 24.0%
- +$717
- After-tax cash flow
- $991/yr
For passive investors: Depreciation is non-cash, so a rental often shows a tax loss while cash-flowing — sheltering income. Rental losses are passive: they offset passive income freely, and up to $25,000/yr can offset ordinary (W-2) income if you actively participate and your MAGI is under $100k (phasing out to $0 by $150k); unused losses carry forward. On sale, claimed depreciation is recaptured at up to 25%, and gains may owe capital-gains tax (a 1031 exchange can defer both). Figures are a year-1 estimate at your 24.0% rate — not tax advice; consult a CPA.
Schools (NCES district)
- District
- Mason City Community School District
- NCES district ID
- 1918780
- Math proficiency
- 50% ▼ -1.00%
- Reading proficiency
- 58% ▼ -7.00%
- Median HH income
- $43,668
- Composite
- 45.47/100
- National rank
- #2614
- State rank
- #271 of 289 in IA
Livability — Mason City
- Score
- 81/100
- State rank
- #67
- US rank
- #1477
Category grades
Schools grade is shown separately in the Schools card above.
Census & demographics
- Census place
- Mason City, IA
- City population
- 28,818
- Population (ZIP)
- 28,818
Population outlook (Cerro Gordo County) Hauer SSP2
- Today (2025)
- 41,080 people
- By 2030
- 39,746 · -3.2%
- By 2040
- 36,608 · -10.9%
- By 2050
- 33,682 · -18.0%
- By 2075
- 29,702 · -27.7%
- By 2100
- 27,399 · -33.3%
Race, ethnicity, and origin ACS 2023
- Neighborhood character
- Predominantly White (87%)
- Race & ethnicity
- White 87% Hispanic / Latino 6% Two or more races 5% Black 3% Asian 1%
- Hispanic origin (detail)
- Mexican 5%
- Common ancestry
- Portuguese 12% Iranian 2% Lithuanian 2%
- Foreign-born
- 2% · Canada, Vietnam
- Languages at home
- 96% English-only · Spanish 3% Other Asian/Pacific 1%
Political lean MEDSL · Cerro Gordo
- 2024 margin
- R (+11.7) · D 43.4% · R 55.0% · Other 1.6%
- 2008→2024 swing
- -32.5pp toward R · 2008: 20.8pp · 2024: -11.7pp
- All cycles
- 2024: R+11.7 2020: R+6.3 2016: R+7.7 2012: D+13.2 2008: D+20.8
Not yet ingested
- Civics
- —
Market trends
- HPI YoY
- ▼ -130.01%
- Current HPI
- 199.1966
- Rent YoY
- —
- Metro
- —
- State GDP YoY
- ▲ 2.48%
- F500 in state
- 4
Industry mix (Fortune 500 HQ in IA)
| Industry | F500 HQs | Revenue |
|---|---|---|
| Financial Services | 1 | $16B |
|
||
| Retail / Convenience | 1 | $15B |
|
||
Price history
+18.2% since first listed5 events — show timeline
- 2026-06-04 Listed $189,000 Greater Mason BOR
- 2025-02-19 Sold (Public Records) $150,000 Public Records
- 2025-02-06 Sold (MLS) $152,000 Greater Mason BOR
- 2024-12-19 Contingent — Greater Mason BOR
- 2024-11-21 Listed $159,900 Greater Mason BOR
Property tax history
+0.5%/yrLatest (2025): $1,592 · -3.4% YoY. Source: county tax records.
Cash-flow waterfall
monthlySold comps — $/sqft
last 12 mo · ≤1 miLoading sold comps…