3323 Iowa St #286 · Lawrence, KS
Flood risk 1/10 · Minimal
- FEMA flood zone
- X (unshaded)
- Chance of flooding over 30 yrs
- 0.0%
- Est. flood insurance / yr
- $473 – $860
Fire risk 3/10 · Minor
- Est. fire insurance / yr
- $1,154 – $2,142
Heat risk 5/10 · Moderate
- Hot days now (above 109°F)
- 7 days/yr
- Hot days in 30 yrs
- 16 days/yr
Wind risk 2/10 · Minimal
- Chance of severe wind over 30 yrs
- —
Air-quality risk 2/10 · Minimal
- Unhealthy air days now
- 1 days/yr
- Unhealthy air days in 30 yrs
- 2 days/yr
Risk factors via First Street. Map © Google.
Why this score? — see what drove the D+ grade
The composite is a weighted blend of 9 inputs, each scored 0–100. Each bar is that input's sub-score; the figure is the points it added to the 100-point composite (weight × sub-score).
- Cash flow +15.0/30.0
- ARV discount +7.5/15.0
- 1% rule +5.0/10.0
- DSCR +5.0/10.0
- Rent growth +4.8/5.0
- Livability +4.4/5.0
- Condition / age +4.0/5.0
- Schools +3.2/10.0
- Appreciation +0.0/10.0
$39,900
🖨 Deal sheet (PDF) 📄 Offer letter ✓ Due diligence
Listing remarks
* THIS IS A RESALE LISTING * You'll love living in this 3 bedroom, 2 bathroom home within a wonderful family-friendly community. Check out the awesome amenities your community has to offer such as a swimming pool, a soccer field, a basketball court, and more! This home won't be on the market long, so call us today for more information or to schedule a tour. Deposits & Fees are subject to change.
Key facts
- Soccer field
- Swimming pool
- Basketball court
Tags
Property features AI
Finance
- Other: Living area approximately 1,216 (listed)
- Financial info: Listed price $45,000
Exterior
- Utilities: Natural gas service; Central air
- Home design: Spec new construction plan 93222; Single-level (1 story) residence
Interior
- Bedrooms: 3 bedrooms
- Bathrooms: 2 full bathrooms
- Heating & cooling: Natural gas heating; Central air conditioning
- Interior features: Open living area
Neighborhood map
What this means for you Summary
Snapshot
- This is a 3-bed/2.0-bath manufactured listed at $40k. Condition is rated good.
Deal economics
- At list price, monthly cash flow is $1k ($13k/yr) — positive.
- The deal already cash-flows at list — no discount required.
- Meets the 1% rule at list price ($2k rent vs $40k).
- Recommended offer: $36k (9.0% below list) — sets the bar for market timing.
- Cap rate 39.2% vs local median 2.7% in Lawrence — top-decile yield for the area; either an underpriced asset or a hidden risk that comps aren't pricing in. Stress-test before assuming the spread holds.
Location & tenants
- Location reads 88/100 on livability (#1 in KS, #237 nationally) — a professional / high-income tenant draw. Strengths: amenities A+, commute A+, cost of living A+; Watch: crime D-.
- Lawrence (urban): math 31% / reading 44% proficiency, ranked #46 of 169 in KS (top 27%) — families likely to look elsewhere, expect single-tenant / working-renter base with shorter leases.
- Market conditions: Rents rising fast (+9.4%/yr); 62 active listings in the ZIP; 246 units permitted in Douglas County in 2024 (38 in 5+ unit buildings).
- This rent runs 32% of the median local income ($65k/yr) — at the standard rent-burdened threshold; future hikes will face affordability resistance.
Forward outlook
- Local home prices are declining (-3.0%/yr); year-one equity from $276 of loan paydown is wiped out by about $1k of value loss. Plan a longer hold.
- Douglas County population projected at +39% by 2050 — long-run rental-demand tailwind backs the buy-and-hold thesis.
- At projected returns (-3.0% appreciation + 8.0% rent growth), your $11k cash investment doubles in ~1 year — after that, you're playing with house money.
Negotiation context
- It's been on market 100 days — a 9% lower offer ($36k) is reasonable based on typical stale-listing flexibility.
Risks & watch-outs
- Climate carrying-cost: extreme-heat days projected 7→16/yr by 2055 (HVAC capex compounding) — expect insurance premiums to compound above CPI over the hold.
Questions for the listing agent
- It's been on market 100 days. Have you received any prior offers? Is the seller open to a 9% concession, seller financing, or rate buy-down credit?
- Why hasn't it sold? Are there any deal-killer items the seller is aware of (foundation, flood, title, zoning, code violations)?
- Is there a deadline driving the sale (1031 exchange, divorce, estate, relocation)? That informs how much negotiation room exists.
- Crime grade is D in this area — have there been break-ins, vandalism, or insurance claims at this property in the last 3 years? What carrier currently insures it and at what premium?
- The area grade is low — what's the realistic commute time and amenity access for the typical tenant pool here? Any planned neighborhood developments (good or bad) we should know about?
- What's the average days-on-market for RENTAL listings here right now (not sales)? A rising rental-DOM trend means longer vacancies and softer asking-rent achievability than the comps imply.
- What's the recent tenant-quality profile in this submarket — average credit score on applications, eviction rate, late-payment / NSF rate, and stable-employment percentage? A property-management company in the area should have these aggregated.
- How much new for-sale + rental construction is in the pipeline within 1–3 miles? Heavy new supply typically softens prices + rents 12–24 months out; constrained supply supports both.
Investment metrics
- 1% rule
- 4.35% ✓
- Cap rate
- 39.21%
- Cash-on-cash
- 117.56%
- DSCR
- 6.23
- GRM
- 1.9
CMA / ARV
No comps found within radius.
Projected returns pro-forma
-3.0% appreciation · 8.0% rent growth · sell at horizon
- IRR
- —
- Equity multiple
- 7.48×
- Total profit
- $72,436
- Equity at exit
- $5,949
- IRR
- —
- Equity multiple
- 18.42×
- Total profit
- $194,664
- Equity at exit
- $3,450
Cash invested: $11,172 (down + closing). Projections, not guarantees.
Landlord ↔ Tenant lean methodology
- Overall (STATE)
- 83 Strongly Landlord-Friendly
- State Kansas
- 83 Strongly Landlord-Friendly · R+10
- County
- — inherits STATE
- City
- — inherits STATE
ZIP-level market 66046
- Rents YoY
- 9.4%
- Active inventory
- 62
- Price-to-rent
- 1.9×
Monthly cashflow live
- Estimated rent
- $1,734 medium interval (Pro) →
- Mortgage (P&I)
- −$209
- Tax est. 1.5%
- −$50 /mo · $598/yr
- Insurance
- −$17
- HOA
- −$0
- Vacancy / Maint / Mgmt
- −$364
- Net cashflow
- $1,094
Break-even live
Sensitivity live
| Price | -10% $1,122 | -5% $1,108 | +0% $1,094 | +5% $1,081 | +10% $1,067 |
|---|---|---|---|---|---|
| Rent | -10% $957 | -5% $1,026 | +0% $1,094 | +5% $1,163 | +10% $1,232 |
| Rate | -1.0pp $1,115 | -0.5pp $1,105 | base $1,094 | +0.5pp $1,084 | +1.0pp $1,074 |
UW: 25.0% down · 7.5% · 30yr · 1.5% tax · 5.0% vac · 8.0% maint · 8.0% mgmt
Financing live
Cash to close
- Down payment
- $9,975
- Closing costs
- $1,197
- Reserves months
- —
- Total cash needed
- —
Loan-product check · same deal, 3 products live
Conventional
25% down · 7.5% · 30yr
- Down + closing
- —
- Monthly P&I
- —
- Monthly cashflow
- —
- DSCR
- —
- Eligible?
- —
Personal DTI + credit; lowest rate.
DSCR
20% down · 8.5% · 30yr
- Down + closing
- —
- Monthly P&I
- —
- Monthly cashflow
- —
- DSCR
- —
- Eligible?
- —
No personal income docs; deal must DSCR.
Hard money
10% down · 12.0% · 12mo
- Down + closing
- —
- Monthly P&I
- —
- Monthly cashflow
- —
- DSCR
- —
- Eligible?
- —
Short-term bridge; refi at stabilization.
Listing history 16 events
-
2026-06-21days on market $39,900 Active 100 DOM
-
2026-06-19days on market $39,900 Active 98 DOM
-
2026-06-18days on market $39,900 Active 97 DOM
-
2026-06-17days on market $39,900 Active 96 DOM
-
2026-06-16days on market $39,900 Active 95 DOM
-
2026-06-15days on market $39,900 Active 94 DOM
-
2026-06-14days on market $39,900 Active 92 DOM
-
2026-06-13days on market $39,900 Active 91 DOM
-
2026-06-09days on market $39,900 Active 88 DOM
-
2026-06-08days on market $39,900 Active 87 DOM
-
2026-06-07pricedays on market $39,900 Active 86 DOM
-
2026-06-05days on market $45,500 Active 83 DOM
-
2026-06-02days on market $45,500 Active 81 DOM
-
2026-06-01pricedays on market $45,500 Active 80 DOM
-
2026-05-31days on market $45,000 Active 79 DOM
-
2026-05-30days on market $45,000 Active 78 DOM
ⓘ Source: listings_history table (triggers on properties + properties_extension) + one-shot
backfill from property_details.listing_events for pre-trigger history.
Climate risk First Street
- Flood 1/10 Low FEMA zone X (unshaded) · 0% chance over 30 yrs
- Wildfire 3/10 Moderate
- Heat 5/10 Major 7 d/yr ≥109°F today · 16 d/yr by 30 yrs out
- Wind 2/10 Low
- Air quality 2/10 Low 1 unhealthy d/yr today · 2 by 30 yrs out
Nearby sold comps map
Loading sold comps map…
Walkable amenities ~0.75 mi
Loading nearby amenities…
Taxation est. · year 1
- Rental income
- $20,814
- − Mortgage interest
- −$2,235
- − Property taxes
- −$598
- − Insurance
- −$200
- − Repairs & maintenance
- −$1,665
- − Management
- −$1,665
- − Depreciation
- −$1,161
- Taxable income
- $13,290
- Est. tax owed @ 24.0%
- −$3,190
- After-tax cash flow
- $9,944/yr
For passive investors: Depreciation is non-cash, so a rental often shows a tax loss while cash-flowing — sheltering income. Rental losses are passive: they offset passive income freely, and up to $25,000/yr can offset ordinary (W-2) income if you actively participate and your MAGI is under $100k (phasing out to $0 by $150k); unused losses carry forward. On sale, claimed depreciation is recaptured at up to 25%, and gains may owe capital-gains tax (a 1031 exchange can defer both). Figures are a year-1 estimate at your 24.0% rate — not tax advice; consult a CPA.
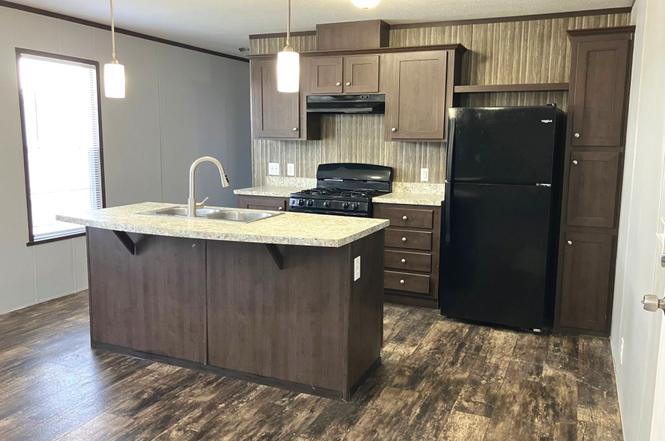
Condition & rehab AI · 10 photos
This 3-bedroom, 2-bathroom home in a family-friendly community is in good condition with modern updates. It's ready for move-in and would benefit from a fresh exterior paint job and some landscaping to enhance curb appeal.
Value-add opportunities
- Resale paint exterior — enhances curb appeal
- Resale trim landscaping — improves curb appeal
- Both update flooring — enhances interior and adds value
- Both update paint interior — enhances interior and adds value
Renovation cost estimate screening
Value-add ROI direction
- Resale paint exterior — enhances curb appeal ↑
- Resale trim landscaping — improves curb appeal ↑
- Both update flooring — enhances interior and adds value ↑
- Both update paint interior — enhances interior and adds value ↑
ⓘ Cost ranges are severity-bucket heuristics (US national rule-of-thumb). Get contractor quotes + a written scope before underwriting a rehab budget.
Schools (NCES district)
- District
- Lawrence
- NCES district ID
- 2008400
- Math proficiency
- 31% ▼ -7.00%
- Reading proficiency
- 44% ▬ 0.00%
- Median HH income
- $46,259
- Composite
- 32.02/100
- National rank
- #5826
- State rank
- #46 of 169 in KS
Livability — Lawrence
- Score
- 88/100
- State rank
- #1
- US rank
- #237
Category grades
Schools grade is shown separately in the Schools card above.
Census & demographics
- Census place
- Lawrence, KS
- County
- Douglas County · 100,966 people
- City population
- 100,966
- Metro
- Lawrence, KS
- Population (ZIP)
- 19,658
- Household income
- $65,478
- Rent vs Own
- Severe rent burden
- 1201.0
Population outlook (Douglas County) Hauer SSP2
- Today (2025)
- 136,863 people
- By 2030
- 147,255 · +7.6%
- By 2040
- 167,760 · +22.6%
- By 2050
- 190,593 · +39.3%
- By 2075
- 253,850 · +85.5%
- By 2100
- 314,741 · +130.0%
Race, ethnicity, and origin ACS 2023
- Neighborhood character
- Predominantly White (68%)
- Race & ethnicity
- White 68% Two or more races 10% Asian 9% Hispanic / Latino 7% Black 6% Native American 3%
- Hispanic origin (detail)
- Mexican 5%
- Common ancestry
- Slovak 3% Iranian 3% Italian 2%
- Foreign-born
- 11% · China, Canada, Vietnam
- Languages at home
- 85% English-only · Chinese 4% Spanish 3% Other Asian/Pacific 2%
Political lean MEDSL · Douglas
- 2024 margin
- Solid D (+38.0) · D 68.2% · R 30.2% · Other 1.6%
- 2008→2024 swing
- +7.2pp toward D · 2008: 30.8pp · 2024: 38.0pp
- All cycles
- 2024: D+38.0 2020: D+39.5 2016: D+32.7 2012: D+23.7 2008: D+30.8
Not yet ingested
- Civics
- —
Market trends
- HPI YoY
- ▼ -246.73%
- Current HPI
- 236.534
- Rent YoY
- ▲ 9.36%
- Metro
- Lawrence, KS
- State GDP YoY
- —
- F500 in state
- 0
Cash-flow waterfall
monthlySold comps — $/sqft
last 12 mo · ≤1 miLoading sold comps…