 🏷️ Likely Rental
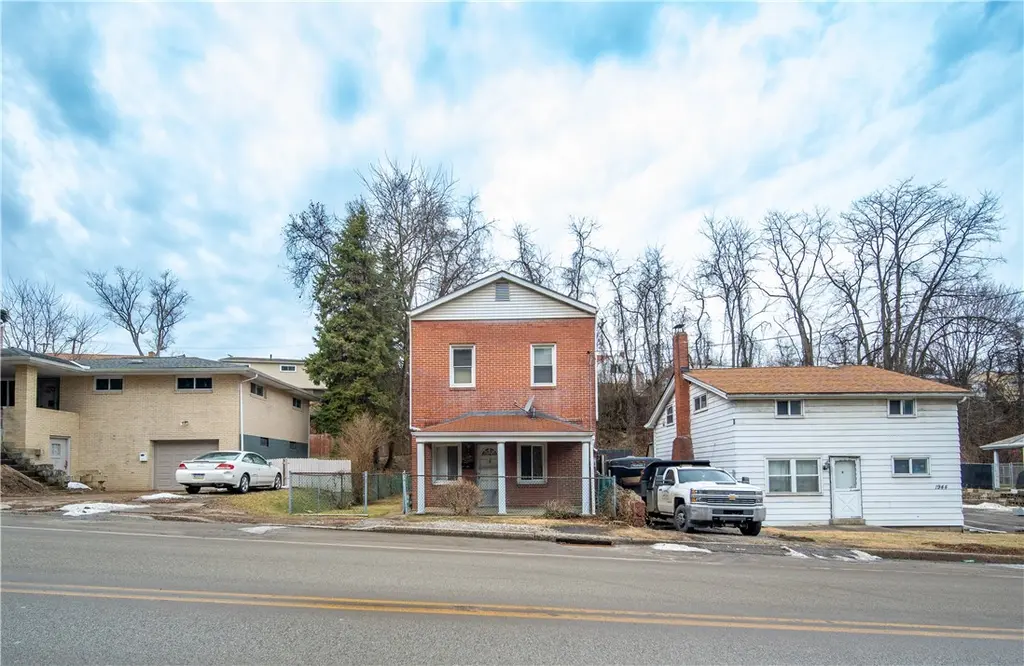
1950 Homestead Duquesne Rd · West Mifflin, PA
Flood risk 9/10 · Severe
- FEMA flood zone
- X (unshaded)
- Chance of flooding over 30 yrs
- 0.99%
- Est. flood insurance / yr
- $473 – $860
Fire risk 1/10 · Minimal
- Est. fire insurance / yr
- $511 – $949
Heat risk 4/10 · Minor
- Hot days now (above 97°F)
- 7 days/yr
- Hot days in 30 yrs
- 18 days/yr
Wind risk 2/10 · Minimal
- Chance of severe wind over 30 yrs
- —
Air-quality risk 4/10 · Minor
- Unhealthy air days now
- 4 days/yr
- Unhealthy air days in 30 yrs
- 5 days/yr
Risk factors via First Street. Map © Google.
Why this score? — see what drove the C grade
The composite is a weighted blend of 9 inputs, each scored 0–100. Each bar is that input's sub-score; the figure is the points it added to the 100-point composite (weight × sub-score).
- Cash flow +20.4/30.0
- ARV discount +15.0/15.0
- DSCR +6.5/10.0
- 1% rule +5.2/10.0
- Livability +3.7/5.0
- Schools +2.6/10.0
- Rent growth +2.5/5.0
- Condition / age +2.5/5.0
- Appreciation +0.0/10.0
$129,000
🖨 Deal sheet (PDF) 📄 Offer letter ✓ Due diligence
Listing remarks MLS
PROPERTY BEING SOLD IN "AS IS CONDITION" Separately or AS PORTFOLIO or bundle a group. SERIOUS INQUIRIES ONLY. WILL NEED A 5 DAY NOTICE TO VIEW DUE TO TENANT OCCUPANCY, PLEASE DRIVE BY TO VIEW. PLEASE SEE ATTACHED MLS #s 1740802, 1740806, 1740810, 1740811, 1740813, 1740814, 1740916, 1740929, 1740934, 1740939, 1741723 1741727, 1741729, 1741731, 1744133
Key facts
- Garage
- Built 1931
- Listed 116 days
Neighborhood map
What this means for you Summary
Snapshot
- This is a 2-bed/1.5-bath single-family listed at $129k.
Deal economics
- At list price, monthly cash flow is $111 ($1k/yr) — positive.
- The deal already cash-flows at list — no discount required.
- Meets the 1% rule at list price ($1k rent vs $129k).
- Recommended offer: $117k (9.0% below list) — sets the bar for market timing.
- Cap rate 7.8% vs local median 5.2% in West Mifflin — top-decile yield for the area; either an underpriced asset or a hidden risk that comps aren't pricing in. Stress-test before assuming the spread holds.
Location & tenants
- Location reads 73/100 on livability (#539 in PA) — a middle-class / working-renter tenant base. Strengths: cost of living A+, housing A+, schools B+; Watch: health & safety D, crime D-, amenities F.
- West Mifflin Area SD (suburban): math 19% / reading 41% proficiency, ranked #443 of 539 in PA (top 82%) — families likely to look elsewhere, expect single-tenant / working-renter base with shorter leases.
- Market conditions: 60 active listings in the ZIP; 14 comparable units currently listed for rent nearby; rentals at typical pace (median 25d on market — plan ~3-4 weeks tenant-placement turnaround); 43% of comp listings sitting > 30 days — soft ceiling on asking rent; 2,996 units permitted in Allegheny County in 2024 (1,588 in 5+ unit buildings).
Forward outlook
- Local home prices are declining (-3.0%/yr); year-one equity from $892 of loan paydown is wiped out by about $4k of value loss. Plan a longer hold.
Negotiation context
- It's been on market 117 days — a 9% lower offer ($117k) is reasonable based on typical stale-listing flexibility.
- 2 sale attempts with the ask held roughly flat each time — persistent listings suggest the price (not the market) is what's stuck; bring a comps-based counter.
- Current owner paid $12k; list at $129k implies a 975% gain — meaningful room to come down on a strong offer.
Risks & watch-outs
- Watch-outs: flood insurance adds $56/mo; built in 1931 — expect roof / HVAC / electrical / plumbing capex.
- Climate carrying-cost: severe flood risk — expect insurance premiums to compound above CPI over the hold.
Questions for the listing agent
- It's been on market 117 days. Have you received any prior offers? Is the seller open to a 9% concession, seller financing, or rate buy-down credit?
- Built in 1931 — when were the roof, HVAC, electrical panel, plumbing, and water heater last replaced?
- What's the actual annual flood-insurance premium (NFIP or private), and is the property in a SFHA with mandatory coverage?
- Why hasn't it sold? Are there any deal-killer items the seller is aware of (foundation, flood, title, zoning, code violations)?
- Is there a deadline driving the sale (1031 exchange, divorce, estate, relocation)? That informs how much negotiation room exists.
- Schools are B-rated — typically a magnet for longer-tenancy family renters. What's the average tenant stay here, and is there a school-zone premium baked into asking?
- Crime grade is D in this area — have there been break-ins, vandalism, or insurance claims at this property in the last 3 years? What carrier currently insures it and at what premium?
- What's the average days-on-market for RENTAL listings here right now (not sales)? A rising rental-DOM trend means longer vacancies and softer asking-rent achievability than the comps imply.
- What's the recent tenant-quality profile in this submarket — average credit score on applications, eviction rate, late-payment / NSF rate, and stable-employment percentage? A property-management company in the area should have these aggregated.
- How much new for-sale + rental construction is in the pipeline within 1–3 miles? Heavy new supply typically softens prices + rents 12–24 months out; constrained supply supports both.
Investment metrics
- 1% rule
- 1.02% ✓
- Cap rate
- 7.85%
- Cash-on-cash
- 5.55%
- DSCR
- 1.25
- GRM
- 8.1
CMA / ARV
- ARV (median comp)
- $168,230
- List price
- $129,000
- Delta
- -23.32%
- Verdict
- UNDERPRICED
- Comps
- 20 within 1.0 mi
Show comp detail 12 sales within ~0.75 mi
| Address | Dist | Beds/Ba | Sqft | Sold | Price | $/sf | Match |
|---|---|---|---|---|---|---|---|
| 2002 Vermont Ave | 0.11mi | 2/1.0 | 1,056 (-6%) | 2mo | $155,000 | $147 | 81 |
| 1808 Vermont Ave | 0.23mi | 3/2.0 (+1) | 1,074 (-4%) | 8mo | $230,000 | $214 | 68 |
| 1705 Texas Ave | 0.37mi | 2/1.0 | 1,053 (-6%) | 4mo | $31,900 | $30 | 67 |
| 2123 Worton Blvd | 0.22mi | 3/1.0 (+1) | 1,233 (+10%) | 2mo | $130,000 | $105 | 65 |
| 432 Grandview Ave | 0.46mi | 3/2.0 (+1) | 1,078 (-4%) | 2mo | $56,000 | $52 | 64 |
| 2234 Vermont Ave | 0.39mi | 3/1.5 (+1) | 1,027 (-8%) | 0mo | $137,000 | $133 | 63 |
| 2206 Conlin St | 0.32mi | 3/2.0 (+1) | 1,224 (+9%) | 6mo | $180,000 | $147 | 58 |
| 1314 Crawford Ave | 0.65mi | 2/1.0 | 1,092 (-2%) | 7mo | $23,000 | $21 | 58 |
| 2725 Glenny Ln | 0.73mi | 3/1.5 (+1) | 1,125 (+0%) | 8mo | $205,900 | $183 | 54 |
| 424 Grandview Ave | 0.44mi | 3/1.0 (+1) | 1,008 (-10%) | 4mo | $132,500 | $131 | 52 |
| 1406 Maryland Ave | 0.62mi | 2/1.5 | 962 (-14%) | 5mo | $90,000 | $94 | 44 |
| 2534 Jefferson Ave | 0.51mi | 3/2.0 (+1) | 1,242 (+11%) | 10mo | $152,500 | $123 | 42 |
Match score weights: distance 35% · size 25% · config 20% · recency 20%. Top-matched comps best support the ARV.
Projected returns pro-forma
-3.0% appreciation · 3.0% rent growth · sell at horizon
- IRR
- -10.5%
- Equity multiple
- 0.62×
- Total profit
- $-13,762
- Equity at exit
- $19,234
- IRR
- -1.1%
- Equity multiple
- 0.93×
- Total profit
- $-2,664
- Equity at exit
- $11,154
Cash invested: $36,120 (down + closing). Projections, not guarantees.
Landlord ↔ Tenant lean methodology
- Overall (STATE)
- 62 Landlord-Friendly
- State Pennsylvania
- 62 Landlord-Friendly · EVEN
- County
- — inherits STATE
- City
- — inherits STATE
ZIP-level market 15122
- Home prices YoY
- -30.4%
- Active inventory
- 60
- Price-to-rent
- 8.1×
Monthly cashflow live
- Estimated rent
- $1,320 high interval (Pro) →
- Mortgage (P&I)
- −$676
- Tax from tax record
- −$146 /mo · $1,751/yr
- Insurance
- −$54
- Flood insurance flood zone
- −$56 /mo · $666/yr
- HOA
- −$0
- Vacancy / Maint / Mgmt
- −$277
- Net cashflow
- $111
Break-even live
Sensitivity live
| Price | -10% $184 | -5% $148 | +0% $111 | +5% $75 | +10% $38 |
|---|---|---|---|---|---|
| Rent | -10% $7 | -5% $59 | +0% $111 | +5% $164 | +10% $216 |
| Rate | -1.0pp $176 | -0.5pp $144 | base $111 | +0.5pp $78 | +1.0pp $44 |
UW: 25.0% down · 7.5% · 30yr · 1.5% tax · 5.0% vac · 8.0% maint · 8.0% mgmt
Financing live
Cash to close
- Down payment
- $32,250
- Closing costs
- $3,870
- Reserves months
- —
- Total cash needed
- —
Loan-product check · same deal, 3 products live
Conventional
25% down · 7.5% · 30yr
- Down + closing
- —
- Monthly P&I
- —
- Monthly cashflow
- —
- DSCR
- —
- Eligible?
- —
Personal DTI + credit; lowest rate.
DSCR
20% down · 8.5% · 30yr
- Down + closing
- —
- Monthly P&I
- —
- Monthly cashflow
- —
- DSCR
- —
- Eligible?
- —
No personal income docs; deal must DSCR.
Hard money
10% down · 12.0% · 12mo
- Down + closing
- —
- Monthly P&I
- —
- Monthly cashflow
- —
- DSCR
- —
- Eligible?
- —
Short-term bridge; refi at stabilization.
Rent comps 14 comps
| Address | Beds | Baths | Sqft | Rent | $/sqft | DOM | Units | Dist |
|---|---|---|---|---|---|---|---|---|
| 1704 Anna Ave West Mifflin, PA | 2.0 | 1.5 | 1160 | $1,395 | $1.20 | 25d | 1 | 0.15mi |
| 1744 Highland Ave West Mifflin, PA | 2.0 | 1.0 | 1100 | $1,549 | $1.41 | 5d | 1 | 0.34mi |
| 715 Grant Avenue Ext West Mifflin, PA | 3.0 | 2.0 | 1400 | $1,450 | $1.04 | 9d | 1 | 0.54mi |
| 1318 Maryland Ave West Mifflin, PA | 3.0 | 1.0 | 1408 | $1,695 | $1.20 | 45d | 1 | 0.67mi |
| 3101 Homestead Duquesne Rd West Mifflin, PA | 2.0 | 1.0 | 924 | $900 | $0.97 | 45d | 1 | 0.68mi |
| 1010 Savey St Duquesne, PA | 2.0 | 1.0 | 1000 | $1,200 | $1.20 | 45d | 1 | 0.76mi |
| 1133 Maryland Ave Unit 3 Duquesne, PA | 1.0 | 1.0 | 750 | $1,150 | $1.53 | 16d | 1 | 0.76mi |
| 827 Hinnerman St Duquesne, PA | 3.0 | 1.0 | 1136 | $1,250 | $1.10 | 25d | 1 | 0.82mi |
| 207 Auriles St Duquesne, PA | 2.0 | 1.0 | 950 | $950 | $1.00 | 45d | 1 | 0.90mi |
| 201 S 4th St Duquesne, PA | 3.0 | 1.0 | 1200 | $1,385 | $1.15 | 45d | 1 | 1.08mi |
| 604 Shaw Ave Unit 102 McKeesport, PA | 1.0 | 1.0 | 750 | $750 | $1.00 | 45d | 1 | 1.15mi |
| 604 Shaw Ave Unit 101 McKeesport, PA | 2.0 | 1.5 | 1050 | $900 | $0.86 | 16d | 1 | 1.15mi |
| 604 Shaw Ave McKeesport, PA | 2.0 | 1.0–1.5 | 800 | $900 | $1.12 | 13d | 3 | 1.15mi |
| 800 Richford St Duquesne, PA | 3.0 | 1.0 | 1300 | $1,600 | $1.23 | 25d | 1 | 1.23mi |
Listing history 18 events
-
2026-06-21days on market $129,000 Active 117 DOM
-
2026-06-18days on market $129,000 Active 114 DOM
-
2026-06-17days on market $129,000 Active 113 DOM
-
2026-06-16days on market $129,000 Active 112 DOM
-
2026-06-15days on market $129,000 Active 111 DOM
-
2026-06-13days on market $129,000 Active 109 DOM
-
2026-06-09days on market $129,000 Active 105 DOM
-
2026-06-08days on market $129,000 Active 104 DOM
-
2026-06-07days on market $129,000 Active 103 DOM
-
2026-06-03days on market $129,000 Active 99 DOM
-
2026-06-02days on market $129,000 Active 98 DOM
-
2026-06-01days on market $129,000 Active 97 DOM
-
2026-05-31days on market $129,000 Active 96 DOM
-
2026-05-19price $129,000 364-char remark
Show marketing remark (364 chars)
PROPERTY BEING SOLD IN "AS IS CONDITION" Separately or AS PORTFOLIO or bundle a group. SERIOUS INQUIRIES ONLY. WILL NEED A 5 DAY NOTICE TO VIEW DUE TO TENANT OCCUPANCY, PLEASE DRIVE BY TO VIEW. PLEASE SEE ATTACHED MLS #s 1740802, 1740806, 1740810, 1740811, 1740813, 1740814, 1740916, 1740929, 1740934, 1740939, 1741723 1741727, 1741729, 1741731, 1744133
-
2026-05-11status Active 364-char remark
Show marketing remark (364 chars)
PROPERTY BEING SOLD IN "AS IS CONDITION" Separately or AS PORTFOLIO or bundle a group. SERIOUS INQUIRIES ONLY. WILL NEED A 5 DAY NOTICE TO VIEW DUE TO TENANT OCCUPANCY, PLEASE DRIVE BY TO VIEW. PLEASE SEE ATTACHED MLS #s 1740802, 1740806, 1740810, 1740811, 1740813, 1740814, 1740916, 1740929, 1740934, 1740939, 1741723 1741727, 1741729, 1741731, 1744133
-
2026-04-06historical Contingent 364-char remark
Show marketing remark (364 chars)
PROPERTY BEING SOLD IN "AS IS CONDITION" Separately or AS PORTFOLIO or bundle a group. SERIOUS INQUIRIES ONLY. WILL NEED A 5 DAY NOTICE TO VIEW DUE TO TENANT OCCUPANCY, PLEASE DRIVE BY TO VIEW. PLEASE SEE ATTACHED MLS #s 1740802, 1740806, 1740810, 1740811, 1740813, 1740814, 1740916, 1740929, 1740934, 1740939, 1741723 1741727, 1741729, 1741731, 1744133
-
2026-02-23$130,000 Active 364-char remark
Show marketing remark (364 chars)
PROPERTY BEING SOLD IN "AS IS CONDITION" Separately or AS PORTFOLIO or bundle a group. SERIOUS INQUIRIES ONLY. WILL NEED A 5 DAY NOTICE TO VIEW DUE TO TENANT OCCUPANCY, PLEASE DRIVE BY TO VIEW. PLEASE SEE ATTACHED MLS #s 1740802, 1740806, 1740810, 1740811, 1740813, 1740814, 1740916, 1740929, 1740934, 1740939, 1741723 1741727, 1741729, 1741731, 1744133
-
2016-03-08soldstatus $12,000
ⓘ Source: listings_history table (triggers on properties + properties_extension) + one-shot
backfill from property_details.listing_events for pre-trigger history.
Tax reassessment forecast PA · Partial reset (capped growth)
- Current annual tax
- $1,751 · $146/mo
- Projected year-2 tax
- $1,894 · $158/mo
- Expected delta
- +$144/yr (+$12/mo · 8.2%)
ⓘ Screening estimate from a state-policy table — verify with the county assessor before closing.
Climate risk First Street
- Flood 9/10 Extreme FEMA zone X (unshaded) · 99% chance over 30 yrs
- Wildfire 1/10 Low
- Heat 4/10 Moderate 7 d/yr ≥97°F today · 18 d/yr by 30 yrs out
- Wind 2/10 Low
- Air quality 4/10 Moderate 4 unhealthy d/yr today · 5 by 30 yrs out
Nearby sold comps map
Loading sold comps map…
Walkable amenities ~0.75 mi
Loading nearby amenities…
Taxation est. · year 1
- Rental income
- $15,845
- − Mortgage interest
- −$7,226
- − Property taxes
- −$1,751
- − Insurance
- −$1,312
- − Repairs & maintenance
- −$1,268
- − Management
- −$1,268
- − Depreciation
- −$3,753
- Taxable loss
- −$731
- Est. tax savings @ 24.0%
- +$176
- After-tax cash flow
- $1,513/yr
For passive investors: Depreciation is non-cash, so a rental often shows a tax loss while cash-flowing — sheltering income. Rental losses are passive: they offset passive income freely, and up to $25,000/yr can offset ordinary (W-2) income if you actively participate and your MAGI is under $100k (phasing out to $0 by $150k); unused losses carry forward. On sale, claimed depreciation is recaptured at up to 25%, and gains may owe capital-gains tax (a 1031 exchange can defer both). Figures are a year-1 estimate at your 24.0% rate — not tax advice; consult a CPA.
Schools (NCES district)
- District
- West Mifflin Area SD
- NCES district ID
- 4225680
- Math proficiency
- 19% ▼ -19.00%
- Reading proficiency
- 41% ▼ -14.00%
- Median HH income
- $46,532
- Composite
- 25.78/100
- National rank
- #7371
- State rank
- #443 of 539 in PA
Livability — West Mifflin
- Score
- 73/100
- State rank
- #539
- US rank
- #5042
Category grades
Schools grade is shown separately in the Schools card above.
Census & demographics
- Census place
- West Mifflin, PA
- County
- Allegheny County · 1,022,028 people
- City population
- 18,816
- Metro
- Pittsburgh, PA
- Population (ZIP)
- 18,816
- Household income
- $72,485
- Rent vs Own
- Severe rent burden
- 334.0
Population outlook (Allegheny County) Hauer SSP2
- Today (2025)
- 1,250,282 people
- By 2030
- 1,256,482 · +0.5%
- By 2040
- 1,256,318 · +0.5%
- By 2050
- 1,244,169 · -0.5%
- By 2075
- 1,197,693 · -4.2%
- By 2100
- 1,093,187 · -12.6%
Race, ethnicity, and origin ACS 2023
- Neighborhood character
- Predominantly White (81%)
- Race & ethnicity
- White 81% Black 9% Two or more races 7% Hispanic / Latino 2% Asian 1%
- Common ancestry
- Romanian 9% Slovak 1% Scotch-Irish 1%
- Foreign-born
- 1% · South Korea
- Languages at home
- 93% English-only · Spanish 4% Other Indo-European 1%
Political lean MEDSL · Allegheny
- 2024 margin
- Strong D (+20.3) · D 59.7% · R 39.4%
- 2008→2024 swing
- +4.8pp toward D · 2008: 15.5pp · 2024: 20.3pp
- All cycles
- 2024: D+20.3 2020: D+20.4 2016: D+16.4 2012: D+14.4 2008: D+15.5
Not yet ingested
- Civics
- —
Market trends
- HPI YoY
- ▼ -107.69%
- Current HPI
- 246.2486
- Rent YoY
- —
- Metro
- Pittsburgh, PA
- State GDP YoY
- ▲ 1.68%
- F500 in state
- 34
Industry mix (Fortune 500 HQ in PA)
| Industry | F500 HQs | Revenue |
|---|---|---|
| Healthcare | 2 | $309B |
|
||
| Insurance | 2 | $27B |
|
||
| Telecommunications / Media | 1 | $124B |
|
||
| Industrial Distribution | 1 | $22B |
|
||
| Financial Services | 1 | $20B |
|
||
| Chemicals / Materials | 1 | $18B |
|
||
Price history
+975.0% since first listed5 events — show timeline
- 2026-05-19 Price Changed $129,000 West Penn MLS
- 2026-05-11 Relisted — West Penn MLS
- 2026-04-06 Contingent — West Penn MLS
- 2026-02-23 Listed $130,000 West Penn MLS
- 2016-03-08 Sold (Public Records) $12,000 Public Records
Property tax history
+6.6%/yrLatest (2026): $1,751 · +3.9% YoY. Source: county tax records.
Cash-flow waterfall
monthlySold comps — $/sqft
last 12 mo · ≤1 miLoading sold comps…