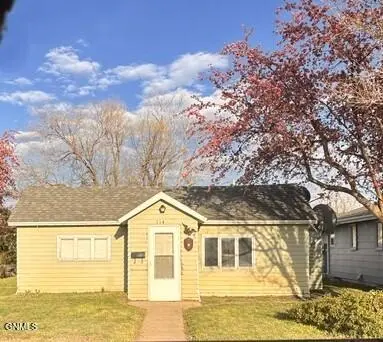
114 Adams St · Plentywood, MT
Flood risk 1/10 · Minimal
- FEMA flood zone
- —
- Chance of flooding over 30 yrs
- 0.0%
- Est. flood insurance / yr
- —
Fire risk 5/10 · Moderate
- Est. fire insurance / yr
- $918 – $1,706
Heat risk 2/10 · Minimal
- Hot days now (above 96°F)
- 7 days/yr
- Hot days in 30 yrs
- 13 days/yr
Wind risk 1/10 · Minimal
- Chance of severe wind over 30 yrs
- —
Air-quality risk 5/10 · Moderate
- Unhealthy air days now
- 6 days/yr
- Unhealthy air days in 30 yrs
- 7 days/yr
Risk factors via First Street. Map © Google.
Why this score? — see what drove the B+ grade
The composite is a weighted blend of 9 inputs, each scored 0–100. Each bar is that input's sub-score; the figure is the points it added to the 100-point composite (weight × sub-score).
- Cash flow +30.0/30.0
- 1% rule +10.0/10.0
- DSCR +10.0/10.0
- ARV discount +7.5/15.0
- Appreciation +6.9/10.0
- Livability +3.8/5.0
- Schools +3.7/10.0
- Rent growth +2.5/5.0
- Condition / age +2.5/5.0
$30,000
🖨 Deal sheet 📄 Offer letter ✓ Due diligence
Key facts
- 7 year old roof
- Recent furnace
- 7,013 sq ft lot
Tags
Property features AI
Exterior
- Parking: No garage
- Utilities: Public water; Public sewer; Propane available; Electricity connected; Phone available; Water connected; Sewer connected
- Home design: Single-family residence; One story
- Construction: Metal siding; Built with foundation and one-level construction
- Exterior features: Private yard; Shed(s); Shingle roof; Level, rectangular lot; Paved city street with public maintenance
Interior
- Kitchen: Electric range; Refrigerator
- Flooring: Carpet; Linoleum
- Bathrooms: 1 full bathroom
- Heating & cooling: Forced air heating (propane); Wall/window cooling units
- Interior features: Dryer; Electric range; Refrigerator; Has basement with dirt floor and interior entry
- Laundry & utility: Dryer
Neighborhood map
What this means for you Summary
Snapshot
- This is a 2-bed/1.0-bath single-family listed at $30k.
Deal economics
- At list price, monthly cash flow is $485 ($6k/yr) — positive.
- The deal already cash-flows at list — no discount required.
- Meets the 1% rule at list price ($857 rent vs $30k).
Location & tenants
- Location reads 76/100 on livability (#27 in MT, #3,371 nationally) — a middle-class / working-renter tenant base. Strengths: crime A+, cost of living A+, health & safety A+; Watch: amenities F, commute F.
- Plentywood K-12 Schools (rural): math 35% / reading 45% proficiency, ranked #142 of 339 in MT (top 42%) — families likely to look elsewhere, expect single-tenant / working-renter base with shorter leases.
- Market conditions: 18 active listings in the ZIP; 5 units permitted in Sheridan County in 2024 (0 in 5+ unit buildings).
Forward outlook
- In year one you build about $1k of equity ($207 loan paydown + $1k appreciation (3.9% local appreciation)).
- Sheridan County population projected at +62% by 2050 — long-run rental-demand tailwind backs the buy-and-hold thesis.
- At projected returns (3.9% appreciation + 3.0% rent growth), your $8k cash investment doubles in ~2 years — after that, you're playing with house money.
Negotiation context
- Only 7 days on market — expect competitive offers; lowballing is unlikely to land.
Risks & watch-outs
- Watch-outs: built in 1910 — expect roof / HVAC / electrical / plumbing capex.
- Climate carrying-cost: moderate wildfire risk — expect insurance premiums to compound above CPI over the hold.
Questions for the listing agent
- Built in 1910 — when were the roof, HVAC, electrical panel, plumbing, and water heater last replaced?
- Is there a deadline driving the sale (1031 exchange, divorce, estate, relocation)? That informs how much negotiation room exists.
- What's the average days-on-market for RENTAL listings here right now (not sales)? A rising rental-DOM trend means longer vacancies and softer asking-rent achievability than the comps imply.
- What's the recent tenant-quality profile in this submarket — average credit score on applications, eviction rate, late-payment / NSF rate, and stable-employment percentage? A property-management company in the area should have these aggregated.
- How much new for-sale + rental construction is in the pipeline within 1–3 miles? Heavy new supply typically softens prices + rents 12–24 months out; constrained supply supports both.
Investment metrics
- 1% rule
- 2.86% ✓
- Cap rate
- 25.71%
- Cash-on-cash
- 69.35%
- DSCR
- 4.09
- GRM
- 2.9
CMA / ARV
- ARV (on-the-fly)
- $86,469
- Comps found
- 1
Show comp detail 1 sale within ~0.75 mi
| Address | Dist | Beds/Ba | Sqft | Sold | Price | $/sf | Match |
|---|---|---|---|---|---|---|---|
| 209 Chestnut St | 0.22mi | 1/1.0 (-1) | 612 (-13%) | 15mo | $75,000 | $123 | 50 |
Match score weights: distance 35% · size 25% · config 20% · recency 20%. Top-matched comps best support the ARV.
Projected returns pro-forma
3.88% appreciation · 3.0% rent growth · sell at horizon
- IRR
- 74.8%
- Equity multiple
- 5.28×
- Total profit
- $35,961
- Equity at exit
- $15,005
- IRR
- 73.6%
- Equity multiple
- 10.88×
- Total profit
- $82,998
- Equity at exit
- $24,378
Cash invested: $8,400 (down + closing). Projections, not guarantees.
Landlord ↔ Tenant lean methodology
- Overall (STATE)
- 82 Strongly Landlord-Friendly
- State Montana
- 82 Strongly Landlord-Friendly · R+11
- County
- — inherits STATE
- City
- — inherits STATE
ZIP-level market 59254
- Home prices YoY
- 2.2%
- Active inventory
- 18
- Price-to-rent
- 2.9×
Monthly cashflow live
- Estimated rent
- $857 medium interval (Pro) →
- Mortgage (P&I)
- −$157
- Tax from tax record
- −$22 /mo · $259/yr
- Insurance
- −$12
- HOA
- −$0
- Vacancy / Maint / Mgmt
- −$180
- Net cashflow
- $485
Break-even live
UW: 25.0% down · 7.5% · 30yr · 1.5% tax · 5.0% vac · 8.0% maint · 8.0% mgmt
Financing live
Cash to close
- Down payment
- $7,500
- Closing costs
- $900
- Reserves months
- —
- Total cash needed
- —
Loan-product check · same deal, 3 products live
Conventional
25% down · 7.5% · 30yr
- Down + closing
- —
- Monthly P&I
- —
- Monthly cashflow
- —
- DSCR
- —
- Eligible?
- —
Personal DTI + credit; lowest rate.
DSCR
20% down · 8.5% · 30yr
- Down + closing
- —
- Monthly P&I
- —
- Monthly cashflow
- —
- DSCR
- —
- Eligible?
- —
No personal income docs; deal must DSCR.
Hard money
10% down · 12.0% · 12mo
- Down + closing
- —
- Monthly P&I
- —
- Monthly cashflow
- —
- DSCR
- —
- Eligible?
- —
Short-term bridge; refi at stabilization.
Listing history 9 events
-
2026-06-07status $30,000 Pending 7 DOM
-
2026-06-05days on market $30,000 Active 7 DOM
-
2026-06-04days on market $30,000 Active 5 DOM
-
2026-06-02days on market $30,000 Active 4 DOM
-
2026-06-01days on market $30,000 Active 3 DOM
-
2026-05-31days on market $30,000 Active 2 DOM
-
2026-05-25$30,000 Active
-
2001-07-13soldstatus
-
2001-07-13soldstatus
ⓘ Source: listings_history table (triggers on properties + properties_extension) + one-shot
backfill from property_details.listing_events for pre-trigger history.
Tax reassessment forecast MT · Resets to sale price
- Current annual tax
- $259 · $22/mo
- Projected year-2 tax
- $259 · $22/mo
- Expected delta
- $0/yr ($0/mo · 0.0%)
ⓘ Screening estimate from a state-policy table — verify with the county assessor before closing.
Climate risk First Street
- Flood 1/10 Low 0% chance over 30 yrs
- Wildfire 5/10 Major
- Heat 2/10 Low 7 d/yr ≥96°F today · 13 d/yr by 30 yrs out
- Wind 1/10 Low
- Air quality 5/10 Major 6 unhealthy d/yr today · 7 by 30 yrs out
Nearby sold comps map
Loading sold comps map…
Walkable amenities ~0.75 mi
Loading nearby amenities…
Taxation est. · year 1
- Rental income
- $10,282
- − Mortgage interest
- −$1,680
- − Property taxes
- −$259
- − Insurance
- −$150
- − Repairs & maintenance
- −$823
- − Management
- −$823
- − Depreciation
- −$873
- Taxable income
- $5,674
- Est. tax owed @ 24.0%
- −$1,362
- After-tax cash flow
- $4,464/yr
For passive investors: Depreciation is non-cash, so a rental often shows a tax loss while cash-flowing — sheltering income. Rental losses are passive: they offset passive income freely, and up to $25,000/yr can offset ordinary (W-2) income if you actively participate and your MAGI is under $100k (phasing out to $0 by $150k); unused losses carry forward. On sale, claimed depreciation is recaptured at up to 25%, and gains may owe capital-gains tax (a 1031 exchange can defer both). Figures are a year-1 estimate at your 24.0% rate — not tax advice; consult a CPA.
Schools (NCES district)
- District
- Plentywood K-12 Schools
- NCES district ID
- 3020960
- Math proficiency
- 35% ▲ 5.00%
- Reading proficiency
- 45% ▬ 0.00%
- Median HH income
- $46,145
- Composite
- 36.53/100
- National rank
- #9299
- State rank
- #142 of 339 in MT
Livability — Plentywood
- Score
- 76/100
- State rank
- #27
- US rank
- #3371
Category grades
Schools grade is shown separately in the Schools card above.
Census & demographics
- Census place
- Plentywood, MT
- Population (ZIP)
- 1,845
Population outlook (Sheridan County) Hauer SSP2
- Today (2025)
- 4,481 people
- By 2030
- 4,951 · +10.5%
- By 2040
- 6,013 · +34.2%
- By 2050
- 7,266 · +62.2%
- By 2075
- 10,842 · +142.0%
- By 2100
- 13,272 · +196.2%
Race, ethnicity, and origin ACS 2023
- Neighborhood character
- Predominantly White (89%)
- Race & ethnicity
- White 89% Two or more races 6% Hispanic / Latino 4% Native American 2%
- Common ancestry
- Portuguese 13% Scottish 5% Italian 4%
- Foreign-born
- 3% · Canada
- Languages at home
- 99% English-only · Other Asian/Pacific 1%
Political lean MEDSL · Sheridan
- 2024 margin
- Solid R (+42.5) · D 26.6% · R 69.1% · Other 4.3%
- 2008→2024 swing
- -40.8pp toward R · 2008: -1.7pp · 2024: -42.5pp
- All cycles
- 2024: R+42.5 2020: R+40.8 2016: R+41.7 2012: R+28.2 2008: R+1.7
Not yet ingested
- Civics
- —
Market trends
- HPI YoY
- ▲ 3.88%
- Current HPI
- 177.4482
- Rent YoY
- —
- Metro
- —
- State GDP YoY
- ▲ 3.41%
- F500 in state
- 2
Industry mix (Fortune 500 HQ in MT)
| Industry | F500 HQs | Revenue |
|---|---|---|
| Technology / Analytics | 1 | $2B |
|
||
Price history
3 events — show timeline
- 2026-05-25 Listed $30,000 GNMLS
- 2001-07-13 Sold (Public Records) — Public Records
- 2001-07-13 Sold (Public Records) — Public Records
Property tax history
+8.1%/yrLatest (2025): $259 · -4.9% YoY. Source: county tax records.
Cash-flow waterfall
monthlySold comps — $/sqft
last 12 mo · ≤1 miLoading sold comps…