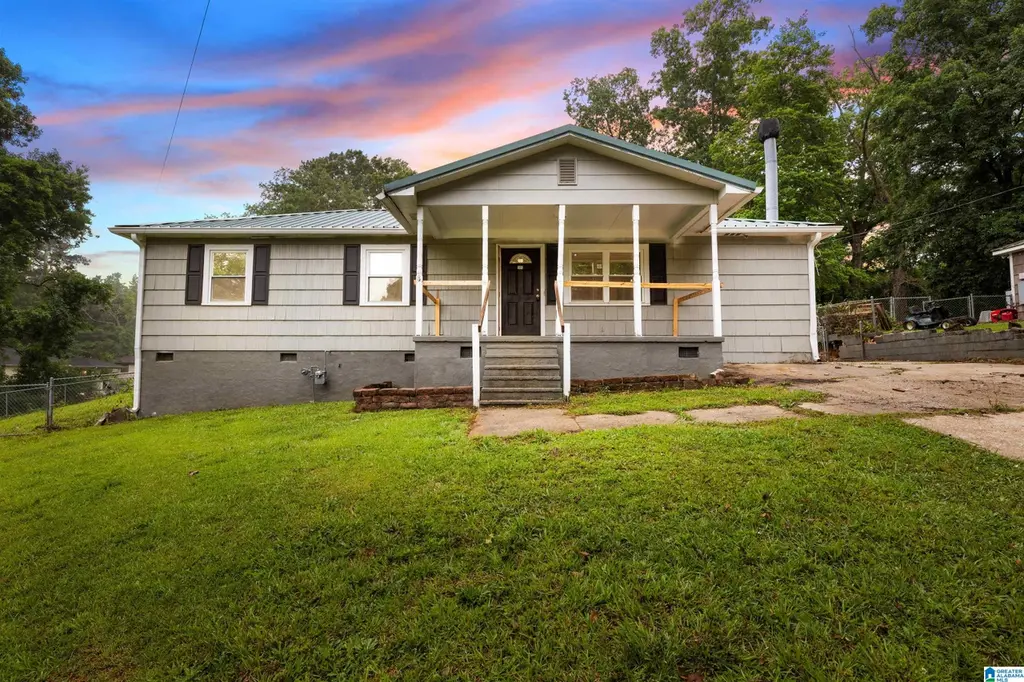
2228 NE 17th St · Center Point, AL
Flood risk No data
- FEMA flood zone
- —
- Chance of flooding over 30 yrs
- —
- Est. flood insurance / yr
- —
Fire risk No data
- Est. fire insurance / yr
- —
Heat risk No data
- Hot days now (above threshold)
- —
- Hot days in 30 yrs
- —
Wind risk No data
- Chance of severe wind over 30 yrs
- —
Air-quality risk No data
- Unhealthy air days now
- —
- Unhealthy air days in 30 yrs
- —
Risk factors via First Street. Map © Google.
Why this score? — see what drove the C+ grade
The composite is a weighted blend of 9 inputs, each scored 0–100. Each bar is that input's sub-score; the figure is the points it added to the 100-point composite (weight × sub-score).
- Cash flow +24.6/30.0
- ARV discount +15.0/15.0
- DSCR +7.9/10.0
- 1% rule +6.4/10.0
- Rent growth +3.3/5.0
- Livability +3.2/5.0
- Condition / age +2.2/5.0
- Schools +1.8/10.0
- Appreciation +0.0/10.0
$115,000
🖨 Deal sheet 📄 Offer letter ✓ Due diligence
Listing remarks
3/2 with 3 car garage/workshop
Key facts
- 0.45 acre lot
- 3 garage spots
- Built 1956
Property features AI
Finance
- Other: Lot size approximately 0.45 acres; Subdivision: CENTERWOOD
Exterior
- Parking: Attached and detached garage options with rear garage entry; Driveway parking; Parking on main level; Three garage spaces
- Utilities: Public water; Septic system; Electric water heater; Internet service available
- Home design: Single-family existing home; Not a tri-level, split-level, or split-foyer
- Construction: Wood construction; Crawl space foundation
- Exterior features: Open deck; No pool; No patio; No garden/patio; Not waterfront
Interior
- Kitchen: Kitchen on main level
- Bedrooms: Master bedroom on main level; Two additional bedrooms on main level
- Flooring: Carpet; Hardwood
- Bathrooms: Two full bathrooms; Master bath with separate shower and garden tub; Shared bath
- Heating & cooling: Central heating; Central cooling
- Interior features: Carpet and hardwood floors; Ceilings: see remarks; No additional interior features listed
- Laundry & utility: Main-level laundry; Washer hookup; Electric dryer hookup
Neighborhood map
What this means for you Summary
Snapshot
- This is a 3-bed/2.0-bath single-family listed at $115k. Condition is rated fair.
Deal economics
- At list price, monthly cash flow is $237 ($3k/yr) — positive.
- The deal already cash-flows at list — no discount required.
- Meets the 1% rule at list price ($1k rent vs $115k).
- Cap rate 8.8% vs local median 7.3% in Center Point — meaningfully above typical; check what's discounted (condition, days-on-market, listing class) to confirm the premium yield is real.
Location & tenants
- Location reads 63/100 on livability (#193 in AL) — a middle-class / working-renter tenant base. Strengths: cost of living A+, commute A, housing A; Watch: crime D, amenities F, employment F.
- Jefferson County (suburban): math 9% / reading 32% proficiency, ranked #104 of 129 in AL (top 81%) — low school quality limits family demand, transient renter base, plan for 1-2y turnover.
- Zoned schools: Clay Elementary School (math 10% / reading 40%, grade F, #414 of 627 statewide, top 66%, 632 students, 48% FRL); Claychalkville High School (math 6% / reading 9%, grade F, #261 of 305 statewide, top 87%, 1,361 students, 56% FRL) — zoned schools at 52% FRL track the district average.
- Market conditions: Rents rising (+3.0%/yr); 334 active listings in the ZIP; 40 comparable units currently listed for rent nearby; rentals at typical pace (median 24d on market — plan ~3-4 weeks tenant-placement turnaround); 40% of comp listings sitting > 30 days — soft ceiling on asking rent; 2,114 units permitted in Jefferson County in 2024 (556 in 5+ unit buildings).
Forward outlook
- Local home prices are declining (-3.0%/yr); year-one equity from $795 of loan paydown is wiped out by about $3k of value loss. Plan a longer hold.
- Jefferson County population projected to shrink 4% by 2050 — rents likely to lag national; underwrite the cash flow, not the appreciation.
Negotiation context
- Only 11 days on market — expect competitive offers; lowballing is unlikely to land.
Risks & watch-outs
- Watch-outs: built in 1956 — expect roof / HVAC / electrical / plumbing capex.
Questions for the listing agent
- Have any recent inspections been done? Can we get a copy of the seller's disclosures and any deferred-maintenance estimates?
- Built in 1956 — when were the roof, HVAC, electrical panel, plumbing, and water heater last replaced?
- Is there a deadline driving the sale (1031 exchange, divorce, estate, relocation)? That informs how much negotiation room exists.
- Schools are F-rated, which usually means shorter tenancies and higher turnover. Who's the typical renter profile here, and what's been the actual vacancy rate?
- Crime grade is D in this area — have there been break-ins, vandalism, or insurance claims at this property in the last 3 years? What carrier currently insures it and at what premium?
- What's the average days-on-market for RENTAL listings here right now (not sales)? A rising rental-DOM trend means longer vacancies and softer asking-rent achievability than the comps imply.
- What's the recent tenant-quality profile in this submarket — average credit score on applications, eviction rate, late-payment / NSF rate, and stable-employment percentage? A property-management company in the area should have these aggregated.
- How much new for-sale + rental construction is in the pipeline within 1–3 miles? Heavy new supply typically softens prices + rents 12–24 months out; constrained supply supports both.
Investment metrics
- 1% rule
- 1.14% ✓
- Cap rate
- 8.76%
- Cash-on-cash
- 8.83%
- DSCR
- 1.39
- GRM
- 7.3
CMA / ARV
- ARV (on-the-fly)
- $166,920
- Comps found
- 12
Show comp detail 12 sales within ~0.75 mi
| Address | Dist | Beds/Ba | Sqft | Sold | Price | $/sf | Match |
|---|---|---|---|---|---|---|---|
| 348 17th Ave NW | 0.05mi | 4/2.0 (+1) | 1,456 (-7%) | 4mo | $175,000 | $120 | 78 |
| 316 20th Ave NW | 0.45mi | 3/1.0 | 1,540 (-1%) | 3mo | $164,900 | $107 | 70 |
| 441 NW 15th Ln | 0.42mi | 3/2.0 | 1,668 (+7%) | 5mo | $145,000 | $87 | 64 |
| 408 Tupelo Rd | 0.47mi | 3/2.0 | 1,470 (-6%) | 5mo | $140,000 | $95 | 64 |
| 1605 NW 5th Way | 0.41mi | 4/2.0 (+1) | 1,450 (-7%) | 5mo | $175,000 | $121 | 60 |
| 1419 4th Way NW | 0.59mi | 3/2.0 | 1,645 (+5%) | 6mo | $189,000 | $115 | 58 |
| 1332 4th Way NW | 0.72mi | 3/2.5 | 1,538 (-1%) | 5mo | $109,900 | $71 | 58 |
| 512 15th Ave NW | 0.58mi | 3/1.5 | 1,447 (-7%) | 2mo | $140,000 | $97 | 57 |
| 1517 NW 3rd St | 0.49mi | 3/2.0 | 1,377 (-12%) | 8mo | $86,000 | $62 | 51 |
| 1409 4th Pl NW | 0.62mi | 3/2.0 | 1,363 (-13%) | 2mo | $192,000 | $141 | 49 |
| 528 Tupelo Way | 0.49mi | 4/2.0 (+1) | 1,360 (-13%) | 8mo | $175,000 | $129 | 44 |
| 1401 4th Way NW | 0.66mi | 4/2.5 (+1) | 1,380 (-12%) | 4mo | $147,000 | $107 | 40 |
Match score weights: distance 35% · size 25% · config 20% · recency 20%. Top-matched comps best support the ARV.
Projected returns pro-forma
-3.0% appreciation · 3.04% rent growth · sell at horizon
- IRR
- -2.9%
- Equity multiple
- 0.89×
- Total profit
- $-3,480
- Equity at exit
- $17,147
- IRR
- 6.9%
- Equity multiple
- 1.52×
- Total profit
- $16,688
- Equity at exit
- $9,943
Cash invested: $32,200 (down + closing). Projections, not guarantees.
Landlord ↔ Tenant lean methodology
- Overall (STATE)
- 90 Strongly Landlord-Friendly
- State Alabama
- 90 Strongly Landlord-Friendly · R+15
- County
- — inherits STATE
- City
- — inherits STATE
ZIP-level market 35215
- Home prices YoY
- -34.4%
- Rents YoY
- 3.0%
- Active inventory
- 334
- Price-to-rent
- 7.3×
Monthly cashflow live
- Estimated rent
- $1,306 high interval (Pro) →
- Mortgage (P&I)
- −$603
- Tax est. 1.5%
- −$144 /mo · $1,725/yr
- Insurance
- −$48
- HOA
- −$0
- Vacancy / Maint / Mgmt
- −$274
- Net cashflow
- $237
Break-even live
UW: 25.0% down · 7.5% · 30yr · 1.5% tax · 5.0% vac · 8.0% maint · 8.0% mgmt
Financing live
Cash to close
- Down payment
- $28,750
- Closing costs
- $3,450
- Reserves months
- —
- Total cash needed
- —
Loan-product check · same deal, 3 products live
Conventional
25% down · 7.5% · 30yr
- Down + closing
- —
- Monthly P&I
- —
- Monthly cashflow
- —
- DSCR
- —
- Eligible?
- —
Personal DTI + credit; lowest rate.
DSCR
20% down · 8.5% · 30yr
- Down + closing
- —
- Monthly P&I
- —
- Monthly cashflow
- —
- DSCR
- —
- Eligible?
- —
No personal income docs; deal must DSCR.
Hard money
10% down · 12.0% · 12mo
- Down + closing
- —
- Monthly P&I
- —
- Monthly cashflow
- —
- DSCR
- —
- Eligible?
- —
Short-term bridge; refi at stabilization.
Rent comps 40 comps
| Address | Beds | Baths | Sqft | Rent | $/sqft | DOM | Units | Dist |
|---|---|---|---|---|---|---|---|---|
| 1712 4th Pl NW Center Point, AL | 3.0 | 1.0 | 1182 | $1,150 | $0.97 | 23d | 1 | 0.11mi |
| 405 18th Ave NW Center Point, AL | 3.0 | 2.0 | 1162 | $1,299 | $1.12 | 43d | 1 | 0.12mi |
| 1617 3rd Pl NW Center Point, AL | 3.0 | 2.0 | 1404 | $1,150 | $0.82 | 23d | 1 | 0.20mi |
| 305 18th Ct NW Center Point, AL | 3.0 | 1.5 | 1270 | $1,100 | $0.87 | 43d | 1 | 0.27mi |
| 428 15th Ter NW Center Point, AL | 3.0 | 2.0 | 1528 | $1,795 | $1.17 | 2d | 1 | 0.33mi |
| 434 15th Ter NW Center Point, AL | 3.0 | 2.0 | 1053 | $1,200 | $1.14 | 43d | 1 | 0.35mi |
| 1628 1st St NW Center Point, AL | 3.0 | 1.0 | 1124 | $1,150 | $1.02 | 43d | 1 | 0.36mi |
| 1732 6th St NW Center Point, AL | 3.0 | 1.5 | 1300 | $1,250 | $0.96 | 2d | 1 | 0.41mi |
| 1736 6th St NW Center Point, AL | 4.0 | 2.0 | 1830 | $1,550 | $0.85 | 43d | 1 | 0.42mi |
| 1612 Glenwood St NW Center Point, AL | 4.0 | 3.0 | 1344 | $1,480 | $1.10 | 23d | 1 | 0.43mi |
| 1905 2nd St NW Center Point, AL | 3.0 | 1.0 | 1258 | $1,395 | $1.11 | 43d | 1 | 0.43mi |
| 113 19th Ave NW Center Point, AL | 3.0 | 2.0 | 1407 | $1,250 | $0.89 | 11d | 1 | 0.43mi |
| 107 Sterling Ct NW Center Point, AL | 2.0 | 1.5–2.0 | 1026 | $1,062 | $1.04 | 2d | 4 | 0.51mi |
| 457 Tupelo Way Center Point, AL | 3.0 | 1.0 | 1658 | $995 | $0.60 | 21d | 1 | 0.52mi |
| 424 Tupelo Way Center Point, AL | 4.0 | 2.0 | 1233 | $1,300 | $1.05 | 43d | 1 | 0.55mi |
| 500 15th Ave NW Center Point, AL | 3.0 | 1.0 | 1079 | $1,050 | $0.97 | 2d | 1 | 0.55mi |
| 1827 Carson Rd Unit 7 Birmingham, AL | 3.0 | 2.5 | 1332 | $950 | $0.71 | 23d | 1 | 0.60mi |
| 1827 Carson Rd Unit 1 Birmingham, AL | 3.0 | 2.5 | 1332 | $1,125 | $0.84 | 43d | 1 | 0.60mi |
| 1356 5th Pl NW Center Point, AL | 3.0 | 1.0 | 1064 | $1,105 | $1.04 | 43d | 1 | 0.70mi |
| 621 15th Ave NW Birmingham, AL | 4.0 | 2.0 | 1070 | $1,200 | $1.12 | 15d | 1 | 0.71mi |
| 1720 2nd St NE Center Point, AL | 3.0 | 2.0 | 1100 | $1,400 | $1.27 | 43d | 1 | 0.71mi |
| 324 13th Ter NW Center Point, AL | 3.0 | 1.5 | 1418 | $1,295 | $0.91 | 23d | 1 | 0.72mi |
| 1333 5th Pl NW Center Point, AL | 3.0 | 2.0 | 1056 | $1,275 | $1.21 | 43d | 1 | 0.75mi |
| 1328 5th Pl NW Center Point, AL | 3.0 | 1.0 | 1250 | $1,050 | $0.84 | 15d | 1 | 0.79mi |
| 405 13th Ct NW Center Point, AL | 4.0 | 1.5 | 1248 | $1,415 | $1.13 | 21d | 1 | 0.80mi |
| 1305 5th Pl NW Center Point, AL | 3.0 | 2.0 | 1092 | $1,200 | $1.10 | 43d | 1 | 0.84mi |
| 400 13th Ave NW Birmingham, AL | 2.0 | 1.0 | 1100 | $890 | $0.81 | 43d | 1 | 0.85mi |
| 108 13th Ave NW Center Point, AL | 4.0 | 2.0 | 1444 | $1,265 | $0.88 | 23d | 1 | 0.85mi |
| 1301 5th Pl NW Center Point, AL | 3.0 | 1.0 | 1170 | $1,100 | $0.94 | 3d | 1 | 0.86mi |
| 1237 Linwood St Birmingham, AL | 3.0 | 1.5 | 1066 | $995 | $0.93 | 43d | 1 | 0.87mi |
| 1232 Oakwood St Birmingham, AL | 3.0 | 1.5 | 1301 | $1,223 | $0.94 | 23d | 1 | 0.90mi |
| 1225 Birchwood St Birmingham, AL | 3.0 | 2.0 | 1092 | $1,175 | $1.08 | 3d | 1 | 0.91mi |
| 319 23rd Ave NW Center Point, AL | 3.0 | 2.0 | 1284 | $1,395 | $1.09 | 43d | 1 | 0.92mi |
| 2245 3rd St NW Center Point, AL | 3.0 | 1.0 | 1156 | $1,100 | $0.95 | 23d | 1 | 0.92mi |
| 213 Meadwood Dr NE Center Point, AL | 3.0 | 1.0 | 1194 | $995 | $0.83 | 43d | 1 | 0.94mi |
| 239 Lake Drive Cir NE Birmingham, AL | 3.0 | 1.0 | 1159 | $1,125 | $0.97 | 3d | 1 | 0.96mi |
| 241 Lake Drive Cir NE Birmingham, AL | 2.0 | 1.0 | 1358 | $1,025 | $0.75 | 1d | 1 | 0.97mi |
| 236 E Haven Dr Birmingham, AL | 3.0 | 1.5 | 1926 | $1,495 | $0.78 | 11d | 1 | 0.99mi |
| 1317 Hatfield Ln Birmingham, AL | 3.0 | 1.5 | 2028 | $1,300 | $0.64 | 23d | 1 | 1.00mi |
| 1153 Linwood St Birmingham, AL | 3.0 | 2.0 | 1250 | $1,295 | $1.04 | 2d | 1 | 1.01mi |
Listing history 5 events
-
2026-06-03days on market $115,000 Active 11 DOM
-
2026-06-02days on market $115,000 Active 10 DOM
-
2026-06-01days on market $115,000 Active 9 DOM
-
2026-05-31days on market $115,000 Active 8 DOM
-
2026-05-23$115,000 Active
ⓘ Source: listings_history table (triggers on properties + properties_extension) + one-shot
backfill from property_details.listing_events for pre-trigger history.
Nearby sold comps map
Loading sold comps map…
Walkable amenities ~0.75 mi
Loading nearby amenities…
Taxation est. · year 1
- Rental income
- $15,669
- − Mortgage interest
- −$6,442
- − Property taxes
- −$1,725
- − Insurance
- −$575
- − Repairs & maintenance
- −$1,254
- − Management
- −$1,254
- − Depreciation
- −$3,345
- Taxable income
- $1,075
- Est. tax owed @ 24.0%
- −$258
- After-tax cash flow
- $2,584/yr
For passive investors: Depreciation is non-cash, so a rental often shows a tax loss while cash-flowing — sheltering income. Rental losses are passive: they offset passive income freely, and up to $25,000/yr can offset ordinary (W-2) income if you actively participate and your MAGI is under $100k (phasing out to $0 by $150k); unused losses carry forward. On sale, claimed depreciation is recaptured at up to 25%, and gains may owe capital-gains tax (a 1031 exchange can defer both). Figures are a year-1 estimate at your 24.0% rate — not tax advice; consult a CPA.
Condition & rehab AI · 30 photos
This home is in the midst of extensive renovations, with structural damage and missing components in the kitchen and bathrooms. The exterior is also in need of siding. Painting and re-framing will significantly improve its appearance and functionality.
Repairs flagged
- Major Exposed framing in kitchen — Structural damage
- Major Exposed framing in bathrooms — Structural damage
- Major Exposed framing in exterior — Structural damage
- Major Missing cabinets in kitchen — Functional impairment
- Major Missing fixtures in bathrooms — Functional impairment
- Major Missing siding in exterior — Structural damage
Value-add opportunities
- Resale Painting interior walls — Enhances curb appeal
- Resale Reframing and installing cabinets in kitchen — Improves functionality
- Resale Reframing and installing fixtures in bathrooms — Improves functionality
- Resale Reframing and installing siding in exterior — Enhances curb appeal
Renovation cost estimate screening
| Repair item | Severity | Est. cost |
|---|---|---|
| Exposed framing in kitchen · Structural damage | Major | $15,000–50,000 |
| Exposed framing in bathrooms · Structural damage | Major | $15,000–50,000 |
| Exposed framing in exterior · Structural damage | Major | $15,000–50,000 |
| Missing cabinets in kitchen · Functional impairment | Major | $15,000–50,000 |
| Missing fixtures in bathrooms · Functional impairment | Major | $15,000–50,000 |
| Missing siding in exterior · Structural damage | Major | $15,000–50,000 |
| Total estimated repair cost · 6 items | $90,000–300,000 |
Value-add ROI direction
- Resale Painting interior walls — Enhances curb appeal ↑
- Resale Reframing and installing cabinets in kitchen — Improves functionality ↑
- Resale Reframing and installing fixtures in bathrooms — Improves functionality ↑
- Resale Reframing and installing siding in exterior — Enhances curb appeal ↑
ⓘ Cost ranges are severity-bucket heuristics (US national rule-of-thumb). Get contractor quotes + a written scope before underwriting a rehab budget.
Schools (NCES district)
- District
- Jefferson County
- NCES district ID
- 0101920
- Math proficiency
- 9% ▼ -24.00%
- Reading proficiency
- 32% ▼ -5.00%
- Median HH income
- $51,712
- Composite
- 18.4/100
- National rank
- #8937
- State rank
- #104 of 129 in AL
Livability — Center Point
- Score
- 63/100
- State rank
- #193
- US rank
- #15671
Category grades
Schools grade is shown separately in the Schools card above.
Census & demographics
- Census place
- Center Point, AL
- County
- Jefferson County · 527,445 people
- City population
- 43,903
- Metro
- Birmingham-Hoover, AL
- Population (ZIP)
- 43,903
- Household income
- $52,793
- Rent vs Own
- Severe rent burden
- 1729.0
Population outlook (Jefferson County) Hauer SSP2
- Today (2025)
- 669,185 people
- By 2030
- 669,694 · +0.1%
- By 2040
- 661,388 · -1.2%
- By 2050
- 643,086 · -3.9%
- By 2075
- 577,267 · -13.7%
- By 2100
- 474,758 · -29.1%
Race, ethnicity, and origin ACS 2023
- Neighborhood character
- Predominantly Black (75%)
- Race & ethnicity
- Black 75% White 15% Hispanic / Latino 7% Two or more races 3%
- Hispanic origin (detail)
- Mexican 4%
- Common ancestry
- Lithuanian 1% Italian 1% Slovak 1%
- Foreign-born
- 4% · Canada
- Languages at home
- 92% English-only · Spanish 7%
Political lean MEDSL · Jefferson
- 2024 margin
- D (+10.4) · D 54.6% · R 44.2% · Other 1.2%
- 2008→2024 swing
- +5.4pp toward D · 2008: 5.1pp · 2024: 10.4pp
- All cycles
- 2024: D+10.4 2020: D+13.2 2016: D+7.2 2012: D+6.0 2008: D+5.1
Not yet ingested
- Civics
- —
Market trends
- HPI YoY
- ▼ -112.97%
- Current HPI
- 215.0607
- Rent YoY
- ▲ 3.04%
- Metro
- Birmingham-Hoover, AL
- State GDP YoY
- ▲ 2.94%
- F500 in state
- 4
Industry mix (Fortune 500 HQ in AL)
| Industry | F500 HQs | Revenue |
|---|---|---|
| Financial Services | 1 | $8B |
|
||
| Healthcare | 1 | $5B |
|
||
Price history
1 event — show timeline
- 2026-05-23 Listed $115,000 Greater Alabama MLS
Cash-flow waterfall
monthlySold comps — $/sqft
last 12 mo · ≤1 miLoading sold comps…