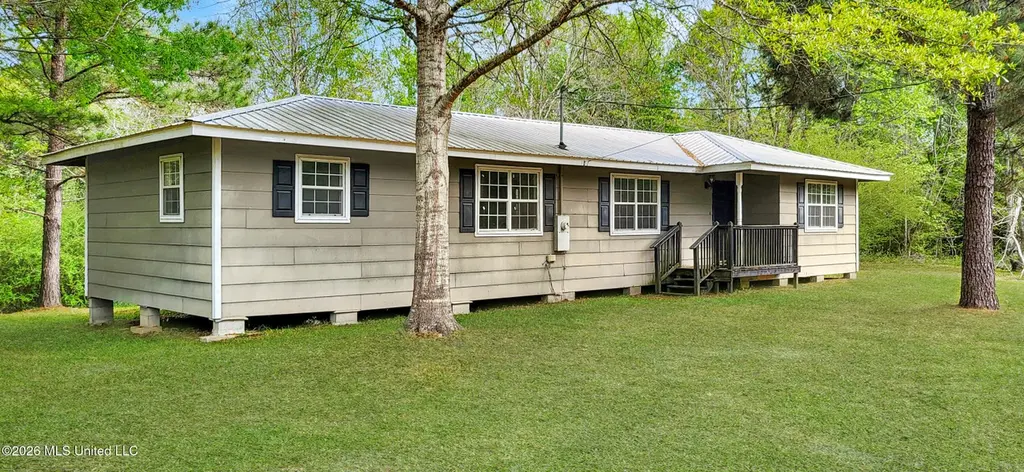
411 Martin Luther King Junior Dr · Poplarville, MS
Flood risk 1/10 · Minimal
- FEMA flood zone
- X (unshaded)
- Chance of flooding over 30 yrs
- 0.0%
- Est. flood insurance / yr
- $507 – $1,088
Fire risk 6/10 · Moderate
- Est. fire insurance / yr
- $1,241 – $2,305
Heat risk 8/10 · Major
- Hot days now (above 109°F)
- 7 days/yr
- Hot days in 30 yrs
- 20 days/yr
Wind risk 9/10 · Severe
- Chance of severe wind over 30 yrs
- 99.0%
Air-quality risk 2/10 · Minimal
- Unhealthy air days now
- 0 days/yr
- Unhealthy air days in 30 yrs
- 1 days/yr
Risk factors via First Street. Map © Google.
Why this score? — see what drove the C+ grade
The composite is a weighted blend of 9 inputs, each scored 0–100. Each bar is that input's sub-score; the figure is the points it added to the 100-point composite (weight × sub-score).
- Cash flow +23.3/30.0
- ARV discount +15.0/15.0
- DSCR +7.5/10.0
- 1% rule +5.8/10.0
- Condition / age +3.8/5.0
- Livability +3.6/5.0
- Schools +3.0/10.0
- Rent growth +2.5/5.0
- Appreciation +0.0/10.0
$99,900
🖨 Deal sheet 📄 Offer letter ✓ Due diligence
Listing remarks
Charming 2-bedroom, 2-bath home on a large lot, offering great potential for the right buyer. The open-concept living area flows into a second living space, perfect for a family room, home office, or entertainment area. Spacious yard provides room for gardening, play, or future expansion. Bring your vision and make this property shine!
Key facts
- Spacious yard
- Second living space
- 0.56 acre lot
Tags
Property features AI
Finance
- HOA & community: Playground; Restaurant nearby
Exterior
- Parking: Driveway
- Utilities: Public sewer; Community water; Electricity connected; Sewer connected; Water connected
- Home design: Single-family house; One story; Fixer condition; Entry level information not available; Facing direction not available
- Construction: Siding exterior; Pillar/post/pier foundation; Architectural shingle roof; Built area about 1,256 (source: assessor)
- Exterior features: Deck; Rear porch; Pie-shaped lot; Lot dimensions roughly 351x17x189x110x87x47x35
Interior
- Kitchen: Eat-in kitchen
- Flooring: Laminate; Tile
- Bathrooms: 2 full bathrooms
- Heating & cooling: Heat pump heating; Central air conditioning (electric)
- Interior features: Eat-in kitchen; Water heater
- Laundry & utility: Laundry room
Neighborhood map
What this means for you Summary
Snapshot
- This is a 2-bed/2.0-bath single-family listed at $100k. Condition is rated good.
Deal economics
- At list price, monthly cash flow is $183 ($2k/yr) — positive.
- The deal already cash-flows at list — no discount required.
- Meets the 1% rule at list price ($1k rent vs $100k).
- Cap rate 8.5% vs local median 2.8% in Poplarville — top-decile yield for the area; either an underpriced asset or a hidden risk that comps aren't pricing in. Stress-test before assuming the spread holds.
Location & tenants
- Location reads 72/100 on livability (#27 in MS) — a middle-class / working-renter tenant base. Strengths: cost of living A+, housing A+, health & safety A+; Watch: amenities F, commute F, employment D-.
- Poplarville Separate School District (rural): math 33% / reading 39% proficiency, ranked #52 of 130 in MS (top 40%) — families likely to look elsewhere, expect single-tenant / working-renter base with shorter leases; 63% free/reduced lunch — lower-income household profile, screen leases tightly.
- Market conditions: 190 active listings in the ZIP; 326 units permitted in Pearl River County in 2024 (0 in 5+ unit buildings).
Forward outlook
- Local home prices are declining (-3.0%/yr); year-one equity from $691 of loan paydown is wiped out by about $3k of value loss. Plan a longer hold.
- Pearl River County population projected at -19% by 2050 — secular population decline; favor cash flow + early exit over multi-decade hold.
Negotiation context
- Only 14 days on market — expect competitive offers; lowballing is unlikely to land.
Risks & watch-outs
- Climate carrying-cost: severe wind risk, 99% chance of damaging wind over 30y; major wildfire risk; extreme-heat days projected 7→20/yr by 2055 (HVAC capex compounding) — expect insurance premiums to compound above CPI over the hold.
Questions for the listing agent
- Is there a deadline driving the sale (1031 exchange, divorce, estate, relocation)? That informs how much negotiation room exists.
- What's the average days-on-market for RENTAL listings here right now (not sales)? A rising rental-DOM trend means longer vacancies and softer asking-rent achievability than the comps imply.
- What's the recent tenant-quality profile in this submarket — average credit score on applications, eviction rate, late-payment / NSF rate, and stable-employment percentage? A property-management company in the area should have these aggregated.
- How much new for-sale + rental construction is in the pipeline within 1–3 miles? Heavy new supply typically softens prices + rents 12–24 months out; constrained supply supports both.
Investment metrics
- 1% rule
- 1.08% ✓
- Cap rate
- 8.49%
- Cash-on-cash
- 7.86%
- DSCR
- 1.35
- GRM
- 7.7
CMA / ARV
- ARV (on-the-fly)
- $192,168
- Comps found
- 6
Show comp detail 6 sales within ~0.75 mi
| Address | Dist | Beds/Ba | Sqft | Sold | Price | $/sf | Match |
|---|---|---|---|---|---|---|---|
| 105 W Larkin I Smith Dr | 0.37mi | 3/1.0 (+1) | 1,204 (-4%) | 2mo | $124,900 | $104 | 65 |
| 308 W Beers St | 0.36mi | 2/1.0 | 1,203 (-4%) | 12mo | $145,000 | $121 | 62 |
| 109 N Barnett St | 0.37mi | 3/2.0 (+1) | 1,357 (+8%) | 8mo | $215,200 | $159 | 57 |
| 313 S Woodard St | 0.46mi | 3/1.0 (+1) | 1,326 (+6%) | 11mo | $160,000 | $121 | 51 |
| 133 Maria St | 0.48mi | 3/2.0 (+1) | 1,370 (+9%) | 11mo | $209,900 | $153 | 48 |
| 412 N Main St | 0.54mi | 3/2.0 (+1) | 1,382 (+10%) | 21mo | $234,900 | $170 | 36 |
Match score weights: distance 35% · size 25% · config 20% · recency 20%. Top-matched comps best support the ARV.
Projected returns pro-forma
-3.0% appreciation · 3.0% rent growth · sell at horizon
- IRR
- -4.3%
- Equity multiple
- 0.84×
- Total profit
- $-4,509
- Equity at exit
- $14,895
- IRR
- 5.4%
- Equity multiple
- 1.40×
- Total profit
- $11,128
- Equity at exit
- $8,638
Cash invested: $27,972 (down + closing). Projections, not guarantees.
Landlord ↔ Tenant lean methodology
- Overall (STATE)
- 90 Strongly Landlord-Friendly
- State Mississippi
- 90 Strongly Landlord-Friendly · R+11
- County
- — inherits STATE
- City
- — inherits STATE
ZIP-level market 39470
- Home prices YoY
- -18.1%
- Active inventory
- 190
- Price-to-rent
- 7.7×
Monthly cashflow live
- Estimated rent
- $1,084 medium interval (Pro) →
- Mortgage (P&I)
- −$524
- Tax from tax record
- −$107 /mo · $1,287/yr
- Insurance
- −$42
- HOA
- −$0
- Vacancy / Maint / Mgmt
- −$228
- Net cashflow
- $183
Break-even live
UW: 25.0% down · 7.5% · 30yr · 1.5% tax · 5.0% vac · 8.0% maint · 8.0% mgmt
Financing live
Cash to close
- Down payment
- $24,975
- Closing costs
- $2,997
- Reserves months
- —
- Total cash needed
- —
Loan-product check · same deal, 3 products live
Conventional
25% down · 7.5% · 30yr
- Down + closing
- —
- Monthly P&I
- —
- Monthly cashflow
- —
- DSCR
- —
- Eligible?
- —
Personal DTI + credit; lowest rate.
DSCR
20% down · 8.5% · 30yr
- Down + closing
- —
- Monthly P&I
- —
- Monthly cashflow
- —
- DSCR
- —
- Eligible?
- —
No personal income docs; deal must DSCR.
Hard money
10% down · 12.0% · 12mo
- Down + closing
- —
- Monthly P&I
- —
- Monthly cashflow
- —
- DSCR
- —
- Eligible?
- —
Short-term bridge; refi at stabilization.
Listing history 12 events
-
2026-06-18days on market $99,900 Active 14 DOM
-
2026-06-18status $99,900 Active 13 DOM
-
2026-06-12statusdays on market $99,900 Pending 13 DOM
-
2026-06-09days on market $99,900 Active 11 DOM
-
2026-06-08days on market $99,900 Active 10 DOM
-
2026-06-07days on market $99,900 Active 9 DOM
-
2026-06-07days on market $99,900 Active 8 DOM
-
2026-06-04days on market $99,900 Active 5 DOM
-
2026-06-03days on market $99,900 Active 4 DOM
-
2026-06-01days on market $99,900 Active 3 DOM
-
2026-05-31days on market $99,900 Active 2 DOM
-
2026-05-29$99,900 Active
ⓘ Source: listings_history table (triggers on properties + properties_extension) + one-shot
backfill from property_details.listing_events for pre-trigger history.
Tax reassessment forecast MS · Resets to sale price
- Current annual tax
- $1,287 · $107/mo
- Projected year-2 tax
- $1,287 · $107/mo
- Expected delta
- $0/yr ($0/mo · 0.0%)
ⓘ Screening estimate from a state-policy table — verify with the county assessor before closing.
Climate risk First Street
- Flood 1/10 Low FEMA zone X (unshaded) · 0% chance over 30 yrs
- Wildfire 6/10 Major
- Heat 8/10 Severe 7 d/yr ≥109°F today · 20 d/yr by 30 yrs out
- Wind 9/10 Extreme 99% chance of damaging wind over 30 yrs
- Air quality 2/10 Low 0 unhealthy d/yr today · 1 by 30 yrs out
Nearby sold comps map
Loading sold comps map…
Walkable amenities ~0.75 mi
Loading nearby amenities…
Taxation est. · year 1
- Rental income
- $13,003
- − Mortgage interest
- −$5,596
- − Property taxes
- −$1,287
- − Insurance
- −$500
- − Repairs & maintenance
- −$1,040
- − Management
- −$1,040
- − Depreciation
- −$2,906
- Taxable income
- $634
- Est. tax owed @ 24.0%
- −$152
- After-tax cash flow
- $2,047/yr
For passive investors: Depreciation is non-cash, so a rental often shows a tax loss while cash-flowing — sheltering income. Rental losses are passive: they offset passive income freely, and up to $25,000/yr can offset ordinary (W-2) income if you actively participate and your MAGI is under $100k (phasing out to $0 by $150k); unused losses carry forward. On sale, claimed depreciation is recaptured at up to 25%, and gains may owe capital-gains tax (a 1031 exchange can defer both). Figures are a year-1 estimate at your 24.0% rate — not tax advice; consult a CPA.
Condition & rehab AI · 9 photos
This charming 2-bedroom home is in good condition with cosmetic updates needed to enhance its resale and rental value.
Repairs flagged
- Minor Kitchen cabinets — Worn appearance
- Minor Bathtubs — Dated appearance
- Minor Countertops — Need updating
Value-add opportunities
- Both Painting throughout — Fresh paint enhances curb appeal and interior
- Both Kitchen cabinets and countertops — Fresh cabinets and countertops improve functionality and aesthetics
- Both Bathtub and fixtures — Modernizing the bathrooms adds value and functionality
Renovation cost estimate screening
| Repair item | Severity | Est. cost |
|---|---|---|
| Kitchen cabinets · Worn appearance | Minor | $500–3,000 |
| Bathtubs · Dated appearance | Minor | $500–3,000 |
| Countertops · Need updating | Minor | $500–3,000 |
| Total estimated repair cost · 3 items | $1,500–9,000 |
Value-add ROI direction
- Both Painting throughout — Fresh paint enhances curb appeal and interior ↑
- Both Kitchen cabinets and countertops — Fresh cabinets and countertops improve functionality and aesthetics ↑
- Both Bathtub and fixtures — Modernizing the bathrooms adds value and functionality ↑
ⓘ Cost ranges are severity-bucket heuristics (US national rule-of-thumb). Get contractor quotes + a written scope before underwriting a rehab budget.
Schools (NCES district)
- District
- Poplarville Separate School District
- NCES district ID
- 2803720
- Math proficiency
- 33% ▼ -12.00%
- Reading proficiency
- 39% ▼ -6.00%
- Median HH income
- $38,882
- Composite
- 30.1/100
- National rank
- #6339
- State rank
- #52 of 130 in MS
Livability — Poplarville
- Score
- 72/100
- State rank
- #27
- US rank
- #6434
Category grades
Schools grade is shown separately in the Schools card above.
Census & demographics
- Census place
- Poplarville, MS
- Population (ZIP)
- 12,872
Population outlook (Pearl River County) Hauer SSP2
- Today (2025)
- 53,426 people
- By 2030
- 51,663 · -3.3%
- By 2040
- 47,611 · -10.9%
- By 2050
- 43,286 · -19.0%
- By 2075
- 32,859 · -38.5%
- By 2100
- 22,476 · -57.9%
Race, ethnicity, and origin ACS 2023
- Neighborhood character
- Predominantly White (81%)
- Race & ethnicity
- White 81% Black 12% Two or more races 4% Hispanic / Latino 2%
- Common ancestry
- Lithuanian 6% Italian 3% Serbian 1%
- Foreign-born
- 0%
- Languages at home
- 98% English-only · Spanish 1%
Political lean MEDSL · Pearl River
- 2024 margin
- Solid R (+66.7) · D 16.1% · R 82.8% · Other 1.0%
- 2008→2024 swing
- -6.3pp toward R · 2008: -60.4pp · 2024: -66.7pp
- All cycles
- 2024: R+66.7 2020: R+64.2 2016: R+66.8 2012: R+60.3 2008: R+60.4
Not yet ingested
- Civics
- —
Market trends
- HPI YoY
- ▼ -46.36%
- Current HPI
- 210.4161
- Rent YoY
- —
- Metro
- —
- State GDP YoY
- —
- F500 in state
- 0
Price history
1 event — show timeline
- 2026-05-29 Listed $99,900 MLSU
Property tax history
+5.2%/yrLatest (2025): $1,287 · +6.2% YoY. Source: county tax records.
Cash-flow waterfall
monthlySold comps — $/sqft
last 12 mo · ≤1 miLoading sold comps…