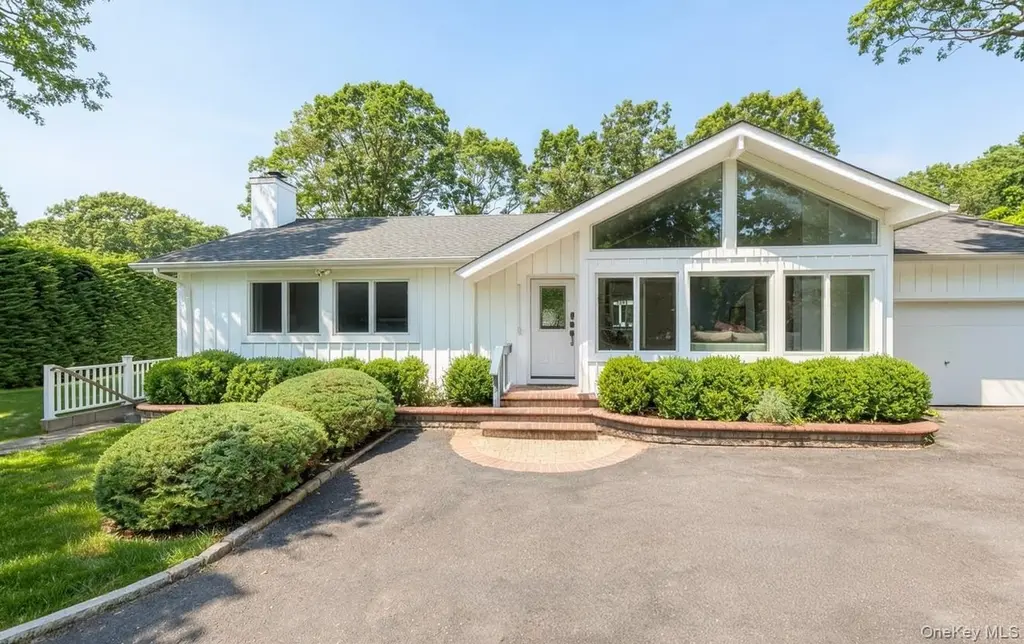
18 Squires Ave · Hampton Bays, NY
Flood risk 3/10 · Minor
- FEMA flood zone
- X (unshaded)
- Chance of flooding over 30 yrs
- 0.1%
- Est. flood insurance / yr
- $473 – $860
Fire risk 1/10 · Minimal
- Est. fire insurance / yr
- $691 – $1,283
Heat risk 4/10 · Minor
- Hot days now (above 90°F)
- 7 days/yr
- Hot days in 30 yrs
- 20 days/yr
Wind risk 8/10 · Major
- Chance of severe wind over 30 yrs
- 80.0%
Air-quality risk 3/10 · Minor
- Unhealthy air days now
- 2 days/yr
- Unhealthy air days in 30 yrs
- 3 days/yr
Risk factors via First Street. Map © Google.
Why this score? — see what drove the C- grade
The composite is a weighted blend of 9 inputs, each scored 0–100. Each bar is that input's sub-score; the figure is the points it added to the 100-point composite (weight × sub-score).
- Cash flow +20.4/30.0
- ARV discount +7.5/15.0
- DSCR +6.5/10.0
- Schools +5.0/10.0
- 1% rule +4.3/10.0
- Livability +3.4/5.0
- Rent growth +2.5/5.0
- Condition / age +2.5/5.0
- Appreciation +0.0/10.0
$1,695,000
🖨 Deal sheet 📄 Offer letter ✓ Due diligence
Listing remarks
Welcome to your Hamptons retreat in the heart of East Quogue. This beautifully appointed 4-bedroom, 3-bath home offers the perfect blend of comfort, style, and effortless indoor-outdoor living. Set on a private and beautifully landscaped property, the home is designed for both relaxed summer living and year-round enjoyment. Sun-drenched interiors feature spacious living and entertaining areas, a well-equipped kitchen, and generously sized bedrooms with comfortable accommodations throughout. Outside, multiple entertaining spaces surround the sparkling pool and spa, creating a true resort-style setting ideal for hosting or unwinding in complete privacy. Perfectly located just minutes from pri
Key facts
- Turnkey home
- Spa
- Resort style setting
Tags
Property features AI
Exterior
- Parking: Driveway; Attached garage with one garage space
- Utilities: Cesspool sewer; Utilities: See remarks
- Home design: Single-family residence
- Construction: Other construction materials; Other foundation type
- Exterior features: Corner lot; Front and rear sprinkler system; Private in-ground vinyl pool (fenced); On-site spa
Interior
- Kitchen: ENERGY STAR qualified appliances; Wine refrigerator
- Bedrooms: Seven total rooms (includes bedrooms and living spaces)
- Flooring: Hardwood flooring
- Bathrooms: Three full bathrooms
- Heating & cooling: Propane heating; Central air conditioning; Fireplace
- Interior features: First-floor bedroom; First-floor full bathroom; Beamed ceilings; Eat-in kitchen; Open floor plan; Finished full basement with walk-out access; Partial attic
- Laundry & utility: Dedicated laundry room
Neighborhood map
What this means for you Summary
Snapshot
- This is a 3-bed/2.0-bath single-family listed at $1.70M.
Deal economics
- At list price, monthly cash flow is $2k ($26k/yr) — positive.
- The deal already cash-flows at list — no discount required.
- To meet the 1% rule (rent ≥ 1% of price), the offer needs to be $1.57M (7.5% below list).
- Recommended offer: $1.57M (7.5% below list) — sets the bar for 1% rule.
- Cap rate 7.8% vs local median 6.4% in Hampton Bays — meaningfully above typical; check what's discounted (condition, days-on-market, listing class) to confirm the premium yield is real.
Location & tenants
- Location reads 68/100 on livability (#551 in NY) — a middle-class / working-renter tenant base. Strengths: crime A+, employment A+, health & safety B+; Watch: amenities F, commute F, cost of living F.
- East Quogue Union Free School District (suburban): math 55% / reading 50% proficiency, ranked #342 of 755 in NY (top 45%) — acceptable for families but not a draw, mixed tenant base, ~2y average lease; only 15% free/reduced lunch — higher-income household profile.
- Zoned schools: East Quogue School (math 57% / reading 62%, grade B-, #745 of 2,108 statewide, top 39%, 355 students, 31% FRL) — zoned schools average 31% FRL vs 15% district-wide (16 pts higher); higher-poverty schools than district average — tighter screening recommended.
- Market conditions: 75 active listings in the ZIP; 13 comparable units currently listed for rent nearby; rentals lingering (median 44d on market — plan ~5-8 weeks vacancy on turnover, expect pricing pressure); 62% of comp listings sitting > 30 days — soft ceiling on asking rent; 1,366 units permitted in Suffolk County in 2024 (216 in 5+ unit buildings).
Forward outlook
- Local home prices are declining (-3.0%/yr); year-one equity from $12k of loan paydown is wiped out by about $51k of value loss. Plan a longer hold.
- Suffolk County population projected to shrink 5% by 2050 — rents likely to lag national; underwrite the cash flow, not the appreciation.
Negotiation context
- It's been on market 22 days — a 2% lower offer ($1.67M) is reasonable based on typical stale-listing flexibility.
- 2 sale attempts with the ask held roughly flat each time — persistent listings suggest the price (not the market) is what's stuck; bring a comps-based counter.
- Current owner paid $555k; list at $1.70M implies a 205% gain — meaningful room to come down on a strong offer.
Risks & watch-outs
- Climate carrying-cost: severe wind risk, 80% chance of damaging wind over 30y — expect insurance premiums to compound above CPI over the hold.
Questions for the listing agent
- Is there a deadline driving the sale (1031 exchange, divorce, estate, relocation)? That informs how much negotiation room exists.
- Schools are B-rated — typically a magnet for longer-tenancy family renters. What's the average tenant stay here, and is there a school-zone premium baked into asking?
- What's the average days-on-market for RENTAL listings here right now (not sales)? A rising rental-DOM trend means longer vacancies and softer asking-rent achievability than the comps imply.
- What's the recent tenant-quality profile in this submarket — average credit score on applications, eviction rate, late-payment / NSF rate, and stable-employment percentage? A property-management company in the area should have these aggregated.
- How much new for-sale + rental construction is in the pipeline within 1–3 miles? Heavy new supply typically softens prices + rents 12–24 months out; constrained supply supports both.
Investment metrics
- 1% rule
- 0.93% ✗
- Cap rate
- 7.85%
- Cash-on-cash
- 5.56%
- DSCR
- 1.25
- GRM
- 9.0
CMA / ARV
- ARV (on-the-fly)
- $943,452
- Comps found
- 12
Show comp detail 12 sales within ~0.75 mi
| Address | Dist | Beds/Ba | Sqft | Sold | Price | $/sf | Match |
|---|---|---|---|---|---|---|---|
| 8 Foxboro Rd | 0.13mi | 3/2.0 | 1,495 (+4%) | 4mo | $951,000 | $636 | 84 |
| 3 Chestnut Ln | 0.27mi | 3/2.0 | 1,323 (-8%) | 16mo | $869,000 | $657 | 62 |
| 6 Sanderling Ln | 0.52mi | 3/3.0 | 1,462 (+2%) | 9mo | $1,375,000 | $940 | 61 |
| 7 Oakwood Rd | 0.30mi | 3/2.0 | 1,300 (-10%) | 14mo | $795,000 | $612 | 59 |
| 22 Shinnecock Ave | 0.45mi | 4/2.0 (+1) | 1,356 (-6%) | 8mo | $865,000 | $638 | 58 |
| 7 Evergreen Ct | 0.60mi | 3/2.0 | 1,486 (+4%) | 12mo | $989,000 | $666 | 56 |
| 10 Rolling Hill Rd | 0.63mi | 3/2.0 | 1,400 (-2%) | 13mo | $1,095,000 | $782 | 56 |
| 27 Norwood Rd | 0.49mi | 4/2.0 (+1) | 1,468 (+2%) | 17mo | $919,999 | $627 | 55 |
| 89 Bellows Ter | 0.54mi | 3/2.5 | 1,620 (+13%) | 12mo | $1,260,000 | $778 | 42 |
| 6 Whiting Rd | 0.69mi | 3/2.0 | 1,300 (-10%) | 14mo | $899,000 | $692 | 40 |
| 3 Evergreen Ct | 0.56mi | 3/4.0 | 1,594 (+11%) | 13mo | $945,000 | $593 | 36 |
| 7 Homewood Dr | 0.68mi | 3/2.0 | 1,591 (+11%) | 20mo | $865,000 | $544 | 34 |
Match score weights: distance 35% · size 25% · config 20% · recency 20%. Top-matched comps best support the ARV.
Projected returns pro-forma
-3.0% appreciation · 3.0% rent growth · sell at horizon
- IRR
- -7.7%
- Equity multiple
- 0.71×
- Total profit
- $-135,396
- Equity at exit
- $252,730
- IRR
- 1.8%
- Equity multiple
- 1.13×
- Total profit
- $59,487
- Equity at exit
- $146,553
Cash invested: $474,600 (down + closing). Projections, not guarantees.
Landlord ↔ Tenant lean methodology
- Overall (STATE)
- 15 Strongly Tenant-Friendly
- State New York
- 15 Strongly Tenant-Friendly · D+10
- County
- — inherits STATE
- City
- — inherits STATE
ZIP-level market 11942
- Home prices YoY
- -25.0%
- Active inventory
- 75
- Price-to-rent
- 9.0×
Monthly cashflow live
- Estimated rent
- $15,680 high interval (Pro) →
- Mortgage (P&I)
- −$8,889
- Tax from tax record
- −$595 /mo · $7,135/yr
- Insurance
- −$706
- HOA
- −$0
- Vacancy / Maint / Mgmt
- −$3,293
- Net cashflow
- $2,198
Break-even live
UW: 25.0% down · 7.5% · 30yr · 1.5% tax · 5.0% vac · 8.0% maint · 8.0% mgmt
Financing live
Cash to close
- Down payment
- $423,750
- Closing costs
- $50,850
- Reserves months
- —
- Total cash needed
- —
Loan-product check · same deal, 3 products live
Conventional
25% down · 7.5% · 30yr
- Down + closing
- —
- Monthly P&I
- —
- Monthly cashflow
- —
- DSCR
- —
- Eligible?
- —
Personal DTI + credit; lowest rate.
DSCR
20% down · 8.5% · 30yr
- Down + closing
- —
- Monthly P&I
- —
- Monthly cashflow
- —
- DSCR
- —
- Eligible?
- —
No personal income docs; deal must DSCR.
Hard money
10% down · 12.0% · 12mo
- Down + closing
- —
- Monthly P&I
- —
- Monthly cashflow
- —
- DSCR
- —
- Eligible?
- —
Short-term bridge; refi at stabilization.
Rent comps 13 comps
| Address | Beds | Baths | Sqft | Rent | $/sqft | DOM | Units | Dist |
|---|---|---|---|---|---|---|---|---|
| 168 W Tiana Rd Hampton Bays, NY | 3.0 | 2.0 | 1004 | $4,000 | $3.98 | 43d | 1 | 0.17mi |
| 15 Birchwood Ln East Quogue, NY | 3.0 | 3.0 | 1635 | $5,000 | $3.06 | 43d | 1 | 0.38mi |
| 138 W Tiana Rd Hampton Bays, NY | 3.0 | 1.0 | 1040 | $16,000 | $15.38 | 10d | 1 | 0.39mi |
| 2 Fairview Rd Hampton Bays, NY | 2.0 | 1.0 | 1440 | $17,500 | $12.15 | 17d | 1 | 0.40mi |
| 104 W Tiana Rd Hampton Bays, NY | 3.0 | 1.5 | 900 | $15,000 | $16.67 | 43d | 1 | 0.63mi |
| 45 Bellows Ter Unit B Hampton Bays, NY | 4.0 | 2.0 | 1722 | $7,000 | $4.07 | 43d | 1 | 0.68mi |
| 6 Rolling Hill Rd Hampton Bays, NY | 3.0 | 3.0 | 1697 | $18,000 | $10.61 | 1d | 1 | 0.68mi |
| 73 W Tiana Rd Unit 11 Hampton Bays, NY | 2.0 | 1.0 | 1000 | $11,000 | $11.00 | 43d | 1 | 0.86mi |
| 4 E End Ave East Quogue, NY | 3.0 | 1.0 | 976 | $4,500 | $4.61 | 43d | 1 | 0.97mi |
| 30 Vail Ave East Quogue, NY | 3.0 | 2.0 | 1260 | $38,500 | $30.56 | 24d | 1 | 1.39mi |
| 35 Grant Blvd Hampton Bays, NY | 4.0 | 3.0 | 1484 | $35,000 | $23.58 | 24d | 1 | 1.42mi |
| 58 Ocean Ave Hampton Bays, NY | 3.0 | 2.0 | 1600 | $10,000 | $6.25 | 43d | 1 | 1.43mi |
| 51 Ocean Ave Hampton Bays, NY | 3.0 | 2.0 | 1200 | $5,000 | $4.17 | 43d | 1 | 1.48mi |
Listing history 13 events
-
2026-06-08statusdays on market $1,695,000 Pending 22 DOM
-
2026-06-07days on market $1,695,000 Active 21 DOM
-
2026-06-04days on market $1,695,000 Active 18 DOM
-
2026-06-03days on market $1,695,000 Active 17 DOM
-
2026-06-02days on market $1,695,000 Active 16 DOM
-
2026-06-01days on market $1,695,000 Active 15 DOM
-
2026-05-31days on market $1,695,000 Active 14 DOM
-
2026-05-17$1,695,000 Active
-
2025-07-27historical $20,000
-
2025-06-29$20,000
-
2005-08-31soldstatus $555,000
-
1987-03-04soldstatus $182,500
-
1986-03-07soldstatus $44,000
ⓘ Source: listings_history table (triggers on properties + properties_extension) + one-shot
backfill from property_details.listing_events for pre-trigger history.
Tax reassessment forecast NY · Partial reset (capped growth)
- Current annual tax
- $7,135 · $595/mo
- Projected year-2 tax
- $17,890 · $1,491/mo
- Expected delta
- +$10,755/yr (+$896/mo · 150.7%)
ⓘ Screening estimate from a state-policy table — verify with the county assessor before closing.
Climate risk First Street
- Flood 3/10 Moderate FEMA zone X (unshaded) · 10% chance over 30 yrs
- Wildfire 1/10 Low
- Heat 4/10 Moderate 7 d/yr ≥90°F today · 20 d/yr by 30 yrs out
- Wind 8/10 Severe 80% chance of damaging wind over 30 yrs
- Air quality 3/10 Moderate 2 unhealthy d/yr today · 3 by 30 yrs out
Nearby sold comps map
Loading sold comps map…
Walkable amenities ~0.75 mi
Loading nearby amenities…
Taxation est. · year 1
- Rental income
- $188,160
- − Mortgage interest
- −$94,946
- − Property taxes
- −$7,135
- − Insurance
- −$8,475
- − Repairs & maintenance
- −$15,053
- − Management
- −$15,053
- − Depreciation
- −$49,309
- Taxable loss
- −$1,811
- Est. tax savings @ 24.0%
- +$435
- After-tax cash flow
- $26,806/yr
For passive investors: Depreciation is non-cash, so a rental often shows a tax loss while cash-flowing — sheltering income. Rental losses are passive: they offset passive income freely, and up to $25,000/yr can offset ordinary (W-2) income if you actively participate and your MAGI is under $100k (phasing out to $0 by $150k); unused losses carry forward. On sale, claimed depreciation is recaptured at up to 25%, and gains may owe capital-gains tax (a 1031 exchange can defer both). Figures are a year-1 estimate at your 24.0% rate — not tax advice; consult a CPA.
Schools (NCES district)
- District
- East Quogue Union Free School District
- NCES district ID
- 3609900
- Math proficiency
- 55% ▬ 0.00%
- Reading proficiency
- 50% ▲ 5.00%
- Median HH income
- $81,457
- Composite
- 49.79/100
- National rank
- #4207
- State rank
- #342 of 755 in NY
Livability — Hampton Bays
- Score
- 68/100
- State rank
- #551
- US rank
- #9894
Category grades
Schools grade is shown separately in the Schools card above.
Census & demographics
- Census place
- Hampton Bays, NY
- City population
- 15,819
- Population (ZIP)
- 5,871
Population outlook (Suffolk County) Hauer SSP2
- Today (2025)
- 1,505,262 people
- By 2030
- 1,498,318 · -0.5%
- By 2040
- 1,471,101 · -2.3%
- By 2050
- 1,424,848 · -5.3%
- By 2075
- 1,337,157 · -11.2%
- By 2100
- 1,217,720 · -19.1%
Race, ethnicity, and origin ACS 2023
- Neighborhood character
- Predominantly White (80%)
- Race & ethnicity
- White 80% Hispanic / Latino 16% Asian 2% Two or more races 2%
- Hispanic origin (detail)
- Mexican 3%
- Common ancestry
- Romanian 6% Scotch-Irish 3% Lithuanian 3%
- Foreign-born
- 13% · Canada, Jamaica, Guatemala
- Languages at home
- 80% English-only · Spanish 12% Other Indo-European 2% Russian/Polish/Slavic 2%
Political lean MEDSL · Suffolk
- 2024 margin
- Lean R (+10.0) · D 45.0% · R 55.0%
- 2008→2024 swing
- -16.0pp toward R · 2008: 6.0pp · 2024: -10.0pp
- All cycles
- 2024: R+10.0 2020: R+0.0 2016: R+8.2 2012: D+2.9 2008: D+6.0
Not yet ingested
- Civics
- —
Market trends
- HPI YoY
- ▼ -145.33%
- Current HPI
- 435.8017
- Rent YoY
- —
- Metro
- —
- State GDP YoY
- ▲ 2.60%
- F500 in state
- 92
Industry mix (Fortune 500 HQ in NY)
| Industry | F500 HQs | Revenue |
|---|---|---|
| Financial Services | 10 | $950B |
|
||
| Consumer Goods | 9 | $162B |
|
||
| Insurance | 4 | $225B |
|
||
| Telecommunications | 2 | $144B |
|
||
| Pharmaceuticals | 2 | $112B |
|
||
| Media / Entertainment | 2 | $69B |
|
||
Price history
+3752.3% since first listed6 events — show timeline
- 2026-05-17 Listed $1,695,000 OneKey® MLS as Distributed by MLS Grid
- 2025-07-27 Rental Removed $20,000 ONEKEY
- 2025-06-29 Listed for Rent $20,000 ONEKEY
- 2005-08-31 Sold (Public Records) $555,000 Public Records
- 1987-03-04 Sold (Public Records) $182,500 Public Records
- 1986-03-07 Sold (Public Records) $44,000 Public Records
Property tax history
+1.7%/yrLatest (2024): $7,135 · +0.0% YoY. Source: county tax records.
Cash-flow waterfall
monthlySold comps — $/sqft
last 12 mo · ≤1 miLoading sold comps…