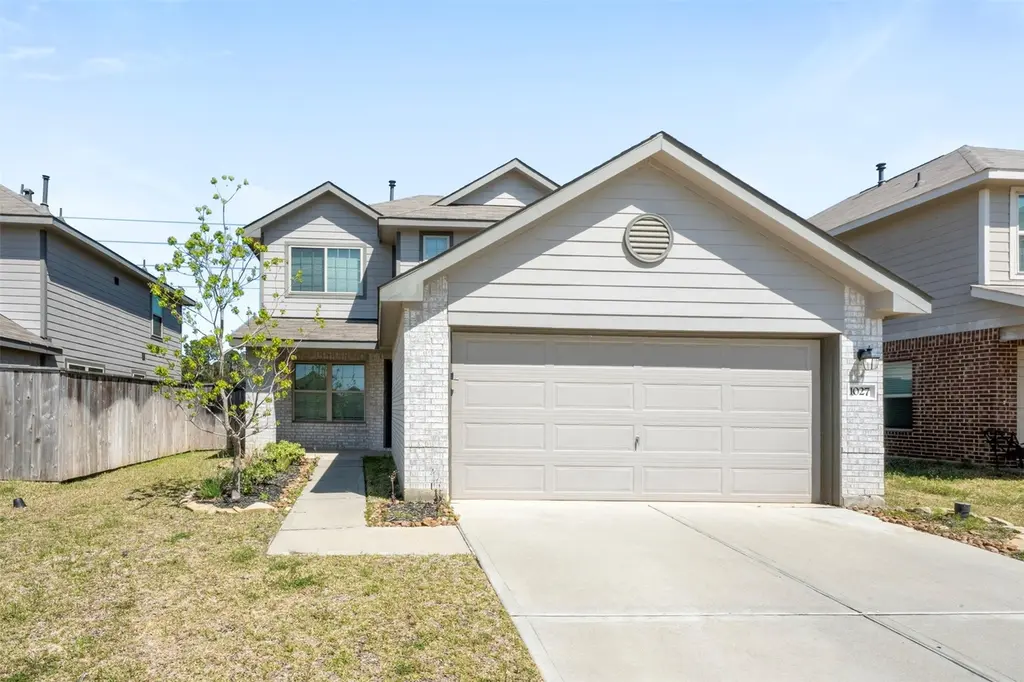
1027 Brighton Orchards Ln · Magnolia, TX
Flood risk 1/10 · Minimal
- FEMA flood zone
- X (unshaded)
- Chance of flooding over 30 yrs
- 0.0%
- Est. flood insurance / yr
- $507 – $1,088
Fire risk 4/10 · Minor
- Est. fire insurance / yr
- $1,222 – $2,270
Heat risk 8/10 · Major
- Hot days now (above 111°F)
- 7 days/yr
- Hot days in 30 yrs
- 21 days/yr
Wind risk 8/10 · Major
- Chance of severe wind over 30 yrs
- 99.0%
Air-quality risk 2/10 · Minimal
- Unhealthy air days now
- 2 days/yr
- Unhealthy air days in 30 yrs
- 2 days/yr
Risk factors via First Street. Map © Google.
Why this score? — see what drove the C- grade
The composite is a weighted blend of 9 inputs, each scored 0–100. Each bar is that input's sub-score; the figure is the points it added to the 100-point composite (weight × sub-score).
- ARV discount +15.0/15.0
- Appreciation +10.0/10.0
- Cash flow +6.7/30.0
- Condition / age +4.0/5.0
- Schools +3.9/10.0
- 1% rule +3.7/10.0
- Livability +3.7/5.0
- Rent growth +2.6/5.0
- DSCR +0.9/10.0
$229,500
🖨 Deal sheet 📄 Offer letter ✓ Due diligence
Listing remarks MLS
Welcome to 1027 Brighton Orchards Lane in the charming Magnolia Ridge community. This exquisite Single-Family property boasts 4 bedrooms and 2 & 1/2 baths, providing ample space for comfortable living. With 1826 square feet of living space and a generous lot size of 5558 square feet, this home is perfect for families looking for a spacious retreat. Built in 2021, this property offers modern amenities and a convenient location. Contact me today to schedule a viewing of this remarkable home in Magnolia Ridge.
Key facts
- 5,523 sq ft lot
- 2 garage spots
- Built 2021
Neighborhood map
What this means for you Summary
Snapshot
- This is a 4-bed/2.5-bath single-family listed at $230k. Condition is rated good.
Deal economics
- At list price, monthly cash flow is $-372 ($-4k/yr) — negative.
- To cash-flow at today's rent, offer at most $164k (28.6% below list).
- To meet the 1% rule (rent ≥ 1% of price), the offer needs to be $199k (13.1% below list).
- Recommended offer: $164k (28.6% below list) — sets the bar for cash-flow.
- Cap rate 4.4% vs local median 3.4% in Magnolia — meaningfully above typical; check what's discounted (condition, days-on-market, listing class) to confirm the premium yield is real.
Location & tenants
- Location reads 73/100 on livability (#222 in TX) — a middle-class / working-renter tenant base. Strengths: crime A+, cost of living A+, housing A+; Watch: schools D+, amenities F, commute F.
- Magnolia ISD (rural): math 42% / reading 45% proficiency, ranked #247 of 826 in TX (top 30%) — families likely to look elsewhere, expect single-tenant / working-renter base with shorter leases.
- Market conditions: Rents flat; 1604 active listings in the ZIP; 10 comparable units currently listed for rent nearby; rentals at typical pace (median 24d on market — plan ~3-4 weeks tenant-placement turnaround); high-income renter base; 13,259 units permitted in Montgomery County in 2024 (1,402 in 5+ unit buildings).
Forward outlook
- In year one you build about $25k of equity ($2k loan paydown + $23k appreciation (10.0% local appreciation)).
- Montgomery County population projected at +65% by 2050 — long-run rental-demand tailwind backs the buy-and-hold thesis.
- By year 2, paydown + projected appreciation supports a ~$39k cash-out refi (75% LTV) — recoverable capital for the next deal without selling this one.
Negotiation context
- It's been on market 89 days — a 6% lower offer ($216k) is reasonable based on typical stale-listing flexibility.
Risks & watch-outs
- Watch-outs: property tax is 3.1% of price.
- Climate carrying-cost: severe wind risk, 99% chance of damaging wind over 30y; extreme-heat days projected 7→21/yr by 2055 (HVAC capex compounding) — expect insurance premiums to compound above CPI over the hold.
Questions for the listing agent
- What do current leases actually rent for vs. the listed asking? Can we see a recent rent roll and the last 12 months of T-12 income?
- It's been on market 89 days. Have you received any prior offers? Is the seller open to a 29% concession, seller financing, or rate buy-down credit?
- Property tax is high relative to price — has the assessment been appealed recently, and will the sale trigger a re-assessment?
- What does the HOA fee cover, when was the last increase, and are there any pending special assessments or reserve-fund shortfalls?
- Why hasn't it sold? Are there any deal-killer items the seller is aware of (foundation, flood, title, zoning, code violations)?
- Is there a deadline driving the sale (1031 exchange, divorce, estate, relocation)? That informs how much negotiation room exists.
- Schools are D-rated, which usually means shorter tenancies and higher turnover. Who's the typical renter profile here, and what's been the actual vacancy rate?
- What's the average days-on-market for RENTAL listings here right now (not sales)? A rising rental-DOM trend means longer vacancies and softer asking-rent achievability than the comps imply.
- What's the recent tenant-quality profile in this submarket — average credit score on applications, eviction rate, late-payment / NSF rate, and stable-employment percentage? A property-management company in the area should have these aggregated.
- How much new for-sale + rental construction is in the pipeline within 1–3 miles? Heavy new supply typically softens prices + rents 12–24 months out; constrained supply supports both.
Investment metrics
- 1% rule
- 0.87% ✗
- Cap rate
- 4.35%
- Cash-on-cash
- -6.94%
- DSCR
- 0.69
- GRM
- 9.6
CMA / ARV
- ARV (median comp)
- $292,217
- List price
- $229,500
- Delta
- -21.46%
- Verdict
- UNDERPRICED
- Comps
- 20 within 1.0 mi
Show comp detail 12 sales within ~0.75 mi
| Address | Dist | Beds/Ba | Sqft | Sold | Price | $/sf | Match |
|---|---|---|---|---|---|---|---|
| 1047 Brighton Orchards Ln | 0.04mi | 4/2.5 | 1,826 (0%) | 2mo | $250,000 | $137 | 96 |
| 705 Autumn Lake Ln | 0.39mi | 4/2.0 | 1,920 (+5%) | 1mo | $350,000 | $182 | 70 |
| 707 Hackberry Branch Ct | 0.42mi | 4/2.0 | 1,732 (-5%) | 1mo | $274,990 | $159 | 69 |
| 338 Prairie Warbler St | 0.39mi | 4/3.0 | 1,942 (+6%) | 2mo | $360,900 | $186 | 67 |
| 582 Bluebell Maiden Ct | 0.46mi | 4/2.0 | 1,914 (+5%) | 2mo | $297,990 | $156 | 67 |
| 306 Prairie Warbler St | 0.37mi | 3/3.0 (-1) | 1,984 (+9%) | 0mo | $364,900 | $184 | 61 |
| 232 Ashley Branch St | 0.57mi | 3/2.0 (-1) | 1,780 (-2%) | 1mo | $291,990 | $164 | 61 |
| 236 Country Crossing Cir | 0.67mi | 3/2.0 (-1) | 1,871 (+2%) | 1mo | $264,999 | $142 | 57 |
| 574 Bluebell Maiden Ct | 0.47mi | 3/2.0 (-1) | 1,619 (-11%) | 1mo | $269,990 | $167 | 51 |
| 706 Umbrella Tree Dr | 0.70mi | 4/2.0 | 1,607 (-12%) | 0mo | $258,990 | $161 | 45 |
| 715 Michelia St | 0.56mi | 3/2.0 (-1) | 1,588 (-13%) | 2mo | $285,990 | $180 | 44 |
| 158 Piney Pathway | 0.59mi | 3/2.0 (-1) | 2,053 (+12%) | 2mo | $283,000 | $138 | 43 |
Match score weights: distance 35% · size 25% · config 20% · recency 20%. Top-matched comps best support the ARV.
Projected returns pro-forma
10.0% appreciation · 0.32% rent growth · sell at horizon
- IRR
- 18.5%
- Equity multiple
- 2.50×
- Total profit
- $96,339
- Equity at exit
- $206,752
- IRR
- 16.6%
- Equity multiple
- 5.56×
- Total profit
- $293,306
- Equity at exit
- $445,868
Cash invested: $64,260 (down + closing). Projections, not guarantees.
Landlord ↔ Tenant lean methodology
- Overall (STATE)
- 87 Strongly Landlord-Friendly
- State Texas
- 87 Strongly Landlord-Friendly · R+5
- County
- — inherits STATE
- City
- — inherits STATE
ZIP-level market 77354
- Home prices YoY
- 2.4%
- Rents YoY
- 0.3%
- Active inventory
- 1604
- Price-to-rent
- 9.6×
Monthly cashflow live
- Estimated rent
- $1,995 high interval (Pro) →
- Mortgage (P&I)
- −$1,204
- Tax from tax record
- −$600 /mo · $7,204/yr
- Insurance
- −$96
- HOA
- −$48
- Vacancy / Maint / Mgmt
- −$419
- Net cashflow
- $-372
Break-even live
UW: 25.0% down · 7.5% · 30yr · 1.5% tax · 5.0% vac · 8.0% maint · 8.0% mgmt
Financing live
Cash to close
- Down payment
- $57,375
- Closing costs
- $6,885
- Reserves months
- —
- Total cash needed
- —
Loan-product check · same deal, 3 products live
Conventional
25% down · 7.5% · 30yr
- Down + closing
- —
- Monthly P&I
- —
- Monthly cashflow
- —
- DSCR
- —
- Eligible?
- —
Personal DTI + credit; lowest rate.
DSCR
20% down · 8.5% · 30yr
- Down + closing
- —
- Monthly P&I
- —
- Monthly cashflow
- —
- DSCR
- —
- Eligible?
- —
No personal income docs; deal must DSCR.
Hard money
10% down · 12.0% · 12mo
- Down + closing
- —
- Monthly P&I
- —
- Monthly cashflow
- —
- DSCR
- —
- Eligible?
- —
Short-term bridge; refi at stabilization.
Rent comps 10 comps
| Address | Beds | Baths | Sqft | Rent | $/sqft | DOM | Units | Dist |
|---|---|---|---|---|---|---|---|---|
| 937 Gentle Moss Dr Magnolia, TX | 3.0 | 2.0 | 1252 | $1,635 | $1.31 | 4d | 1 | 0.23mi |
| 423 Jewett Meadow Dr Magnolia, TX | 3.0 | 2.0 | 1311 | $1,781 | $1.36 | 21d | 1 | 0.27mi |
| 202 Alder Laurels Cv Magnolia, TX | 4.0 | 2.5 | 2229 | $2,036 | $0.91 | 21d | 1 | 0.30mi |
| 948 Oak Mist Ln Magnolia, TX | 3.0 | 2.0 | 1470 | $2,000 | $1.36 | 24d | 1 | 0.47mi |
| 764 Autumn Cherry Trl Magnolia, TX | 4.0 | 3.0 | 2196 | $1,665 | $0.76 | 43d | 1 | 0.47mi |
| 134 Piney Pathway Magnolia, TX | 3.0 | 2.0 | 2329 | $2,016 | $0.87 | 4d | 1 | 0.60mi |
| 139 Piney Pathway Magnolia, TX | 4.0 | 2.0 | 2332 | $1,971 | $0.85 | 24d | 1 | 0.63mi |
| 273 Douglas Hills Dr Magnolia, TX | 4.0 | 3.0 | 1922 | $1,895 | $0.99 | 43d | 1 | 0.77mi |
| 359 Cumberland Forest Dr Magnolia, TX | 4.0 | 2.0 | 1459 | $1,725 | $1.18 | 24d | 1 | 0.89mi |
| 408 Cumberland Forest Dr Magnolia, TX | 3.0 | 2.0 | 1402 | $1,795 | $1.28 | 43d | 1 | 0.97mi |
HOA detail
- Monthly dues
- $48 · $576/yr
Listing history 14 events
-
2026-06-18days on market $229,500 Active 89 DOM
-
2026-06-17days on market $229,500 Active 88 DOM
-
2026-06-16days on market $229,500 Active 87 DOM
-
2026-06-15days on market $229,500 Active 86 DOM
-
2026-06-13days on market $229,500 Active 84 DOM
-
2026-06-09days on market $229,500 Active 80 DOM
-
2026-06-08days on market $229,500 Active 79 DOM
-
2026-06-07days on market $229,500 Active 78 DOM
-
2026-06-04pricedays on market $229,500 Active 75 DOM
-
2026-06-03days on market $239,900 Active 74 DOM
-
2026-06-02days on market $239,900 Active 73 DOM
-
2026-06-01days on market $239,900 Active 72 DOM
-
2026-05-31days on market $239,900 Active 71 DOM
-
2026-03-21$249,900 Active 516-char remark
Show marketing remark (516 chars)
Welcome to 1027 Brighton Orchards Lane in the charming Magnolia Ridge community. This exquisite Single-Family property boasts 4 bedrooms and 2 & 1/2 baths, providing ample space for comfortable living. With 1826 square feet of living space and a generous lot size of 5558 square feet, this home is perfect for families looking for a spacious retreat. Built in 2021, this property offers modern amenities and a convenient location. Contact me today to schedule a viewing of this remarkable home in Magnolia Ridge.
ⓘ Source: listings_history table (triggers on properties + properties_extension) + one-shot
backfill from property_details.listing_events for pre-trigger history.
Tax reassessment forecast TX · Resets to sale price
- Current annual tax
- $7,204 · $600/mo
- Projected year-2 tax
- $7,204 · $600/mo
- Expected delta
- $0/yr ($0/mo · 0.0%)
ⓘ Screening estimate from a state-policy table — verify with the county assessor before closing.
Climate risk First Street
- Flood 1/10 Low FEMA zone X (unshaded) · 0% chance over 30 yrs
- Wildfire 4/10 Moderate
- Heat 8/10 Severe 7 d/yr ≥111°F today · 21 d/yr by 30 yrs out
- Wind 8/10 Severe 99% chance of damaging wind over 30 yrs
- Air quality 2/10 Low 2 unhealthy d/yr today · 2 by 30 yrs out
Nearby sold comps map
Loading sold comps map…
Walkable amenities ~0.75 mi
Loading nearby amenities…
Taxation est. · year 1
- Rental income
- $23,938
- − Mortgage interest
- −$12,856
- − Property taxes
- −$7,204
- − Insurance
- −$1,148
- − Repairs & maintenance
- −$1,915
- − Management
- −$1,915
- − HOA
- −$576
- − Depreciation
- −$6,676
- Taxable loss
- −$8,352
- Est. tax savings @ 24.0%
- +$2,004
- After-tax cash flow
- $-2,454/yr
For passive investors: Depreciation is non-cash, so a rental often shows a tax loss while cash-flowing — sheltering income. Rental losses are passive: they offset passive income freely, and up to $25,000/yr can offset ordinary (W-2) income if you actively participate and your MAGI is under $100k (phasing out to $0 by $150k); unused losses carry forward. On sale, claimed depreciation is recaptured at up to 25%, and gains may owe capital-gains tax (a 1031 exchange can defer both). Figures are a year-1 estimate at your 24.0% rate — not tax advice; consult a CPA.
Condition & rehab AI · 12 photos
This single-family home in Magnolia Ridge is in good condition with modern amenities and a spacious layout. It is move-in ready and would benefit from a fresh coat of paint on the exterior trim to enhance its curb appeal.
Value-add opportunities
- Resale Paint exterior trim — Enhances curb appeal and can increase property value.
- Rental Clean gutters — Keeps property in good condition and reduces maintenance costs for tenants.
Renovation cost estimate screening
Value-add ROI direction
- Resale Paint exterior trim — Enhances curb appeal and can increase property value. ↑
- Rental Clean gutters — Keeps property in good condition and reduces maintenance costs for tenants. ↑
ⓘ Cost ranges are severity-bucket heuristics (US national rule-of-thumb). Get contractor quotes + a written scope before underwriting a rehab budget.
Schools (NCES district)
- District
- Magnolia ISD
- NCES district ID
- 4828740
- Math proficiency
- 42% ▼ -7.00%
- Reading proficiency
- 45% ▼ -4.00%
- Median HH income
- $71,692
- Composite
- 39.46/100
- National rank
- #3958
- State rank
- #247 of 826 in TX
Livability — Magnolia
- Score
- 73/100
- State rank
- #222
- US rank
- #5442
Category grades
Schools grade is shown separately in the Schools card above.
Census & demographics
- Census place
- Magnolia, TX
- County
- Montgomery County · 663,713 people
- City population
- 32,847
- Metro
- Houston-The Woodlands-Sugar Land, TX
- Population (ZIP)
- 44,900
- Household income
- $112,504
- Rent vs Own
- Severe rent burden
- 586.0
Population outlook (Montgomery County) Hauer SSP2
- Today (2025)
- 713,896 people
- By 2030
- 805,263 · +12.8%
- By 2040
- 992,708 · +39.1%
- By 2050
- 1,179,590 · +65.2%
- By 2075
- 1,628,084 · +128.1%
- By 2100
- 1,937,880 · +171.5%
Race, ethnicity, and origin ACS 2023
- Neighborhood character
- Predominantly White (66%)
- Race & ethnicity
- White 66% Hispanic / Latino 25% Two or more races 18% Black 3% Asian 1%
- Hispanic origin (detail)
- Mexican 14% Puerto Rican 1%
- Common ancestry
- Lithuanian 4% Slovak 2% Italian 2%
- Foreign-born
- 11% · Canada, Vietnam
- Languages at home
- 83% English-only · Spanish 15% Other Indo-European 1% German/W. Germanic 1%
Political lean MEDSL · Montgomery
- 2024 margin
- Solid R (+45.5) · D 26.8% · R 72.3%
- 2008→2024 swing
- +7.2pp toward D · 2008: -52.7pp · 2024: -45.5pp
- All cycles
- 2024: R+45.5 2020: R+43.8 2016: R+51.4 2012: R+60.7 2008: R+52.7
Not yet ingested
- Civics
- —
Market trends
- HPI YoY
- ▲ 12.09%
- Current HPI
- 512.87
- Rent YoY
- ▲ 0.32%
- Metro
- Houston-The Woodlands-Sugar Land, TX
- State GDP YoY
- ▲ 3.95%
- F500 in state
- 110
Industry mix (Fortune 500 HQ in TX)
| Industry | F500 HQs | Revenue |
|---|---|---|
| Energy | 16 | $1,198B |
|
||
| Technology | 5 | $198B |
|
||
| Engineering / Construction | 4 | $72B |
|
||
| Energy Services | 3 | $60B |
|
||
| Utilities | 3 | $41B |
|
||
| Healthcare | 2 | $330B |
|
||
Price history
1 event — show timeline
- 2026-03-21 Listed $249,900 HARMLS
Property tax history
-1.3%/yrLatest (2025): $7,204 · -5.5% YoY. Source: county tax records.
Cash-flow waterfall
monthlySold comps — $/sqft
last 12 mo · ≤1 miLoading sold comps…