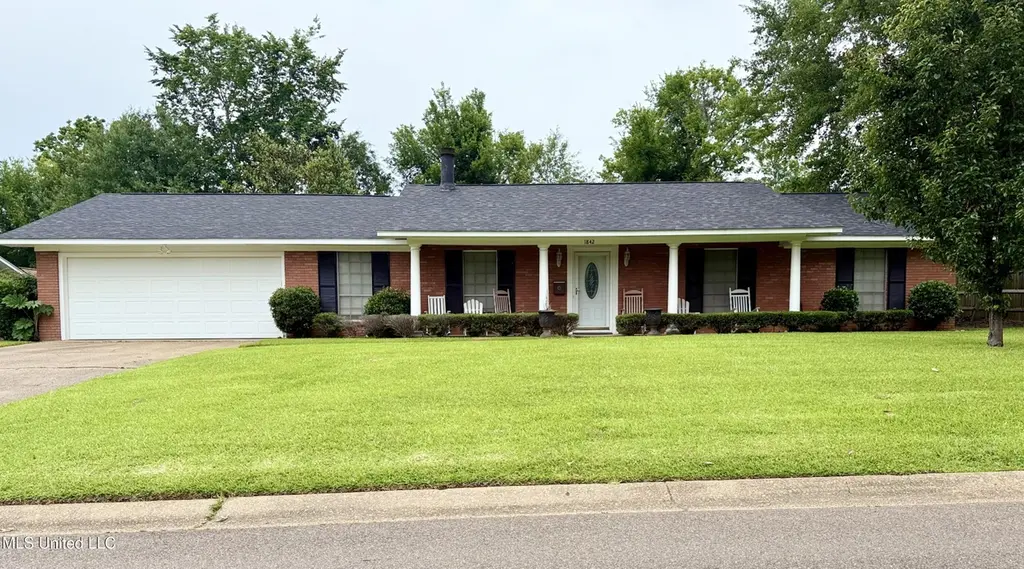
1842 Lake Trace Dr · Jackson, MS
Flood risk 1/10 · Minimal
- FEMA flood zone
- X (unshaded)
- Chance of flooding over 30 yrs
- 0.0%
- Est. flood insurance / yr
- $507 – $1,088
Fire risk 1/10 · Minimal
- Est. fire insurance / yr
- $1,241 – $2,305
Heat risk 7/10 · Major
- Hot days now (above 108°F)
- 7 days/yr
- Hot days in 30 yrs
- 21 days/yr
Wind risk 8/10 · Major
- Chance of severe wind over 30 yrs
- 80.0%
Air-quality risk 2/10 · Minimal
- Unhealthy air days now
- 0 days/yr
- Unhealthy air days in 30 yrs
- 1 days/yr
Risk factors via First Street. Map © Google.
Why this score? — see what drove the D- grade
The composite is a weighted blend of 9 inputs, each scored 0–100. Each bar is that input's sub-score; the figure is the points it added to the 100-point composite (weight × sub-score).
- Cash flow +14.5/30.0
- ARV discount +5.8/15.0
- Rent growth +4.5/5.0
- DSCR +4.4/10.0
- Livability +3.4/5.0
- 1% rule +2.8/10.0
- Condition / age +2.5/5.0
- Schools +1.1/10.0
- Appreciation +0.0/10.0
$249,900
🖨 Deal sheet (PDF) 📄 Offer letter ✓ Due diligence
Listing remarks MLS
Located in one of North Jackson's established and peaceful neighborhoods, this charming home offers an unbeatable opportunity for first-time buyers, savvy investors, or anyone looking to settle into a quiet, convenient location. With a little TLC, this home can truly shine and become a space anyone would be proud to call their own. Featuring a spacious foyer, nice layout, natural light, and a solid structure, the home is a beautiful canvas ready for your personal touch and updates. Enjoy the best of both worlds — tucked away in a serene, tree-lined neighborhood that feels private and secluded, yet just minutes from shopping, dining, schools, and major roadways. The yard is generously sized, perfect for outdoor entertaining, gardening, or relaxing in peace. Whether you're looking to make it your forever home or a valuable addition to your portfolio, this property is full of promise.
Key facts
- Natural light
- Spacious foyer
- Solid structure
Tags
Neighborhood map
What this means for you Summary
Snapshot
- This is a 3-bed/2.0-bath single-family listed at $250k.
Deal economics
- At list price, monthly cash flow is $57 ($681/yr) — positive.
- The deal already cash-flows at list — no discount required.
- To meet the 1% rule (rent ≥ 1% of price), the offer needs to be $195k (22.0% below list).
- Recommended offer: $195k (22.0% below list) — sets the bar for 1% rule.
- Cap rate 6.6% vs local median 9.9% in Jackson — below-typical yield; the buyer is paying a premium for something (appreciation thesis, condition, location) that the cap rate doesn't capture.
Location & tenants
- Location reads 68/100 on livability (#66 in MS) — a middle-class / working-renter tenant base. Strengths: commute A+, cost of living A+, housing A+; Watch: amenities F, employment F, health & safety F.
- Jackson Public School District (urban): math 9% / reading 18% proficiency, ranked #112 of 130 in MS (top 86%) — low school quality limits family demand, transient renter base, plan for 1-2y turnover; 88% free/reduced lunch — lower-income household profile, screen leases tightly.
- Zoned schools: Mc Leod Elementary School (math 8% / reading 26%, grade F, #259 of 375 statewide, top 71%, 378 students, 100% FRL); Chastain Middle School (math 5% / reading 11%, grade F, #165 of 179 statewide, top 93%, 499 students, 100% FRL); Murrah High School (math 12% / reading 27%, grade F, #130 of 197 statewide, top 68%, 1,326 students, 100% FRL).
- Market conditions: Rents rising fast (+7.9%/yr); 221 active listings in the ZIP; 16 comparable units currently listed for rent nearby; rentals at typical pace (median 23d on market — plan ~3-4 weeks tenant-placement turnaround); 167 units permitted in Hinds County in 2024 (0 in 5+ unit buildings).
- This rent runs 34% of the median local income ($69k/yr) — at the standard rent-burdened threshold; future hikes will face affordability resistance.
Forward outlook
- Local home prices are declining (-3.0%/yr); year-one equity from $2k of loan paydown is wiped out by about $7k of value loss. Plan a longer hold.
- Hinds County population projected to shrink 6% by 2050 — rents likely to lag national; underwrite the cash flow, not the appreciation.
Negotiation context
- It's been on market 379 days — a 12% lower offer ($220k) is reasonable based on typical stale-listing flexibility.
- 7 sale attempts since 20y ago; this cycle's ask has dropped $15k (6%) from the opening price — seller is motivated, your offer sets the floor, not the list.
Risks & watch-outs
- Climate carrying-cost: severe wind risk, 80% chance of damaging wind over 30y; extreme-heat days projected 7→21/yr by 2055 (HVAC capex compounding) — expect insurance premiums to compound above CPI over the hold.
Questions for the listing agent
- It's been on market 379 days. Have you received any prior offers? Is the seller open to a 22% concession, seller financing, or rate buy-down credit?
- Built in 1968 — when were the roof, HVAC, electrical panel, plumbing, and water heater last replaced?
- What does the HOA fee cover, when was the last increase, and are there any pending special assessments or reserve-fund shortfalls?
- Why hasn't it sold? Are there any deal-killer items the seller is aware of (foundation, flood, title, zoning, code violations)?
- Is there a deadline driving the sale (1031 exchange, divorce, estate, relocation)? That informs how much negotiation room exists.
- Schools are F-rated, which usually means shorter tenancies and higher turnover. Who's the typical renter profile here, and what's been the actual vacancy rate?
- The area grade is low — what's the realistic commute time and amenity access for the typical tenant pool here? Any planned neighborhood developments (good or bad) we should know about?
- What's the average days-on-market for RENTAL listings here right now (not sales)? A rising rental-DOM trend means longer vacancies and softer asking-rent achievability than the comps imply.
- What's the recent tenant-quality profile in this submarket — average credit score on applications, eviction rate, late-payment / NSF rate, and stable-employment percentage? A property-management company in the area should have these aggregated.
- How much new for-sale + rental construction is in the pipeline within 1–3 miles? Heavy new supply typically softens prices + rents 12–24 months out; constrained supply supports both.
Investment metrics
- 1% rule
- 0.78% ✗
- Cap rate
- 6.57%
- Cash-on-cash
- 0.97%
- DSCR
- 1.04
- GRM
- 10.7
CMA / ARV
- ARV (median comp)
- $241,033
- List price
- $249,900
- Delta
- 3.68%
- Verdict
- FAIR
- Comps
- 20 within 1.0 mi
Show comp detail 12 sales within ~0.75 mi
| Address | Dist | Beds/Ba | Sqft | Sold | Price | $/sf | Match |
|---|---|---|---|---|---|---|---|
| 5846 Baxter Dr | 0.14mi | 3/2.0 | 2,027 (+3%) | 5mo | $254,500 | $126 | 85 |
| 5984 Libby Ln | 0.20mi | 3/2.0 | 2,041 (+4%) | 6mo | $245,000 | $120 | 79 |
| 810 Colonial Cir | 0.28mi | 3/2.5 | 1,952 (-1%) | 6mo | $197,000 | $101 | 78 |
| 1534 Tracewood Dr | 0.44mi | 3/2.0 | 1,926 (-2%) | 2mo | $243,350 | $126 | 74 |
| 1431 Tracewood Dr | 0.51mi | 3/2.0 | 2,009 (+2%) | 2mo | $229,900 | $114 | 71 |
| 1810 Lake Trace Dr | 0.12mi | 3/2.0 | 1,702 (-14%) | 2mo | $240,000 | $141 | 70 |
| 11 Pear Orchard Park | 0.32mi | 3/2.0 | 1,793 (-9%) | 4mo | $229,900 | $128 | 67 |
| 5854 Canton Park Dr | 0.57mi | 3/1.0 | 1,838 (-7%) | 1mo | $169,000 | $92 | 58 |
| 5812 Concord Dr | 0.63mi | 3/2.0 | 1,796 (-9%) | 4mo | $106,000 | $59 | 53 |
| 5863 Canton Park Dr | 0.54mi | 4/2.0 (+1) | 1,703 (-13%) | 4mo | $84,000 | $49 | 44 |
| 404 Colonial Cir | 0.70mi | 3/2.0 | 1,689 (-14%) | 1mo | $185,000 | $110 | 43 |
| 412 Colonial Cir | 0.66mi | 3/2.0 | 1,700 (-14%) | 6mo | $165,000 | $97 | 42 |
Match score weights: distance 35% · size 25% · config 20% · recency 20%. Top-matched comps best support the ARV.
Projected returns pro-forma
-3.0% appreciation · 7.9% rent growth · sell at horizon
- IRR
- -10.1%
- Equity multiple
- 0.62×
- Total profit
- $-26,910
- Equity at exit
- $37,261
- IRR
- 4.4%
- Equity multiple
- 1.38×
- Total profit
- $26,561
- Equity at exit
- $21,607
Cash invested: $69,972 (down + closing). Projections, not guarantees.
Landlord ↔ Tenant lean methodology
- Overall (STATE)
- 90 Strongly Landlord-Friendly
- State Mississippi
- 90 Strongly Landlord-Friendly · R+11
- County
- — inherits STATE
- City
- — inherits STATE
ZIP-level market 39211
- Rents YoY
- 7.9%
- Active inventory
- 221
- Price-to-rent
- 10.7×
Monthly cashflow live
- Estimated rent
- $1,950 high interval (Pro) →
- Mortgage (P&I)
- −$1,311
- Tax from tax record
- −$65 /mo · $783/yr
- Insurance
- −$104
- HOA
- −$4
- Vacancy / Maint / Mgmt
- −$410
- Net cashflow
- $57
Break-even live
Sensitivity live
| Price | -10% $198 | -5% $127 | +0% $57 | +5% $-14 | +10% $-85 |
|---|---|---|---|---|---|
| Rent | -10% $-97 | -5% $-20 | +0% $57 | +5% $134 | +10% $211 |
| Rate | -1.0pp $183 | -0.5pp $120 | base $57 | +0.5pp $-8 | +1.0pp $-74 |
UW: 25.0% down · 7.5% · 30yr · 1.5% tax · 5.0% vac · 8.0% maint · 8.0% mgmt
Financing live
Cash to close
- Down payment
- $62,475
- Closing costs
- $7,497
- Reserves months
- —
- Total cash needed
- —
Loan-product check · same deal, 3 products live
Conventional
25% down · 7.5% · 30yr
- Down + closing
- —
- Monthly P&I
- —
- Monthly cashflow
- —
- DSCR
- —
- Eligible?
- —
Personal DTI + credit; lowest rate.
DSCR
20% down · 8.5% · 30yr
- Down + closing
- —
- Monthly P&I
- —
- Monthly cashflow
- —
- DSCR
- —
- Eligible?
- —
No personal income docs; deal must DSCR.
Hard money
10% down · 12.0% · 12mo
- Down + closing
- —
- Monthly P&I
- —
- Monthly cashflow
- —
- DSCR
- —
- Eligible?
- —
Short-term bridge; refi at stabilization.
Rent comps 16 comps
| Address | Beds | Baths | Sqft | Rent | $/sqft | DOM | Units | Dist |
|---|---|---|---|---|---|---|---|---|
| 2009 Lake Trace Dr Jackson, MS | 4.0 | 2.0 | 2028 | $1,950 | $0.96 | 15d | 1 | 0.14mi |
| 47 Moss Forest Cir Jackson, MS | 4.0 | 3.0 | 2624 | $3,000 | $1.14 | 15d | 1 | 0.45mi |
| 5855 Canton Park Dr Jackson, MS | 4.0 | 2.0 | 2401 | $1,675 | $0.70 | 15d | 1 | 0.54mi |
| 5855 Canton Park Dr Jackson, MS | 4.0 | 2.0 | 1955 | $1,675 | $0.86 | 25d | 1 | 0.54mi |
| 117 Rolling Creek Dr Jackson, MS | 4.0 | 2.5 | 2459 | $2,700 | $1.10 | 25d | 1 | 0.64mi |
| 119 S Canton Club Cir Jackson, MS | 3.0 | 2.0 | 1444 | $1,595 | $1.10 | 25d | 1 | 0.65mi |
| 120 Parkway Dr Jackson, MS | 1.0–3.0 | 1.0–2.0 | 1076 | $2,255 | $2.10 | 15d | 15 | 0.73mi |
| 51 Northtown Dr Unit 001G Jackson, MS | 3.0 | 2.0 | 1260 | $1,449 | $1.15 | 15d | 1 | 0.75mi |
| 1620 E County Line Rd Ridgeland, MS | 1.0–3.0 | 1.0–2.5 | 1126 | $1,595 | $1.42 | 15d | 7 | 0.83mi |
| 51 Northtown Dr Unit 001B Jackson, MS | 3.0 | 2.0 | 1260 | $1,499 | $1.19 | 15d | 1 | 0.98mi |
| 51 Northtown Dr Unit 002G Jackson, MS | 3.0 | 2.0 | 1260 | $1,644 | $1.30 | 45d | 1 | 0.98mi |
| 51 Northtown Dr Unit 001F Jackson, MS | 3.0 | 2.0 | 1260 | $1,644 | $1.30 | 15d | 1 | 0.98mi |
| 51 Northtown Dr Unit 021A Jackson, MS | 3.0 | 2.0 | 1500 | $1,694 | $1.13 | 23d | 1 | 0.98mi |
| 35 Meadowoods Ter Jackson, MS | 3.0 | 2.0 | 1269 | $1,450 | $1.14 | 25d | 1 | 1.03mi |
| 1702 Jamestown Way Unit 1702 Jackson, MS | 3.0 | 2.0 | 1465 | $1,495 | $1.02 | 45d | 1 | 1.16mi |
| 5538 Pine Lane Dr Jackson, MS | 3.0 | 2.0 | 1627 | $1,465 | $0.90 | 45d | 1 | 1.47mi |
HOA detail
- Monthly dues
- $4 · $48/yr
Listing history 22 events
-
2026-05-30days on market $249,900 Active 379 DOM
-
2026-02-06price $249,900 909-char remark
Show marketing remark (909 chars)
Located in one of North Jackson's established and peaceful neighborhoods, this charming home offers an unbeatable opportunity for first-time buyers, savvy investors, or anyone looking to settle into a quiet, convenient location. With a little TLC, this home can truly shine and become a space anyone would be proud to call their own. Featuring a spacious foyer, nice layout, natural light, and a solid structure, the home is a beautiful canvas ready for your personal touch and updates. Enjoy the best of both worlds — tucked away in a serene, tree-lined neighborhood that feels private and secluded, yet just minutes from shopping, dining, schools, and major roadways. The yard is generously sized, perfect for outdoor entertaining, gardening, or relaxing in peace. Whether you're looking to make it your forever home or a valuable addition to your portfolio, this property is full of promise.
-
2025-09-08price $260,000 909-char remark
Show marketing remark (909 chars)
Located in one of North Jackson's established and peaceful neighborhoods, this charming home offers an unbeatable opportunity for first-time buyers, savvy investors, or anyone looking to settle into a quiet, convenient location. With a little TLC, this home can truly shine and become a space anyone would be proud to call their own. Featuring a spacious foyer, nice layout, natural light, and a solid structure, the home is a beautiful canvas ready for your personal touch and updates. Enjoy the best of both worlds — tucked away in a serene, tree-lined neighborhood that feels private and secluded, yet just minutes from shopping, dining, schools, and major roadways. The yard is generously sized, perfect for outdoor entertaining, gardening, or relaxing in peace. Whether you're looking to make it your forever home or a valuable addition to your portfolio, this property is full of promise.
-
2025-05-15$265,000 Active 909-char remark
Show marketing remark (909 chars)
Located in one of North Jackson's established and peaceful neighborhoods, this charming home offers an unbeatable opportunity for first-time buyers, savvy investors, or anyone looking to settle into a quiet, convenient location. With a little TLC, this home can truly shine and become a space anyone would be proud to call their own. Featuring a spacious foyer, nice layout, natural light, and a solid structure, the home is a beautiful canvas ready for your personal touch and updates. Enjoy the best of both worlds — tucked away in a serene, tree-lined neighborhood that feels private and secluded, yet just minutes from shopping, dining, schools, and major roadways. The yard is generously sized, perfect for outdoor entertaining, gardening, or relaxing in peace. Whether you're looking to make it your forever home or a valuable addition to your portfolio, this property is full of promise.
-
2021-10-02historical
-
2016-02-19soldstatus
-
2016-02-19soldstatus
-
2015-07-15$117,810
-
2015-02-12soldstatus
-
2012-01-09soldstatus
-
2012-01-09soldstatus
-
2011-08-26$147,500
-
2009-03-09soldstatus
-
2009-02-25soldstatus
-
2008-11-04$93,900
-
2008-10-30historical
-
2008-08-06$93,900
-
2008-04-04$135,000
-
2006-08-04soldstatus
-
2006-08-04soldstatus
-
2006-05-01$156,000
-
1984-01-25soldstatus
ⓘ Source: listings_history table (triggers on properties + properties_extension) + one-shot
backfill from property_details.listing_events for pre-trigger history.
Tax reassessment forecast MS · Resets to sale price
- Current annual tax
- $783 · $65/mo
- Projected year-2 tax
- $1,974 · $165/mo
- Expected delta
- +$1,191/yr (+$99/mo · 152.2%)
ⓘ Screening estimate from a state-policy table — verify with the county assessor before closing.
Climate risk First Street
- Flood 1/10 Low FEMA zone X (unshaded) · 0% chance over 30 yrs
- Wildfire 1/10 Low
- Heat 7/10 Severe 7 d/yr ≥108°F today · 21 d/yr by 30 yrs out
- Wind 8/10 Severe 80% chance of damaging wind over 30 yrs
- Air quality 2/10 Low 0 unhealthy d/yr today · 1 by 30 yrs out
Nearby sold comps map
Loading sold comps map…
Walkable amenities ~0.75 mi
Loading nearby amenities…
Taxation est. · year 1
- Rental income
- $23,402
- − Mortgage interest
- −$13,998
- − Property taxes
- −$783
- − Insurance
- −$1,250
- − Repairs & maintenance
- −$1,872
- − Management
- −$1,872
- − HOA
- −$48
- − Depreciation
- −$7,270
- Taxable loss
- −$3,691
- Est. tax savings @ 24.0%
- +$886
- After-tax cash flow
- $1,567/yr
For passive investors: Depreciation is non-cash, so a rental often shows a tax loss while cash-flowing — sheltering income. Rental losses are passive: they offset passive income freely, and up to $25,000/yr can offset ordinary (W-2) income if you actively participate and your MAGI is under $100k (phasing out to $0 by $150k); unused losses carry forward. On sale, claimed depreciation is recaptured at up to 25%, and gains may owe capital-gains tax (a 1031 exchange can defer both). Figures are a year-1 estimate at your 24.0% rate — not tax advice; consult a CPA.
Schools (NCES district)
- District
- Jackson Public School District
- NCES district ID
- 2802190
- Math proficiency
- 9% ▼ -14.00%
- Reading proficiency
- 18% ▼ -7.00%
- Median HH income
- $33,234
- Composite
- 10.89/100
- National rank
- #9755
- State rank
- #112 of 130 in MS
Livability — Jackson
- Score
- 68/100
- State rank
- #66
- US rank
- #9695
Category grades
Schools grade is shown separately in the Schools card above.
Census & demographics
- Census place
- Jackson, MS
- County
- Hinds County · 167,040 people
- City population
- 140,204
- Metro
- Jackson, MS
- Population (ZIP)
- 23,838
- Household income
- $69,426
- Rent vs Own
- Severe rent burden
- 736.0
Population outlook (Hinds County) Hauer SSP2
- Today (2025)
- 242,528 people
- By 2030
- 241,113 · -0.6%
- By 2040
- 235,557 · -2.9%
- By 2050
- 226,946 · -6.4%
- By 2075
- 199,995 · -17.5%
- By 2100
- 164,165 · -32.3%
Race, ethnicity, and origin ACS 2023
- Neighborhood character
- Majority Black (59%)
- Race & ethnicity
- Black 59% White 36% Hispanic / Latino 3% Two or more races 2%
- Common ancestry
- Serbian 2% Italian 2% Slovak 1%
- Foreign-born
- 2% · Canada, China
- Languages at home
- 96% English-only · Spanish 3% Chinese 1%
Political lean MEDSL · Hinds
- 2024 margin
- Solid D (+46.1) · D 72.4% · R 26.3% · Other 1.4%
- 2008→2024 swing
- +7.1pp toward D · 2008: 39.0pp · 2024: 46.1pp
- All cycles
- 2024: D+46.1 2020: D+48.3 2016: D+43.7 2012: D+45.1 2008: D+39.0
Not yet ingested
- Civics
- —
Market trends
- HPI YoY
- ▼ -135.99%
- Current HPI
- 145.5192
- Rent YoY
- ▲ 7.90%
- Metro
- Jackson, MS
- State GDP YoY
- —
- F500 in state
- 0
Price history
+60.2% since first listed21 events — show timeline
- 2026-02-06 Price Changed $249,900 MLSU
- 2025-09-08 Price Changed $260,000 MLSU
- 2025-05-15 Listed $265,000 MLSU
- 2021-10-02 Listing Removed — MLSU
- 2016-02-19 Sold (Public Records) — Public Records
- 2016-02-19 Sold (MLS) — MLSU
- 2015-07-15 Listed $117,810 MLSU
- 2015-02-12 Sold (Public Records) — Public Records
- 2012-01-09 Sold (Public Records) — Public Records
- 2012-01-09 Sold (MLS) — MLSU
- 2011-08-26 Listed $147,500 MLSU
- 2009-03-09 Sold (MLS) — MLSU
- 2009-02-25 Sold (Public Records) — Public Records
- 2008-11-04 Listed $93,900 MLSU
- 2008-10-30 Listing Removed — MLSU
- 2008-08-06 Listed $93,900 MLSU
- 2008-04-04 Listed $135,000 MLSU
- 2006-08-04 Sold (Public Records) — Public Records
- 2006-08-04 Sold (MLS) — MLSU
- 2006-05-01 Listed $156,000 MLSU
- 1984-01-25 Sold (Public Records) — Public Records
Property tax history
-6.9%/yrLatest (2025): $783 · +3.9% YoY. Source: county tax records.
Cash-flow waterfall
monthlySold comps — $/sqft
last 12 mo · ≤1 miLoading sold comps…