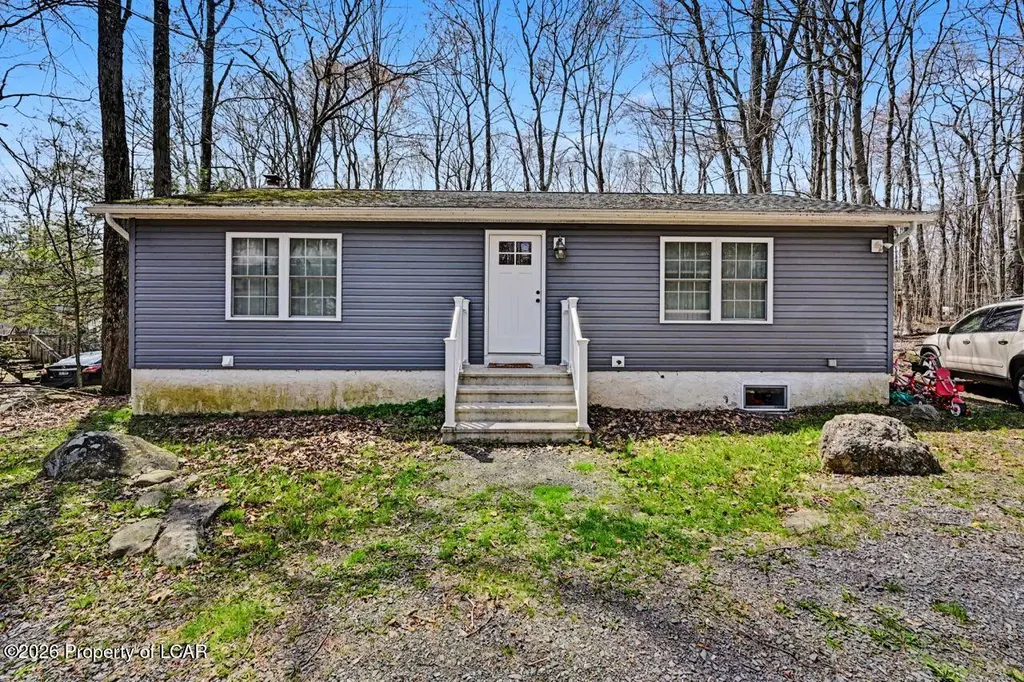
16 Lily Ln · Big Bass Lake, PA
Flood risk 1/10 · Minimal
- FEMA flood zone
- X (unshaded)
- Chance of flooding over 30 yrs
- 0.0%
- Est. flood insurance / yr
- $473 – $860
Fire risk 3/10 · Minor
- Est. fire insurance / yr
- $511 – $949
Heat risk 2/10 · Minimal
- Hot days now (above 90°F)
- 7 days/yr
- Hot days in 30 yrs
- 17 days/yr
Wind risk 3/10 · Minor
- Chance of severe wind over 30 yrs
- 5.0%
Air-quality risk 2/10 · Minimal
- Unhealthy air days now
- 1 days/yr
- Unhealthy air days in 30 yrs
- 2 days/yr
Risk factors via First Street. Map © Google.
Why this score? — see what drove the C- grade
The composite is a weighted blend of 9 inputs, each scored 0–100. Each bar is that input's sub-score; the figure is the points it added to the 100-point composite (weight × sub-score).
- Cash flow +12.3/30.0
- Appreciation +9.2/10.0
- ARV discount +8.0/15.0
- Schools +5.0/10.0
- DSCR +3.6/10.0
- 1% rule +3.5/10.0
- Livability +3.5/5.0
- Rent growth +2.5/5.0
- Condition / age +2.5/5.0
$235,000
🖨 Deal sheet 📄 Offer letter ✓ Due diligence
Listing remarks
Welcome to this stunning 4-bedroom, 2-bath modern ranch tucked away in the desirable Thornhurst Country Club Estates. Designed with clean lines and contemporary finishes, this home offers effortless one-floor living with the added bonus of a fully finished basement--perfect for entertaining, a home gym, or additional living space.
Key facts
- One-floor living
- 5,000 sq ft lot
- Listed 13 days
Tags
Property features AI
Finance
- Other: Virtual tour available through external link
- Financial info: Annual tax amount listed (amount excluded per instructions)
- HOA & community: No HOA or community fee information provided
Exterior
- Parking: No parking details provided
- Security: No security details provided
- Utilities: Public water; Public sewer
- Home design: Single-family residence; One level
- Construction: Vinyl siding; Above-grade finished area around 1,800; Basement (finished)
- Exterior features: Lot in Country Club Estates subdivision; Lot dimensions approximately 100 x 50; Residential zoning
Interior
- Kitchen: Eat-in kitchen
- Bedrooms: Information on specific bedroom count or levels not provided
- Flooring: No flooring details provided
- Bathrooms: 2 full bathrooms
- Heating & cooling: Electric heating; Baseboard heat
- Interior features: Eat-in kitchen; Finished basement; Total of 8 rooms
- Laundry & utility: No laundry details provided
Neighborhood map
What this means for you Summary
Snapshot
- This is a 4-bed/2.0-bath single-family listed at $235k.
Deal economics
- At list price, monthly cash flow is $-44 ($-528/yr) — negative.
- To cash-flow at today's rent, offer at most $229k (2.7% below list).
- To meet the 1% rule (rent ≥ 1% of price), the offer needs to be $200k (14.9% below list).
- Recommended offer: $200k (14.9% below list) — sets the bar for 1% rule.
- Cap rate 6.1% vs local median 3.8% in Big Bass Lake — top-decile yield for the area; either an underpriced asset or a hidden risk that comps aren't pricing in. Stress-test before assuming the spread holds.
Location & tenants
- Location reads 70/100 on livability (#763 in PA) — a middle-class / working-renter tenant base. Strengths: crime A+, cost of living A+, housing B+; Watch: schools D-, amenities F, commute F.
- North Pocono SD (rural): math 45% / reading 71% proficiency, ranked #82 of 539 in PA (top 15%) — acceptable for families but not a draw, mixed tenant base, ~2y average lease.
- Market conditions: 299 active listings in the ZIP; 1 comparable units currently listed for rent nearby; 251 units permitted in Lackawanna County in 2024 (0 in 5+ unit buildings).
Forward outlook
- In year one you build about $21k of equity ($2k loan paydown + $20k appreciation (8.4% local appreciation)).
- Lackawanna County population projected to shrink 4% by 2050 — rents likely to lag national; underwrite the cash flow, not the appreciation.
- At projected returns (8.4% appreciation + 3.0% rent growth), your $66k cash investment doubles in ~3 years — after that, you're playing with house money.
- By year 2, paydown + projected appreciation supports a ~$34k cash-out refi (75% LTV) — recoverable capital for the next deal without selling this one.
Negotiation context
- Only 13 days on market — expect competitive offers; lowballing is unlikely to land.
- Current owner paid $130k; list at $235k implies a 81% gain — meaningful room to come down on a strong offer.
Questions for the listing agent
- What do current leases actually rent for vs. the listed asking? Can we see a recent rent roll and the last 12 months of T-12 income?
- Is there a deadline driving the sale (1031 exchange, divorce, estate, relocation)? That informs how much negotiation room exists.
- Schools are D-rated, which usually means shorter tenancies and higher turnover. Who's the typical renter profile here, and what's been the actual vacancy rate?
- What's the average days-on-market for RENTAL listings here right now (not sales)? A rising rental-DOM trend means longer vacancies and softer asking-rent achievability than the comps imply.
- What's the recent tenant-quality profile in this submarket — average credit score on applications, eviction rate, late-payment / NSF rate, and stable-employment percentage? A property-management company in the area should have these aggregated.
- How much new for-sale + rental construction is in the pipeline within 1–3 miles? Heavy new supply typically softens prices + rents 12–24 months out; constrained supply supports both.
Investment metrics
- 1% rule
- 0.85% ✗
- Cap rate
- 6.07%
- Cash-on-cash
- -0.80%
- DSCR
- 0.96
- GRM
- 9.8
CMA / ARV
- ARV (median comp)
- $237,478
- List price
- $235,000
- Delta
- -1.04%
- Verdict
- FAIR
- Comps
- 20 within 1.0 mi
Show comp detail 8 sales within ~0.75 mi
| Address | Dist | Beds/Ba | Sqft | Sold | Price | $/sf | Match |
|---|---|---|---|---|---|---|---|
| 81 Elderberry Dr | 0.10mi | 3/2.0 (-1) | 1,828 (+2%) | 7mo | $235,000 | $129 | 82 |
| 20 Floral Dr | 0.16mi | 5/2.0 (+1) | 1,725 (-4%) | 6mo | $226,497 | $131 | 75 |
| 233 Nadine Ln | 0.16mi | 4/2.5 | 1,632 (-9%) | 11mo | $178,000 | $109 | 66 |
| 44 Magnolia Dr | 0.33mi | 3/2.0 (-1) | 1,700 (-6%) | 7mo | $285,000 | $168 | 64 |
| 50 Hagen Run Dr | 0.14mi | 4/3.5 | 1,963 (+9%) | 17mo | $150,000 | $76 | 58 |
| 44 Magnolia Unit L 431 | 0.33mi | 3/2.0 (-1) | 1,700 (-6%) | 20mo | $125,000 | $74 | 53 |
| 24 Cedar Ln | 0.29mi | 3/3.0 (-1) | 1,989 (+10%) | 15mo | $235,000 | $118 | 47 |
| 27 Magnolia Dr | 0.35mi | 4/2.0 | 2,016 (+12%) | 20mo | $220,000 | $109 | 47 |
Match score weights: distance 35% · size 25% · config 20% · recency 20%. Top-matched comps best support the ARV.
Projected returns pro-forma
8.45% appreciation · 3.0% rent growth · sell at horizon
- IRR
- 20.4%
- Equity multiple
- 2.53×
- Total profit
- $100,918
- Equity at exit
- $185,861
- IRR
- 18.8%
- Equity multiple
- 5.49×
- Total profit
- $295,414
- Equity at exit
- $376,146
Cash invested: $65,800 (down + closing). Projections, not guarantees.
Landlord ↔ Tenant lean methodology
- Overall (STATE)
- 62 Landlord-Friendly
- State Pennsylvania
- 62 Landlord-Friendly · EVEN
- County
- — inherits STATE
- City
- — inherits STATE
ZIP-level market 18424
- Home prices YoY
- 2.2%
- Active inventory
- 299
- Price-to-rent
- 9.8×
Monthly cashflow live
- Estimated rent
- $2,000 medium interval (Pro) →
- Mortgage (P&I)
- −$1,232
- Tax est. 1.5%
- −$294 /mo · $3,525/yr
- Insurance
- −$98
- HOA
- −$0
- Vacancy / Maint / Mgmt
- −$420
- Net cashflow
- $-44
Break-even live
UW: 25.0% down · 7.5% · 30yr · 1.5% tax · 5.0% vac · 8.0% maint · 8.0% mgmt
Financing live
Cash to close
- Down payment
- $58,750
- Closing costs
- $7,050
- Reserves months
- —
- Total cash needed
- —
Loan-product check · same deal, 3 products live
Conventional
25% down · 7.5% · 30yr
- Down + closing
- —
- Monthly P&I
- —
- Monthly cashflow
- —
- DSCR
- —
- Eligible?
- —
Personal DTI + credit; lowest rate.
DSCR
20% down · 8.5% · 30yr
- Down + closing
- —
- Monthly P&I
- —
- Monthly cashflow
- —
- DSCR
- —
- Eligible?
- —
No personal income docs; deal must DSCR.
Hard money
10% down · 12.0% · 12mo
- Down + closing
- —
- Monthly P&I
- —
- Monthly cashflow
- —
- DSCR
- —
- Eligible?
- —
Short-term bridge; refi at stabilization.
Rent comps 1 comps
| Address | Beds | Baths | Sqft | Rent | $/sqft | DOM | Units | Dist |
|---|---|---|---|---|---|---|---|---|
| 125 Magnolia Dr Gouldsboro, PA | 3.0 | 2.0 | 1583 | $2,000 | $1.26 | 13d | 1 | 0.29mi |
Listing history 7 events
-
2026-05-07status Pending 332-char remark
-
2026-04-24$235,000 Active 332-char remark
-
2026-03-24price $230,000
-
2025-06-25price $239,900
-
2011-01-31soldstatus $130,000
-
2008-04-21soldstatus $84,455
-
2005-08-02soldstatus $100,000
ⓘ Source: listings_history table (triggers on properties + properties_extension) + one-shot
backfill from property_details.listing_events for pre-trigger history.
Climate risk First Street
- Flood 1/10 Low FEMA zone X (unshaded) · 0% chance over 30 yrs
- Wildfire 3/10 Moderate
- Heat 2/10 Low 7 d/yr ≥90°F today · 17 d/yr by 30 yrs out
- Wind 3/10 Moderate 5% chance of damaging wind over 30 yrs
- Air quality 2/10 Low 1 unhealthy d/yr today · 2 by 30 yrs out
Nearby sold comps map
Loading sold comps map…
Walkable amenities ~0.75 mi
Loading nearby amenities…
Taxation est. · year 1
- Rental income
- $24,000
- − Mortgage interest
- −$13,164
- − Property taxes
- −$3,525
- − Insurance
- −$1,175
- − Repairs & maintenance
- −$1,920
- − Management
- −$1,920
- − Depreciation
- −$6,836
- Taxable loss
- −$4,540
- Est. tax savings @ 24.0%
- +$1,090
- After-tax cash flow
- $561/yr
For passive investors: Depreciation is non-cash, so a rental often shows a tax loss while cash-flowing — sheltering income. Rental losses are passive: they offset passive income freely, and up to $25,000/yr can offset ordinary (W-2) income if you actively participate and your MAGI is under $100k (phasing out to $0 by $150k); unused losses carry forward. On sale, claimed depreciation is recaptured at up to 25%, and gains may owe capital-gains tax (a 1031 exchange can defer both). Figures are a year-1 estimate at your 24.0% rate — not tax advice; consult a CPA.
Schools (NCES district)
- District
- North Pocono SD
- NCES district ID
- 4217310
- Math proficiency
- 45% ▼ -9.00%
- Reading proficiency
- 71% ▼ -2.00%
- Median HH income
- $59,555
- Composite
- 50.23/100
- National rank
- #1894
- State rank
- #82 of 539 in PA
Livability — Big Bass Lake
- Score
- 70/100
- State rank
- #763
- US rank
- #7622
Category grades
Schools grade is shown separately in the Schools card above.
Census & demographics
- Population (ZIP)
- 5,076
Population outlook (Lackawanna County) Hauer SSP2
- Today (2025)
- 210,652 people
- By 2030
- 208,623 · -1.0%
- By 2040
- 203,980 · -3.2%
- By 2050
- 201,069 · -4.5%
- By 2075
- 205,026 · -2.7%
- By 2100
- 210,851 · +0.1%
Race, ethnicity, and origin ACS 2023
- Neighborhood character
- Predominantly White (89%)
- Race & ethnicity
- White 89% Two or more races 6% Hispanic / Latino 5% Black 1%
- Hispanic origin (detail)
- Puerto Rican 2% Dominican 1% Salvadoran 1%
- Common ancestry
- Romanian 11% Iranian 6% Scotch-Irish 3%
- Foreign-born
- 3% · Canada, Dominican Republic
- Languages at home
- 97% English-only · Spanish 2% Other Indo-European 1%
Political lean MEDSL · Lackawanna
- 2024 margin
- Toss-up / Even · D 51.0% · R 48.3%
- 2008→2024 swing
- -23.2pp toward R · 2008: 26.0pp · 2024: 2.8pp
- All cycles
- 2024: D+2.8 2020: D+8.4 2016: D+3.4 2012: D+27.4 2008: D+26.0
Not yet ingested
- Civics
- —
Market trends
- HPI YoY
- ▲ 8.45%
- Current HPI
- 399.903
- Rent YoY
- —
- Metro
- —
- State GDP YoY
- ▲ 1.68%
- F500 in state
- 34
Industry mix (Fortune 500 HQ in PA)
| Industry | F500 HQs | Revenue |
|---|---|---|
| Healthcare | 2 | $309B |
|
||
| Insurance | 2 | $27B |
|
||
| Telecommunications / Media | 1 | $124B |
|
||
| Industrial Distribution | 1 | $22B |
|
||
| Financial Services | 1 | $20B |
|
||
| Chemicals / Materials | 1 | $18B |
|
||
Price history
+135.0% since first listed7 events — show timeline
- 2026-05-07 Pending — LCAR
- 2026-04-24 Listed $235,000 LCAR
- 2026-03-24 Price Changed $230,000 LCAR
- 2025-06-25 Price Changed $239,900 LCAR
- 2011-01-31 Sold (Public Records) $130,000 Public Records
- 2008-04-21 Sold (Public Records) $84,455 Public Records
- 2005-08-02 Sold (Public Records) $100,000 Public Records
Property tax history
+26.9%/yrLatest (2026): $43,503 · +967.6% YoY. Source: county tax records.
Cash-flow waterfall
monthlySold comps — $/sqft
last 12 mo · ≤1 miLoading sold comps…