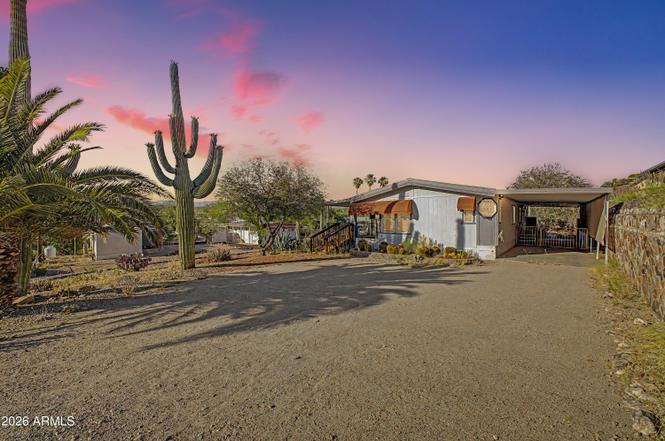
401 E Queen Creek Dr · Queen Valley, AZ
Flood risk 4/10 · Minor
- FEMA flood zone
- X (unshaded)
- Chance of flooding over 30 yrs
- 0.24%
- Est. flood insurance / yr
- $507 – $1,088
Fire risk 7/10 · Major
- Est. fire insurance / yr
- $610 – $1,132
Heat risk 8/10 · Major
- Hot days now (above 108°F)
- 7 days/yr
- Hot days in 30 yrs
- 18 days/yr
Wind risk 1/10 · Minimal
- Chance of severe wind over 30 yrs
- —
Air-quality risk 2/10 · Minimal
- Unhealthy air days now
- 1 days/yr
- Unhealthy air days in 30 yrs
- 1 days/yr
Risk factors via First Street. Map © Google.
Why this score? — see what drove the D+ grade
The composite is a weighted blend of 9 inputs, each scored 0–100. Each bar is that input's sub-score; the figure is the points it added to the 100-point composite (weight × sub-score).
- ARV discount +15.0/15.0
- Cash flow +13.7/30.0
- DSCR +4.1/10.0
- 1% rule +3.8/10.0
- Livability +2.6/5.0
- Rent growth +2.5/5.0
- Condition / age +2.5/5.0
- Schools +1.5/10.0
- Appreciation +0.0/10.0
$200,000
🖨 Deal sheet (PDF) 📄 Offer letter ✓ Due diligence
Listing remarks MLS
Stop and look ! Pride of ownership is evident inside and out. Owner newly installed the AC and heating system in April of 2021. New roof coating, new steps to deck ,new flooring,, new custom baseboards, so many upgrades! The backyard is fenced, includes carport and a large out building that can be used as a craft room, 3rd bedroom, office or mancave. Sit on your front deck and enjoy the mountain views and beautiful sunsets. Great curb appeal on this corner lot.
Key facts
- 7,675 sq ft lot
- 4 parking spots
- Community pool
Property features AI
Finance
- Other: Lot approximately 7,675 sq. ft. (assessor)
- Financial info: Current financing: FHA
- HOA & community: No association fees
Exterior
- Parking: 2 covered parking spaces; 2 open parking spaces; 2 carport spaces
- Utilities: City water; Public sewer
- Home design: Manufactured / Mobile home; Fee simple ownership
- Construction: Vinyl siding and painted wood frame construction; Metal roof
- Exterior features: Partial fencing; Desert front and back landscaping; Community pool, golf, and lake access; Coin-operated laundry and biking/walking paths in the community
Interior
- Kitchen: Refrigerator; Dishwasher
- Bedrooms: 2 possible bedrooms
- Flooring: Carpet; Laminate
- Bathrooms: 2 full bathrooms
- Heating & cooling: Electric heating; Central air; Ceiling fans
- Interior features: Double vanity; Master bedroom with 3/4 bath
- Laundry & utility: Washer/dryer hookups only
Neighborhood map
What this means for you Summary
Snapshot
- This is a 2-bed/2.0-bath manufactured listed at $200k.
Deal economics
- At list price, monthly cash flow is $14 ($173/yr) — positive.
- The deal already cash-flows at list — no discount required.
- To meet the 1% rule (rent ≥ 1% of price), the offer needs to be $177k (11.6% below list).
- Recommended offer: $177k (11.6% below list) — sets the bar for 1% rule.
Location & tenants
- Location reads 51/100 on livability (#322 in AZ) — a working-class tenant base; expect higher turnover. Strengths: cost of living A+, housing A+, crime A; Watch: amenities F, commute F, employment F.
- Apache Junction Unified District (4443) (suburban): math 15% / reading 20% proficiency, ranked #195 of 249 in AZ (top 78%) — low school quality limits family demand, transient renter base, plan for 1-2y turnover.
- Zoned schools: Peralta Trail Elementary School (math 17% / reading 26%, grade F, #717 of 1,109 statewide, top 65%, 286 students, 74% FRL); Cactus Canyon Junior High (math 14% / reading 19%, grade F, #151 of 218 statewide, top 70%, 702 students, 50% FRL); Apache Junction High School (math 12% / reading 17%, grade F, #267 of 381 statewide, top 72%, 999 students, 48% FRL) — zoned schools at 57% FRL track the district average.
- Market conditions: 430 active listings in the ZIP; solid renter incomes; 9,504 units permitted in Pinal County in 2024 (776 in 5+ unit buildings).
Forward outlook
- Local home prices are declining (-3.0%/yr); year-one equity from $1k of loan paydown is wiped out by about $6k of value loss. Plan a longer hold.
Negotiation context
- Only 6 days on market — expect competitive offers; lowballing is unlikely to land.
- 10 sale attempts since 24y ago with the ask held roughly flat each time — persistent listings suggest the price (not the market) is what's stuck; bring a comps-based counter.
Risks & watch-outs
- Climate carrying-cost: major wildfire risk; extreme-heat days projected 7→18/yr by 2055 (HVAC capex compounding) — expect insurance premiums to compound above CPI over the hold.
Questions for the listing agent
- Is there a deadline driving the sale (1031 exchange, divorce, estate, relocation)? That informs how much negotiation room exists.
- Schools are D-rated, which usually means shorter tenancies and higher turnover. Who's the typical renter profile here, and what's been the actual vacancy rate?
- The area grade is low — what's the realistic commute time and amenity access for the typical tenant pool here? Any planned neighborhood developments (good or bad) we should know about?
- What's the average days-on-market for RENTAL listings here right now (not sales)? A rising rental-DOM trend means longer vacancies and softer asking-rent achievability than the comps imply.
- What's the recent tenant-quality profile in this submarket — average credit score on applications, eviction rate, late-payment / NSF rate, and stable-employment percentage? A property-management company in the area should have these aggregated.
- How much new for-sale + rental construction is in the pipeline within 1–3 miles? Heavy new supply typically softens prices + rents 12–24 months out; constrained supply supports both.
Investment metrics
- 1% rule
- 0.88% ✗
- Cap rate
- 6.38%
- Cash-on-cash
- 0.31%
- DSCR
- 1.01
- GRM
- 9.4
CMA / ARV
- ARV (on-the-fly)
- $252,000
- Comps found
- 8
Show comp detail 8 sales within ~0.75 mi
| Address | Dist | Beds/Ba | Sqft | Sold | Price | $/sf | Match |
|---|---|---|---|---|---|---|---|
| 91 W Sahuaro Dr | 0.40mi | 2/2.0 | 1,441 (+0%) | 2mo | $229,900 | $160 | 80 |
| 412 N Buckhorn Ct | 0.22mi | 2/2.0 | 1,513 (+5%) | 4mo | $270,000 | $178 | 78 |
| 550 E Queen Creek Ct | 0.10mi | 2/2.0 | 1,440 (0%) | 21mo | $220,000 | $153 | 78 |
| 481 E Donna Dr #6 | 0.13mi | 2/2.0 | 1,561 (+8%) | 8mo | $178,900 | $115 | 73 |
| 298 W Sahuaro Dr | 0.51mi | 2/2.0 | 1,441 (+0%) | 19mo | $185,000 | $128 | 60 |
| 597 E Queen Valley Dr | 0.20mi | 3/2.0 (+1) | 1,569 (+9%) | 14mo | $305,000 | $194 | 59 |
| 257 W Morris Dr | 0.47mi | 2/2.0 | 1,249 (-13%) | 8mo | $219,000 | $175 | 49 |
| 51 E Diane Dr | 0.23mi | 3/2.0 (+1) | 1,633 (+13%) | 18mo | $300,000 | $184 | 47 |
Match score weights: distance 35% · size 25% · config 20% · recency 20%. Top-matched comps best support the ARV.
Projected returns pro-forma
-3.0% appreciation · 3.0% rent growth · sell at horizon
- IRR
- -15.8%
- Equity multiple
- 0.44×
- Total profit
- $-31,464
- Equity at exit
- $29,821
- IRR
- -7.3%
- Equity multiple
- 0.53×
- Total profit
- $-26,108
- Equity at exit
- $17,292
Cash invested: $56,000 (down + closing). Projections, not guarantees.
Landlord ↔ Tenant lean methodology
- Overall (STATE)
- 87 Strongly Landlord-Friendly
- State Arizona
- 87 Strongly Landlord-Friendly · R+3
- County
- — inherits STATE
- City
- — inherits STATE
ZIP-level market 85118
- Home prices YoY
- -32.4%
- Active inventory
- 430
- Price-to-rent
- 9.4×
Monthly cashflow live
- Estimated rent
- $1,768 medium interval (Pro) →
- Mortgage (P&I)
- −$1,049
- Tax est. 1.5%
- −$250 /mo · $3,000/yr
- Insurance
- −$83
- HOA
- −$0
- Vacancy / Maint / Mgmt
- −$371
- Net cashflow
- $14
Break-even live
Sensitivity live
| Price | -10% $153 | -5% $84 | +0% $14 | +5% $-55 | +10% $-124 |
|---|---|---|---|---|---|
| Rent | -10% $-125 | -5% $-55 | +0% $14 | +5% $84 | +10% $154 |
| Rate | -1.0pp $115 | -0.5pp $65 | base $14 | +0.5pp $-37 | +1.0pp $-90 |
UW: 25.0% down · 7.5% · 30yr · 1.5% tax · 5.0% vac · 8.0% maint · 8.0% mgmt
Financing live
Cash to close
- Down payment
- $50,000
- Closing costs
- $6,000
- Reserves months
- —
- Total cash needed
- —
Loan-product check · same deal, 3 products live
Conventional
25% down · 7.5% · 30yr
- Down + closing
- —
- Monthly P&I
- —
- Monthly cashflow
- —
- DSCR
- —
- Eligible?
- —
Personal DTI + credit; lowest rate.
DSCR
20% down · 8.5% · 30yr
- Down + closing
- —
- Monthly P&I
- —
- Monthly cashflow
- —
- DSCR
- —
- Eligible?
- —
No personal income docs; deal must DSCR.
Hard money
10% down · 12.0% · 12mo
- Down + closing
- —
- Monthly P&I
- —
- Monthly cashflow
- —
- DSCR
- —
- Eligible?
- —
Short-term bridge; refi at stabilization.
Listing history 5 events
-
2026-06-21days on market $200,000 Active 6 DOM
-
2026-06-18days on market $200,000 Active 3 DOM
-
2026-06-17days on market $200,000 Active 2 DOM
-
2026-06-15remarks 699-char remark
-
2026-06-15$200,000 Active 1 DOM
ⓘ Source: listings_history table (triggers on properties + properties_extension) + one-shot
backfill from property_details.listing_events for pre-trigger history.
Climate risk First Street
- Flood 4/10 Moderate FEMA zone X (unshaded) · 24% chance over 30 yrs
- Wildfire 7/10 Severe
- Heat 8/10 Severe 7 d/yr ≥108°F today · 18 d/yr by 30 yrs out
- Wind 1/10 Low
- Air quality 2/10 Low 1 unhealthy d/yr today · 1 by 30 yrs out
Nearby sold comps map
Loading sold comps map…
Walkable amenities ~0.75 mi
Loading nearby amenities…
Taxation est. · year 1
- Rental income
- $21,214
- − Mortgage interest
- −$11,203
- − Property taxes
- −$3,000
- − Insurance
- −$1,000
- − Repairs & maintenance
- −$1,697
- − Management
- −$1,697
- − Depreciation
- −$5,818
- Taxable loss
- −$3,202
- Est. tax savings @ 24.0%
- +$768
- After-tax cash flow
- $941/yr
For passive investors: Depreciation is non-cash, so a rental often shows a tax loss while cash-flowing — sheltering income. Rental losses are passive: they offset passive income freely, and up to $25,000/yr can offset ordinary (W-2) income if you actively participate and your MAGI is under $100k (phasing out to $0 by $150k); unused losses carry forward. On sale, claimed depreciation is recaptured at up to 25%, and gains may owe capital-gains tax (a 1031 exchange can defer both). Figures are a year-1 estimate at your 24.0% rate — not tax advice; consult a CPA.
Schools (NCES district)
- District
- Apache Junction Unified District (4443)
- NCES district ID
- 0400790
- Math proficiency
- 15% ▼ -17.00%
- Reading proficiency
- 20% ▼ -13.00%
- Median HH income
- $44,930
- Composite
- 15.34/100
- National rank
- #9325
- State rank
- #195 of 249 in AZ
Livability — Queen Valley
- Score
- 51/100
- State rank
- #322
- US rank
- #25478
Category grades
Schools grade is shown separately in the Schools card above.
Census & demographics
- Census place
- Queen Valley, AZ
- County
- Pinal County · 399,947 people
- Metro
- Phoenix-Mesa-Chandler, AZ
- Population (ZIP)
- 14,932
- Household income
- $86,393
- Rent vs Own
- Severe rent burden
- 160.0
Population outlook (Pinal County) Hauer SSP2
- Today (2025)
- 437,574 people
- By 2030
- 446,903 · +2.1%
- By 2040
- 452,589 · +3.4%
- By 2050
- 444,126 · +1.5%
- By 2075
- 430,300 · -1.7%
- By 2100
- 393,536 · -10.1%
Race, ethnicity, and origin ACS 2023
- Neighborhood character
- Predominantly White (86%)
- Race & ethnicity
- White 86% Hispanic / Latino 8% Two or more races 6%
- Hispanic origin (detail)
- Mexican 7%
- Common ancestry
- Portuguese 7% Romanian 4% Slovak 4%
- Foreign-born
- 5% · Canada
- Languages at home
- 96% English-only · Spanish 3%
Political lean MEDSL · Pinal
- 2024 margin
- Strong R (+22.1) · D 38.5% · R 60.6%
- 2008→2024 swing
- -7.6pp toward R · 2008: -14.5pp · 2024: -22.1pp
- All cycles
- 2024: R+22.1 2020: R+17.3 2016: R+19.3 2012: R+17.1 2008: R+14.5
Not yet ingested
- Civics
- —
Market trends
- HPI YoY
- ▼ -122.27%
- Current HPI
- 255.6958
- Rent YoY
- —
- Metro
- Phoenix-Mesa-Chandler, AZ
- State GDP YoY
- ▲ 4.54%
- F500 in state
- 20
Industry mix (Fortune 500 HQ in AZ)
| Industry | F500 HQs | Revenue |
|---|---|---|
| Technology | 2 | $13B |
|
||
| Mining / Metals | 1 | $23B |
|
||
| Environmental Services | 1 | $16B |
|
||
| Metals / Steel | 1 | $14B |
|
||
| Technology Distribution | 1 | $9B |
|
||
| Homebuilding | 1 | $8B |
|
||
Price history
+1389.4% since first listed31 events — show timeline
- 2026-06-15 Listed $200,000 ARMLS
- 2026-03-30 Listing Removed — ARMLS
- 2026-02-25 Price Changed $195,000 ARMLS
- 2026-02-13 Price Changed $199,000 ARMLS
- 2026-01-20 Listed $209,000 ARMLS
- 2021-11-17 Sold (MLS) $190,000 ARMLS
- 2021-11-15 Sold (Public Records) $190,000 Public Records
- 2021-10-14 Pending — ARMLS
- 2021-10-14 Relisted — ARMLS
- 2021-09-29 Pending — ARMLS
- 2021-09-21 Listed $185,000 ARMLS
- 2018-02-28 Sold (Public Records) $124,000 Public Records
- 2018-02-28 Sold (MLS) $124,000 ARMLS
- 2018-02-12 Pending — ARMLS
- 2017-04-03 Relisted — ARMLS
- 2017-03-31 Pending — ARMLS
- 2017-02-12 Price Changed $129,900 ARMLS
- 2016-12-22 Listed $134,900 ARMLS
- 2016-08-31 Listing Removed — ARMLS
- 2016-03-01 Listed $134,900 ARMLS
- 2014-11-28 Sold (MLS) $105,000 ARMLS
- 2014-11-26 Sold (Public Records) $105,100 Public Records
- 2014-11-01 Pending — ARMLS
- 2014-09-15 Listed $115,000 ARMLS
- 2004-07-26 Sold (Public Records) $63,000 Public Records
- 2004-07-23 Sold (MLS) $63,000 ARMLS
- 2004-07-17 Listing Removed — ARMLS
- 2003-10-03 Listing Removed — ARMLS
- 2003-10-03 Listed $74,900 ARMLS
- 2002-10-04 Listed $79,500 ARMLS
- 1984-07-31 Sold (Public Records) $13,428 Public Records
Property tax history
-4.7%/yrLatest (2025): $323 · +4.5% YoY. Source: county tax records.
Cash-flow waterfall
monthlySold comps — $/sqft
last 12 mo · ≤1 miLoading sold comps…