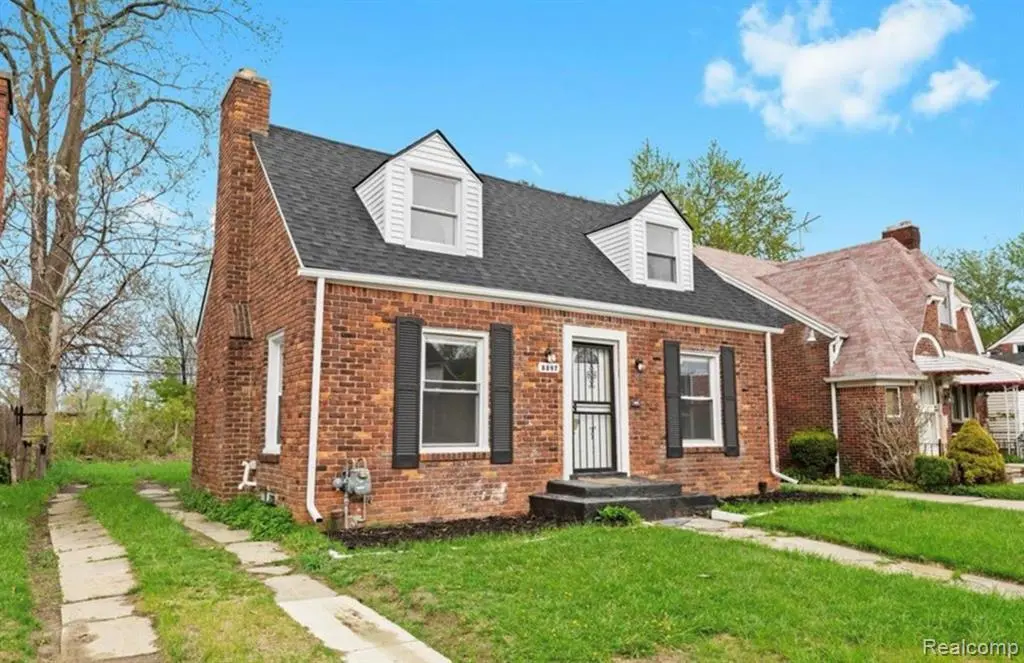
8897 Hartwell St · Detroit, MI
Flood risk 1/10 · Minimal
- FEMA flood zone
- X (unshaded)
- Chance of flooding over 30 yrs
- 0.0%
- Est. flood insurance / yr
- $473 – $860
Fire risk 1/10 · Minimal
- Est. fire insurance / yr
- $784 – $1,456
Heat risk 3/10 · Minor
- Hot days now (above 97°F)
- 7 days/yr
- Hot days in 30 yrs
- 15 days/yr
Wind risk 2/10 · Minimal
- Chance of severe wind over 30 yrs
- —
Air-quality risk 3/10 · Minor
- Unhealthy air days now
- 2 days/yr
- Unhealthy air days in 30 yrs
- 5 days/yr
Risk factors via First Street. Map © Google.
Why this score? — see what drove the D+ grade
The composite is a weighted blend of 9 inputs, each scored 0–100. Each bar is that input's sub-score; the figure is the points it added to the 100-point composite (weight × sub-score).
- Cash flow +23.2/30.0
- DSCR +7.5/10.0
- 1% rule +6.5/10.0
- Livability +3.7/5.0
- Condition / age +2.5/5.0
- Rent growth +1.9/5.0
- Schools +1.3/10.0
- ARV discount +0.0/15.0
- Appreciation +0.0/10.0
$110,000
🖨 Deal sheet (PDF) 📄 Offer letter ✓ Due diligence
Listing remarks MLS
Turnkey investment opportunity with immediate income already in place. This updated brick property is currently tenant occupied at $1,400 per month, with a lease secured through October 2026, allowing you to step into cash flow from day one without the time or expense of placing a tenant. At the current rental rate, the property produces $16,800 annually in gross rental income, delivering an attractive rent-to-price ratio of over 15% gross annual return before expenses. With today's DSCR lending environment, the existing rental income positions this property well for investors seeking strong debt-service coverage and cash-flow potential. The home itself has been thoughtfully updated to support long-term tenant satisfaction and minimize future capital expenses. Featuring 3 bedrooms and 1.5 baths, the property offers updated flooring, modern finishes, and a clean neutral interior that continues to attract strong rental demand. The functional layout, the modern updates, and the newer roof make this an ideal low-maintenance addition to any portfolio. Whether you're expanding your portfolio or securing your next reliable rental, this property offers the combination investors are looking for: performing income, secured tenancy, updated condition, and strong rental fundamentals at an appropriate price point.
Key facts
- 4,792 sq ft lot
- Built 1936
- Listed 31 days
Property features AI
Finance
- Financial info: Annual tax amount listed
Exterior
- Parking: No garage
- Utilities: Public water; Public sewer
- Home design: Single-family residence; One and one-half stories; Ground level entry with steps; Brick exterior
- Construction: Brick construction; Block foundation
- Exterior features: Paved road access; Pets allowed
Interior
- Kitchen: Gas water heater (appliance listed)
- Bedrooms: Total rooms: 5; One and one-half level layout
- Bathrooms: 1 full bathroom; 1 half bathroom
- Heating & cooling: Forced air heating (natural gas); No cooling
- Interior features: High speed internet; Wood-burning fireplace in the living room; Gas water heater
- Laundry & utility: Has heating (forced air, natural gas)
Neighborhood map
What this means for you Summary
Snapshot
- This is a 3-bed/1.0-bath single-family listed at $110k.
Deal economics
- At list price, monthly cash flow is $199 ($2k/yr) — positive.
- The deal already cash-flows at list — no discount required.
- Meets the 1% rule at list price ($1k rent vs $110k).
- Recommended offer: $107k (3.0% below list) — sets the bar for market timing.
Location & tenants
- Location reads 73/100 on livability (#218 in MI) — a middle-class / working-renter tenant base. Strengths: amenities A+, commute A+, cost of living A+; Watch: crime F, employment F.
- Detroit Public Schools Community District (urban): math 10% / reading 24% proficiency, ranked #499 of 540 in MI (top 92%) — low school quality limits family demand, transient renter base, plan for 1-2y turnover; 90% free/reduced lunch — lower-income household profile, screen leases tightly.
- Zoned schools: Mackenzie Elementarymiddle School (math 2% / reading 2%, grade F, #1,384 of 1,397 statewide, top 100%, 909 students, 88% FRL); Cody High School (math 24% / reading 24%, grade F, #481 of 713 statewide, top 81%, 466 students, 88% FRL) — zoned schools at 88% FRL track the district average.
- Market conditions: Rents soft (-2.3%/yr); 367 active listings in the ZIP; 40 comparable units currently listed for rent nearby; rentals lingering (median 46d on market — plan ~5-8 weeks vacancy on turnover, expect pricing pressure); 58% of comp listings sitting > 30 days — soft ceiling on asking rent; lower-income renter base — watch delinquency; 2,639 units permitted in Wayne County in 2024 (1,216 in 5+ unit buildings).
- At $1,267/mo this rent would consume 50% of the median local household income ($31k/yr) (locally 4144% of renters already pay >50% of income on rent) — very limited rent-growth headroom before tenants either downsize or default.
Forward outlook
- Local home prices are declining (-3.0%/yr); year-one equity from $761 of loan paydown is wiped out by about $3k of value loss. Plan a longer hold.
- Wayne County population projected at -17% by 2050 — secular population decline; favor cash flow + early exit over multi-decade hold.
Negotiation context
- It's been on market 31 days — a 3% lower offer ($107k) is reasonable based on typical stale-listing flexibility.
- 13 sale attempts since 17y ago with the ask held roughly flat each time — persistent listings suggest the price (not the market) is what's stuck; bring a comps-based counter.
- Current owner paid $58k; list at $110k implies a 88% gain — meaningful room to come down on a strong offer.
Risks & watch-outs
- Watch-outs: built in 1936 — expect roof / HVAC / electrical / plumbing capex.
Questions for the listing agent
- It's been on market 31 days. Have you received any prior offers? Is the seller open to a 3% concession, seller financing, or rate buy-down credit?
- Built in 1936 — when were the roof, HVAC, electrical panel, plumbing, and water heater last replaced?
- Is there a deadline driving the sale (1031 exchange, divorce, estate, relocation)? That informs how much negotiation room exists.
- Schools are F-rated, which usually means shorter tenancies and higher turnover. Who's the typical renter profile here, and what's been the actual vacancy rate?
- Crime grade is F in this area — have there been break-ins, vandalism, or insurance claims at this property in the last 3 years? What carrier currently insures it and at what premium?
- The area grade is low — what's the realistic commute time and amenity access for the typical tenant pool here? Any planned neighborhood developments (good or bad) we should know about?
- What's the average days-on-market for RENTAL listings here right now (not sales)? A rising rental-DOM trend means longer vacancies and softer asking-rent achievability than the comps imply.
- What's the recent tenant-quality profile in this submarket — average credit score on applications, eviction rate, late-payment / NSF rate, and stable-employment percentage? A property-management company in the area should have these aggregated.
- How much new for-sale + rental construction is in the pipeline within 1–3 miles? Heavy new supply typically softens prices + rents 12–24 months out; constrained supply supports both.
Investment metrics
- 1% rule
- 1.15% ✓
- Cap rate
- 8.47%
- Cash-on-cash
- 7.76%
- DSCR
- 1.35
- GRM
- 7.2
CMA / ARV
- ARV (on-the-fly)
- $75,600
- Comps found
- 12
Show comp detail 12 sales within ~0.75 mi
| Address | Dist | Beds/Ba | Sqft | Sold | Price | $/sf | Match |
|---|---|---|---|---|---|---|---|
| 8938 Hartwell St | 0.04mi | 3/1.5 | 1,042 (-4%) | 7mo | $100,000 | $96 | 85 |
| 9222 Hartwell St | 0.18mi | 3/1.0 | 1,000 (-7%) | 5mo | $70,000 | $70 | 75 |
| 9180 Hartwell St | 0.14mi | 3/1.5 | 1,174 (+9%) | 5mo | $62,000 | $53 | 73 |
| 8590 Littlefield St | 0.21mi | 3/1.5 | 1,218 (+13%) | 1mo | $100,000 | $82 | 66 |
| 8234 Meyers Rd | 0.61mi | 3/1.5 | 1,087 (+1%) | 8mo | $78,000 | $72 | 61 |
| 9371 Lauder St | 0.74mi | 3/1.0 | 1,100 (+2%) | 5mo | $40,250 | $37 | 58 |
| 8875 Manor St | 0.50mi | 3/1.0 | 1,176 (+9%) | 8mo | $125,000 | $106 | 55 |
| 9982 Littlefield St | 0.66mi | 3/1.0 | 1,152 (+7%) | 8mo | $47,000 | $41 | 52 |
| 8849 Lauder St | 0.68mi | 3/1.0 | 1,200 (+11%) | 5mo | $41,500 | $35 | 46 |
| 8999 Griggs St | 0.75mi | 3/2.0 | 1,196 (+11%) | 0mo | $190,000 | $159 | 43 |
| 9145 Pinehurst St | 0.57mi | 3/1.5 | 1,240 (+15%) | 5mo | $66,000 | $53 | 42 |
| 8121 Hubbell ST St | 0.74mi | 3/1.0 | 918 (-15%) | 2mo | $48,500 | $53 | 39 |
Match score weights: distance 35% · size 25% · config 20% · recency 20%. Top-matched comps best support the ARV.
Projected returns pro-forma
-3.0% appreciation · 0.0% rent growth · sell at horizon
- IRR
- -8.0%
- Equity multiple
- 0.71×
- Total profit
- $-8,803
- Equity at exit
- $16,401
- IRR
- -3.1%
- Equity multiple
- 0.82×
- Total profit
- $-5,491
- Equity at exit
- $9,511
Cash invested: $30,800 (down + closing). Projections, not guarantees.
Landlord ↔ Tenant lean methodology
- Overall (STATE)
- 62 Landlord-Friendly
- State Michigan
- 62 Landlord-Friendly · EVEN
- County
- — inherits STATE
- City
- — inherits STATE
ZIP-level market 48228
- Rents YoY
- -2.3%
- Active inventory
- 367
- Price-to-rent
- 7.2×
Monthly cashflow live
- Estimated rent
- $1,267 high interval (Pro) →
- Mortgage (P&I)
- −$577
- Tax from tax record
- −$179 /mo · $2,146/yr
- Insurance
- −$46
- HOA
- −$0
- Vacancy / Maint / Mgmt
- −$266
- Net cashflow
- $199
Break-even live
Sensitivity live
| Price | -10% $262 | -5% $230 | +0% $199 | +5% $168 | +10% $137 |
|---|---|---|---|---|---|
| Rent | -10% $99 | -5% $149 | +0% $199 | +5% $249 | +10% $299 |
| Rate | -1.0pp $255 | -0.5pp $227 | base $199 | +0.5pp $171 | +1.0pp $142 |
UW: 25.0% down · 7.5% · 30yr · 1.5% tax · 5.0% vac · 8.0% maint · 8.0% mgmt
Financing live
Cash to close
- Down payment
- $27,500
- Closing costs
- $3,300
- Reserves months
- —
- Total cash needed
- —
Loan-product check · same deal, 3 products live
Conventional
25% down · 7.5% · 30yr
- Down + closing
- —
- Monthly P&I
- —
- Monthly cashflow
- —
- DSCR
- —
- Eligible?
- —
Personal DTI + credit; lowest rate.
DSCR
20% down · 8.5% · 30yr
- Down + closing
- —
- Monthly P&I
- —
- Monthly cashflow
- —
- DSCR
- —
- Eligible?
- —
No personal income docs; deal must DSCR.
Hard money
10% down · 12.0% · 12mo
- Down + closing
- —
- Monthly P&I
- —
- Monthly cashflow
- —
- DSCR
- —
- Eligible?
- —
Short-term bridge; refi at stabilization.
Rent comps 40 comps
| Address | Beds | Baths | Sqft | Rent | $/sqft | DOM | Units | Dist |
|---|---|---|---|---|---|---|---|---|
| 9340 Hartwell St Detroit, MI | 3.0 | 1.0 | 1000 | $1,364 | $1.36 | 45d | 1 | 0.30mi |
| 9355 Ward St Detroit, MI | 3.0 | 1.0 | 1200 | $1,327 | $1.11 | 45d | 1 | 0.38mi |
| 8283 Pinehurst St Unit 2 Detroit, MI | 2.0 | 1.0 | 1000 | $900 | $0.90 | 45d | 1 | 0.68mi |
| 9558 Meyers Rd Detroit, MI | 3.0 | 1.0 | 950 | $1,150 | $1.21 | 45d | 1 | 0.68mi |
| 13717 Keal St Detroit, MI | 2.0 | 1.0 | 799 | $1,000 | $1.25 | 45d | 1 | 0.69mi |
| 8114 Marlowe St Unit home Detroit, MI | 3.0 | 1.0 | 985 | $1,350 | $1.37 | 45d | 1 | 0.75mi |
| 14740 W Chicago Unit B Detroit, MI | 2.0 | 1.0 | 900 | $845 | $0.94 | 45d | 1 | 0.75mi |
| 8212 Lauder St Detroit, MI | 3.0 | 1.0 | 1026 | $1,150 | $1.12 | 45d | 1 | 0.75mi |
| 9590 Marlowe St Detroit, MI | 2.0 | 1.0 | 877 | $1,430 | $1.63 | 45d | 1 | 0.75mi |
| 9501 Lauder St Detroit, MI | 3.0 | 2.0 | 1152 | $1,350 | $1.17 | 45d | 1 | 0.77mi |
| 9386 Coyle St Detroit, MI | 3.0 | 1.0 | 1000 | $1,300 | $1.30 | 3d | 1 | 0.86mi |
| 10359 Violetlawn St Unit 1 Detroit, MI | 2.0 | 1.0 | 1200 | $985 | $0.82 | 45d | 1 | 0.89mi |
| 10002 Manor Unit 2 Detroit, MI | 3.0 | 1.0 | 1100 | $1,150 | $1.05 | 45d | 1 | 0.89mi |
| 10002 Manor Unit 1 Detroit, MI | 2.0 | 1.0 | 1000 | $1,050 | $1.05 | 45d | 1 | 0.89mi |
| 10303 Morley St #1 Detroit, MI | 2.0 | 1.0 | 950 | $950 | $1.00 | 45d | 1 | 0.90mi |
| 8604 Whitcomb St Detroit, MI | 3.0 | 2.0 | 1033 | $1,300 | $1.26 | 45d | 1 | 0.92mi |
| 10345 Crocuslawn Ave Unit 2 Detroit, MI | 2.0 | 1.0 | 850 | $950 | $1.12 | 45d | 1 | 0.92mi |
| 8047 Robson St Detroit, MI | 3.0 | 2.0 | 1184 | $1,200 | $1.01 | 45d | 1 | 0.94mi |
| 9546 Sussex St Detroit, MI | 3.0 | 1.0 | 1000 | $1,400 | $1.40 | 45d | 1 | 0.96mi |
| 8331 Whitcomb St Detroit, MI | 4.0 | 1.0 | 1342 | $1,350 | $1.01 | 23d | 1 | 0.97mi |
| 12775 Plymouth Rd Unit 16 Detroit, MI | 2.0 | 1.0 | 1009 | $825 | $0.82 | 45d | 1 | 0.99mi |
| 10015 Robson St Detroit, MI | 3.0 | 2.0 | 1000 | $1,400 | $1.40 | 19d | 1 | 1.03mi |
| 11431 Marlowe St Detroit, MI | 3.0 | 1.0 | 1172 | $1,400 | $1.19 | 18d | 1 | 1.05mi |
| 9917 Sussex St Detroit, MI | 2.0 | 1.0 | 800 | $1,375 | $1.72 | 45d | 1 | 1.06mi |
| 9353 Kentucky St Detroit, MI | 2.0 | 1.0 | 800 | $999 | $1.25 | 19d | 1 | 1.07mi |
| 9222 Forrer St Detroit, MI | 3.0 | 1.0 | 947 | $1,450 | $1.53 | 18d | 1 | 1.20mi |
| 8143 Wisconsin St Detroit, MI | 4.0 | 1.0 | 1370 | $1,800 | $1.31 | 0d | 1 | 1.23mi |
| 11397 Whitcomb St Detroit, MI | 3.0 | 1.0 | 1070 | $1,400 | $1.31 | 18d | 1 | 1.25mi |
| 11634 Sussex St Detroit, MI | 3.0 | 1.0 | 1091 | $1,326 | $1.22 | 26d | 1 | 1.26mi |
| 12014 Terry St Detroit, MI | 2.0 | 1.0 | 1361 | $1,200 | $0.88 | 45d | 1 | 1.27mi |
| 12039 Lauder St Detroit, MI | 3.0 | 1.5 | 1000 | $1,500 | $1.50 | 26d | 1 | 1.27mi |
| 9973 Winthrop St Detroit, MI | 3.0 | 1.0 | 960 | $1,400 | $1.46 | 45d | 1 | 1.28mi |
| 11393 Prest St Detroit, MI | 3.0 | 1.0 | 900 | $1,550 | $1.72 | 18d | 1 | 1.29mi |
| 9936 Montrose St Detroit, MI | 3.0 | 1.0 | 963 | $1,200 | $1.25 | 18d | 1 | 1.29mi |
| 9022 Northlawn St Detroit, MI | 2.0 | 1.0 | 1100 | $1,300 | $1.18 | 26d | 1 | 1.30mi |
| 8230 Ohio St Detroit, MI | 3.0 | 1.0 | 1350 | $1,200 | $0.89 | 18d | 1 | 1.30mi |
| 11345 Greenfield Rd Detroit, MI | 2.0 | 1.0 | 700 | $1,050 | $1.50 | 14d | 1 | 1.30mi |
| 9345 Rutherford St Unit 3 Detroit, MI | 2.0 | 1.0 | 850 | $1,050 | $1.24 | 26d | 1 | 1.36mi |
| 8544 Cloverlawn St Detroit, MI | 2.0 | 1.0 | 800 | $800 | $1.00 | 19d | 1 | 1.36mi |
| 9220 Mansfield St Detroit, MI | 3.0 | 1.0 | 1200 | $1,300 | $1.08 | 45d | 1 | 1.37mi |
Listing history 44 events
-
2026-06-21statusdays on market $110,000 Pending 31 DOM
-
2026-06-18days on market $110,000 Active 29 DOM
-
2026-06-17days on market $110,000 Active 28 DOM
-
2026-06-15days on market $110,000 Active 26 DOM
-
2026-06-13days on market $110,000 Active 24 DOM
-
2026-06-13days on market $110,000 Active 23 DOM
-
2026-06-09days on market $110,000 Active 20 DOM
-
2026-06-08days on market $110,000 Active 19 DOM
-
2026-06-07days on market $110,000 Active 18 DOM
-
2026-06-04days on market $110,000 Active 15 DOM
-
2026-06-03days on market $110,000 Active 14 DOM
-
2026-06-02days on market $110,000 Active 13 DOM
-
2026-06-01days on market $110,000 Active 12 DOM
-
2026-05-31days on market $110,000 Active 11 DOM
-
2026-05-20$110,000 Active 1322-char remark
Show marketing remark (1322 chars)
Turnkey investment opportunity with immediate income already in place. This updated brick property is currently tenant occupied at $1,400 per month, with a lease secured through October 2026, allowing you to step into cash flow from day one without the time or expense of placing a tenant. At the current rental rate, the property produces $16,800 annually in gross rental income, delivering an attractive rent-to-price ratio of over 15% gross annual return before expenses. With today's DSCR lending environment, the existing rental income positions this property well for investors seeking strong debt-service coverage and cash-flow potential. The home itself has been thoughtfully updated to support long-term tenant satisfaction and minimize future capital expenses. Featuring 3 bedrooms and 1.5 baths, the property offers updated flooring, modern finishes, and a clean neutral interior that continues to attract strong rental demand. The functional layout, the modern updates, and the newer roof make this an ideal low-maintenance addition to any portfolio. Whether you're expanding your portfolio or securing your next reliable rental, this property offers the combination investors are looking for: performing income, secured tenancy, updated condition, and strong rental fundamentals at an appropriate price point.
-
2026-05-20$110,000 Active
Show marketing remark (1322 chars)
Turnkey investment opportunity with immediate income already in place. This updated brick property is currently tenant occupied at $1,400 per month, with a lease secured through October 2026, allowing you to step into cash flow from day one without the time or expense of placing a tenant. At the current rental rate, the property produces $16,800 annually in gross rental income, delivering an attractive rent-to-price ratio of over 15% gross annual return before expenses. With today's DSCR lending environment, the existing rental income positions this property well for investors seeking strong debt-service coverage and cash-flow potential. The home itself has been thoughtfully updated to support long-term tenant satisfaction and minimize future capital expenses. Featuring 3 bedrooms and 1.5 baths, the property offers updated flooring, modern finishes, and a clean neutral interior that continues to attract strong rental demand. The functional layout, the modern updates, and the newer roof make this an ideal low-maintenance addition to any portfolio. Whether you're expanding your portfolio or securing your next reliable rental, this property offers the combination investors are looking for: performing income, secured tenancy, updated condition, and strong rental fundamentals at an appropriate price point.
-
2026-03-30historical
-
2026-03-30historical
-
2026-01-26$138,500 Active
-
2026-01-26$138,500 Active
-
2026-01-20historical
-
2026-01-20historical
-
2025-10-28$138,500 Active
-
2025-10-28$138,500 Active
-
2025-08-21historical
-
2025-07-31status Active
-
2025-07-30historical
-
2025-06-26price $129,500
-
2025-06-25price $129,500
-
2025-06-10$135,000 Active
-
2025-06-10$135,000 Active
-
2025-06-10historical
-
2025-06-10historical
-
2025-06-04price $135,000
-
2025-06-03price $135,000
-
2025-05-02$140,000 Active
-
2025-05-02$140,000 Active
-
2019-07-22soldstatus $58,500
-
2009-08-03soldstatus $4,750
-
2009-08-03soldstatus $4,750
-
2009-07-15historical
-
2009-04-30$5,900
-
2009-04-30$5,900
-
2007-12-21soldstatus $95,000
ⓘ Source: listings_history table (triggers on properties + properties_extension) + one-shot
backfill from property_details.listing_events for pre-trigger history.
Tax reassessment forecast MI · Partial reset (capped growth)
- Current annual tax
- $2,146 · $179/mo
- Projected year-2 tax
- $2,146 · $179/mo
- Expected delta
- $0/yr ($0/mo · 0.0%)
ⓘ Screening estimate from a state-policy table — verify with the county assessor before closing.
Climate risk First Street
- Flood 1/10 Low FEMA zone X (unshaded) · 0% chance over 30 yrs
- Wildfire 1/10 Low
- Heat 3/10 Moderate 7 d/yr ≥97°F today · 15 d/yr by 30 yrs out
- Wind 2/10 Low
- Air quality 3/10 Moderate 2 unhealthy d/yr today · 5 by 30 yrs out
Nearby sold comps map
Loading sold comps map…
Walkable amenities ~0.75 mi
Loading nearby amenities…
Taxation est. · year 1
- Rental income
- $15,201
- − Mortgage interest
- −$6,162
- − Property taxes
- −$2,146
- − Insurance
- −$550
- − Repairs & maintenance
- −$1,216
- − Management
- −$1,216
- − Depreciation
- −$3,200
- Taxable income
- $712
- Est. tax owed @ 24.0%
- −$171
- After-tax cash flow
- $2,220/yr
For passive investors: Depreciation is non-cash, so a rental often shows a tax loss while cash-flowing — sheltering income. Rental losses are passive: they offset passive income freely, and up to $25,000/yr can offset ordinary (W-2) income if you actively participate and your MAGI is under $100k (phasing out to $0 by $150k); unused losses carry forward. On sale, claimed depreciation is recaptured at up to 25%, and gains may owe capital-gains tax (a 1031 exchange can defer both). Figures are a year-1 estimate at your 24.0% rate — not tax advice; consult a CPA.
Schools (NCES district)
- District
- Detroit Public Schools Community District
- NCES district ID
- 2601103
- Math proficiency
- 10% ▼ -2.00%
- Reading proficiency
- 24% ▲ 6.00%
- Median HH income
- $25,815
- Composite
- 13.06/100
- National rank
- #9564
- State rank
- #499 of 540 in MI
Livability — Detroit
- Score
- 73/100
- State rank
- #218
- US rank
- #5427
Category grades
Schools grade is shown separately in the Schools card above.
Census & demographics
- Census place
- Detroit, MI
- County
- Wayne County · 1,562,939 people
- City population
- 572,865
- Metro
- Detroit-Warren-Dearborn, MI
- Population (ZIP)
- 50,117
- Household income
- $30,680
- Rent vs Own
- Severe rent burden
- 4144.0
Population outlook (Wayne County) Hauer SSP2
- Today (2025)
- 1,675,273 people
- By 2030
- 1,620,300 · -3.3%
- By 2040
- 1,502,341 · -10.3%
- By 2050
- 1,384,039 · -17.4%
- By 2075
- 1,124,592 · -32.9%
- By 2100
- 881,193 · -47.4%
Race, ethnicity, and origin ACS 2023
- Neighborhood character
- Predominantly Black (71%)
- Race & ethnicity
- Black 71% White 16% Two or more races 7% Hispanic / Latino 6%
- Hispanic origin (detail)
- Mexican 3% Puerto Rican 2%
- Common ancestry
- Arab 2% Romanian 2% Lithuanian 1%
- Foreign-born
- 11% · Canada
- Languages at home
- 82% English-only · Arabic 11% Spanish 5%
Political lean MEDSL · Wayne
- 2024 margin
- Strong D (+29.0) · D 62.7% · R 33.7% · Other 3.6%
- 2008→2024 swing
- -20.5pp toward R · 2008: 49.5pp · 2024: 29.0pp
- All cycles
- 2024: D+29.0 2020: D+38.1 2016: D+37.3 2012: D+46.9 2008: D+49.5
Not yet ingested
- Civics
- —
Market trends
- HPI YoY
- ▼ -160.81%
- Current HPI
- 168.6843
- Rent YoY
- ▼ -2.30%
- Metro
- Detroit-Warren-Dearborn, MI
- State GDP YoY
- ▲ 1.37%
- F500 in state
- 28
Industry mix (Fortune 500 HQ in MI)
| Industry | F500 HQs | Revenue |
|---|---|---|
| Automotive Parts | 3 | $48B |
|
||
| Automotive | 2 | $372B |
|
||
| Chemicals | 1 | $45B |
|
||
| Automotive Retail | 1 | $29B |
|
||
| Healthcare / Medical Devices | 1 | $23B |
|
||
| Automotive Technology | 1 | $20B |
|
||
Price history
+15.8% since first listed30 events — show timeline
- 2026-05-20 Listed $110,000 REALCOMP
- 2026-05-20 Listed $110,000 MiRealSource-MiMLS
- 2026-03-30 Listing Removed — REALCOMP
- 2026-03-30 Listing Removed — MiRealSource-MiMLS
- 2026-01-26 Listed $138,500 REALCOMP
- 2026-01-26 Listed $138,500 MiRealSource-MiMLS
- 2026-01-20 Listing Removed — REALCOMP
- 2026-01-20 Listing Removed — MiRealSource-MiMLS
- 2025-10-28 Listed $138,500 REALCOMP
- 2025-10-28 Listed $138,500 MiRealSource-MiMLS
- 2025-08-21 Listing Removed — MiRealSource-MiMLS
- 2025-07-31 Relisted — REALCOMP
- 2025-07-30 Listing Removed — REALCOMP
- 2025-06-26 Price Changed $129,500 MiRealSource-MiMLS
- 2025-06-25 Price Changed $129,500 REALCOMP
- 2025-06-10 Listing Removed — MiRealSource-MiMLS
- 2025-06-10 Listing Removed — REALCOMP
- 2025-06-10 Listed $135,000 REALCOMP
- 2025-06-10 Listed $135,000 MiRealSource-MiMLS
- 2025-06-04 Price Changed $135,000 MiRealSource-MiMLS
- 2025-06-03 Price Changed $135,000 REALCOMP
- 2025-05-02 Listed $140,000 MiRealSource-MiMLS
- 2025-05-02 Listed $140,000 REALCOMP
- 2019-07-22 Sold (Public Records) $58,500 Public Records
- 2009-08-03 Sold (MLS) $4,750 MiRealSource-MiMLS
- 2009-08-03 Sold (MLS) $4,750 REALCOMP
- 2009-07-15 Listing Removed — MiRealSource-MiMLS
- 2009-04-30 Listed $5,900 MiRealSource-MiMLS
- 2009-04-30 Listed $5,900 REALCOMP
- 2007-12-21 Sold (Public Records) $95,000 Public Records
Property tax history
+4.6%/yrLatest (2025): $2,146 · +76.7% YoY. Source: county tax records.
Cash-flow waterfall
monthlySold comps — $/sqft
last 12 mo · ≤1 miLoading sold comps…