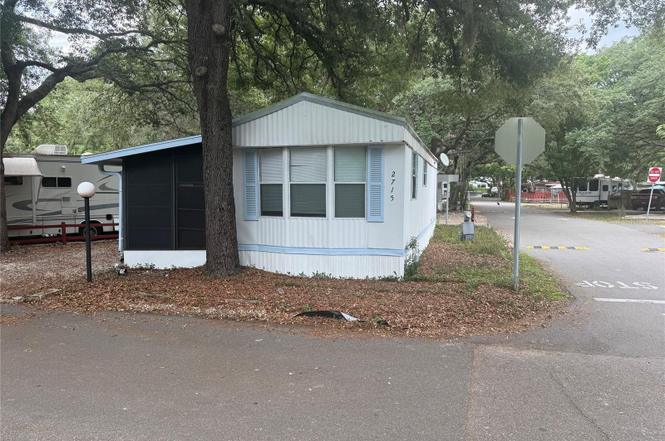
3000 Clarcona Rd #2715 · Clarcona, FL
Flood risk 1/10 · Minimal
- FEMA flood zone
- X (unshaded)
- Chance of flooding over 30 yrs
- 0.0%
- Est. flood insurance / yr
- $507 – $1,088
Fire risk 4/10 · Minor
- Est. fire insurance / yr
- $947 – $1,759
Heat risk 8/10 · Major
- Hot days now (above 108°F)
- 6 days/yr
- Hot days in 30 yrs
- 17 days/yr
Wind risk 9/10 · Severe
- Chance of severe wind over 30 yrs
- 99.0%
Air-quality risk 1/10 · Minimal
- Unhealthy air days now
- 0 days/yr
- Unhealthy air days in 30 yrs
- 0 days/yr
Risk factors via First Street. Map © Google.
Why this score? — see what drove the B- grade
The composite is a weighted blend of 9 inputs, each scored 0–100. Each bar is that input's sub-score; the figure is the points it added to the 100-point composite (weight × sub-score).
- Cash flow +30.0/30.0
- 1% rule +10.0/10.0
- DSCR +10.0/10.0
- ARV discount +7.5/15.0
- Schools +4.1/10.0
- Livability +3.1/5.0
- Condition / age +2.5/5.0
- Rent growth +1.8/5.0
- Appreciation +0.0/10.0
$79,900
🖨 Deal sheet 📄 Offer letter ✓ Due diligence
Listing remarks
PRICED TO SELL, motivated seller! This is a beautiful, well-maintained 1-bedroom, 1-bathroom home where you OWN THE LAND! This corner lot offers privacy, space, and is located in the gated community of Clarcona Resort. The home features a large enclosed patio for extra living space, laminate and tile floors throughout, and vaulted ceilings. There is on-site management, and by living in this community, you’ll have access to a wide range of amenities, including a pool, mini golf, rec hall, playground, and golf cart-friendly roads. There is also a detached shed that has been converted into a fully equipped laundry room. The HOA covers water, sewer, trash pickup, and 24-hour gated securit
Key facts
- Gated community
- Access to amenities
- Large enclosed patio
Tags
Property features AI
Finance
- Other: Partially furnished; No lease restrictions indicated
- Financial info: Total annual fees approx. $3,270
- HOA & community: Monthly association fee of $272.50; Association fees required; Pets allowed
Exterior
- Parking: Driveway
- Security: Gated community
- Utilities: Public water; Public sewer; Cable available; Public utilities
- Home design: Manufactured single-wide home; One level; Facing west
- Construction: Metal frame construction; Metal siding; Metal roof; Crawlspace foundation; Built on a small lot (approx. 0.05 acre)
- Exterior features: Corner lot; Paved lot/driveway; Storage shed
Interior
- Kitchen: Cooktop; Range; Range hood; Microwave; Refrigerator
- Bedrooms: 1 bedroom
- Flooring: Laminate; Tile; Other
- Bathrooms: 1 full bathroom
- Heating & cooling: Central heating; Central air
- Interior features: Ceiling fans; Eat-in kitchen; High ceilings; Kitchen/family room combo; Window treatments; Gated community
- Laundry & utility: Dedicated laundry room
Neighborhood map
What this means for you Summary
Snapshot
- This is a 2-bed/1.0-bath condo listed at $80k.
Deal economics
- At list price, monthly cash flow is $632 ($8k/yr) — positive.
- The deal already cash-flows at list — no discount required.
- Meets the 1% rule at list price ($2k rent vs $80k).
Location & tenants
- Location reads 61/100 on livability (#792 in FL) — a middle-class / working-renter tenant base. Strengths: cost of living A+, housing A+, crime B+; Watch: amenities F, commute F, employment F.
- Orange (suburban): math 46% / reading 51% proficiency, ranked #43 of 73 in FL (top 59%) — families likely to look elsewhere, expect single-tenant / working-renter base with shorter leases.
- Zoned schools: Prairie Lake Elementary (math 41% / reading 45%, grade F, #1,366 of 2,144 statewide, top 64%, 849 students, 59% FRL); Wekiva High (math 17% / reading 37%, grade F, #478 of 667 statewide, top 73%, 2,207 students, 62% FRL) — zoned schools at 60% FRL track the district average.
- Zoned-school proficiency averages 35% at this address vs 48% district-wide (-14 pts) — the specific schools serving this property underperform the Orange average; the district grade overstates school quality for this exact location.
- Market conditions: Rents soft (-2.8%/yr); 564 active listings in the ZIP; 2 comparable units currently listed for rent nearby; 8,053 units permitted in Orange County in 2024 (3,133 in 5+ unit buildings).
Forward outlook
- Local home prices are declining (-3.0%/yr); year-one equity from $552 of loan paydown is wiped out by about $2k of value loss. Plan a longer hold.
- Orange County population projected at +52% by 2050 — long-run rental-demand tailwind backs the buy-and-hold thesis.
- At projected returns (-3.0% appreciation + 0.0% rent growth), your $22k cash investment doubles in ~4 years — after that, you're playing with house money.
Negotiation context
- Only 8 days on market — expect competitive offers; lowballing is unlikely to land.
- 7 sale attempts since 6y ago with the ask held roughly flat each time — persistent listings suggest the price (not the market) is what's stuck; bring a comps-based counter.
- Current owner paid $64k; 25% above their basis — modest negotiation headroom, anchor on the comps not their cost.
Risks & watch-outs
- Climate carrying-cost: severe wind risk, 99% chance of damaging wind over 30y; extreme-heat days projected 6→17/yr by 2055 (HVAC capex compounding) — expect insurance premiums to compound above CPI over the hold.
Questions for the listing agent
- What does the HOA fee cover, when was the last increase, and are there any pending special assessments or reserve-fund shortfalls?
- Any open or pending special assessments — roof, HVAC, plumbing, elevator, façade? What's the per-unit balance and payoff schedule, and is the seller paying it off at close or rolling it to the buyer?
- Is there a deadline driving the sale (1031 exchange, divorce, estate, relocation)? That informs how much negotiation room exists.
- Schools are F-rated, which usually means shorter tenancies and higher turnover. Who's the typical renter profile here, and what's been the actual vacancy rate?
- What's the average days-on-market for RENTAL listings here right now (not sales)? A rising rental-DOM trend means longer vacancies and softer asking-rent achievability than the comps imply.
- What's the recent tenant-quality profile in this submarket — average credit score on applications, eviction rate, late-payment / NSF rate, and stable-employment percentage? A property-management company in the area should have these aggregated.
- How much new apartment / multifamily construction is in the pipeline within 1–3 miles? Heavy new supply (>2% of stock underway) typically softens rents 12–24 months out; light construction supports rent growth.
Investment metrics
- 1% rule
- 2.24% ✓
- Cap rate
- 15.78%
- Cash-on-cash
- 33.90%
- DSCR
- 2.51
- GRM
- 3.7
CMA / ARV
No comps found within radius.
Projected returns pro-forma
-3.0% appreciation · 0.0% rent growth · sell at horizon
- IRR
- 25.2%
- Equity multiple
- 1.99×
- Total profit
- $22,221
- Equity at exit
- $11,913
- IRR
- 30.7%
- Equity multiple
- 3.31×
- Total profit
- $51,572
- Equity at exit
- $6,908
Cash invested: $22,372 (down + closing). Projections, not guarantees.
Landlord ↔ Tenant lean methodology
- Overall (STATE)
- 87 Strongly Landlord-Friendly
- State Florida
- 87 Strongly Landlord-Friendly · R+3
- County
- — inherits STATE
- City
- — inherits STATE
ZIP-level market 32703
- Rents YoY
- -2.8%
- Active inventory
- 564
- Price-to-rent
- 3.7×
Monthly cashflow live
- Estimated rent
- $1,792 medium interval (Pro) →
- Mortgage (P&I)
- −$419
- Tax from tax record
- −$59 /mo · $711/yr
- Insurance
- −$33
- HOA
- −$272
- Vacancy / Maint / Mgmt
- −$376
- Net cashflow
- $632
Break-even live
UW: 25.0% down · 7.5% · 30yr · 1.5% tax · 5.0% vac · 8.0% maint · 8.0% mgmt
Financing live
Cash to close
- Down payment
- $19,975
- Closing costs
- $2,397
- Reserves months
- —
- Total cash needed
- —
Loan-product check · same deal, 3 products live
Conventional
25% down · 7.5% · 30yr
- Down + closing
- —
- Monthly P&I
- —
- Monthly cashflow
- —
- DSCR
- —
- Eligible?
- —
Personal DTI + credit; lowest rate.
DSCR
20% down · 8.5% · 30yr
- Down + closing
- —
- Monthly P&I
- —
- Monthly cashflow
- —
- DSCR
- —
- Eligible?
- —
No personal income docs; deal must DSCR.
Hard money
10% down · 12.0% · 12mo
- Down + closing
- —
- Monthly P&I
- —
- Monthly cashflow
- —
- DSCR
- —
- Eligible?
- —
Short-term bridge; refi at stabilization.
Rent comps 2 comps
| Address | Beds | Baths | Sqft | Rent | $/sqft | DOM | Units | Dist |
|---|---|---|---|---|---|---|---|---|
| 3000 Clarcona Rd Apopka, FL | 1.0–2.0 | 1.0–2.0 | 608 | $1,650 | $2.71 | 2d | 6 | 0.16mi |
| 3000 Clarcona Rd Apopka, FL | 1.0–2.0 | 1.0–2.0 | 608 | $1,695 | $2.79 | 8d | 6 | 0.16mi |
HOA detail condo
- Monthly dues
- $272 · $3,264/yr
- Likely covers
- watersewertrashpoolsecurity
- Assessments
- None detected in remarks — confirm with the listing agent.
Listing history 7 events
-
2026-06-18days on market $79,900 Active 8 DOM
-
2026-06-17days on market $79,900 Active 7 DOM
-
2026-06-16days on market $79,900 Active 6 DOM
-
2026-06-15days on market $79,900 Active 5 DOM
-
2026-06-13days on market $79,900 Active 3 DOM
-
2026-06-13remarks 693-char remark
-
2026-06-13$79,900 Active 2 DOM
ⓘ Source: listings_history table (triggers on properties + properties_extension) + one-shot
backfill from property_details.listing_events for pre-trigger history.
Tax reassessment forecast FL · Resets to sale price
- Current annual tax
- $711 · $59/mo
- Projected year-2 tax
- $711 · $59/mo
- Expected delta
- $0/yr ($0/mo · 0.0%)
ⓘ Screening estimate from a state-policy table — verify with the county assessor before closing.
Climate risk First Street
- Flood 1/10 Low FEMA zone X (unshaded) · 0% chance over 30 yrs
- Wildfire 4/10 Moderate
- Heat 8/10 Severe 6 d/yr ≥108°F today · 17 d/yr by 30 yrs out
- Wind 9/10 Extreme 99% chance of damaging wind over 30 yrs
- Air quality 1/10 Low 0 unhealthy d/yr today · 0 by 30 yrs out
Nearby sold comps map
Loading sold comps map…
Walkable amenities ~0.75 mi
Loading nearby amenities…
Taxation est. · year 1
- Rental income
- $21,501
- − Mortgage interest
- −$4,476
- − Property taxes
- −$711
- − Insurance
- −$400
- − Repairs & maintenance
- −$1,720
- − Management
- −$1,720
- − HOA
- −$3,264
- − Depreciation
- −$2,324
- Taxable income
- $6,887
- Est. tax owed @ 24.0%
- −$1,653
- After-tax cash flow
- $5,931/yr
For passive investors: Depreciation is non-cash, so a rental often shows a tax loss while cash-flowing — sheltering income. Rental losses are passive: they offset passive income freely, and up to $25,000/yr can offset ordinary (W-2) income if you actively participate and your MAGI is under $100k (phasing out to $0 by $150k); unused losses carry forward. On sale, claimed depreciation is recaptured at up to 25%, and gains may owe capital-gains tax (a 1031 exchange can defer both). Figures are a year-1 estimate at your 24.0% rate — not tax advice; consult a CPA.
Schools (NCES district)
- District
- Orange
- NCES district ID
- 1201440
- Math proficiency
- 46% ▼ -9.00%
- Reading proficiency
- 51% ▼ -2.00%
- Median HH income
- $49,350
- Composite
- 41.47/100
- National rank
- #3461
- State rank
- #43 of 73 in FL
Livability — Clarcona
- Score
- 61/100
- State rank
- #792
- US rank
- #18165
Category grades
Schools grade is shown separately in the Schools card above.
Census & demographics
- Census place
- Clarcona, FL
- County
- Orange County · 1,471,359 people
- Metro
- Orlando-Kissimmee-Sanford, FL
- Population (ZIP)
- 59,269
- Household income
- $72,880
- Rent vs Own
- Severe rent burden
- 2191.0
Population outlook (Orange County) Hauer SSP2
- Today (2025)
- 1,618,226 people
- By 2030
- 1,787,404 · +10.5%
- By 2040
- 2,125,621 · +31.4%
- By 2050
- 2,454,016 · +51.6%
- By 2075
- 3,173,711 · +96.1%
- By 2100
- 3,607,781 · +122.9%
Race, ethnicity, and origin ACS 2023
- Neighborhood character
- Highly diverse neighborhood (Simpson 0.71)
- Race & ethnicity
- White 35% Hispanic / Latino 30% Black 28% Two or more races 16% Asian 3%
- Hispanic origin (detail)
- Mexican 6% Puerto Rican 12% Cuban 3% Dominican 2%
- Common ancestry
- Hispanic 4% Romanian 1% Italian 1%
- Foreign-born
- 18% · Canada, Jamaica, Vietnam
- Languages at home
- 71% English-only · Spanish 22% French/Haitian/Cajun 3% Other Indo-European 1%
Political lean MEDSL · Orange
- 2024 margin
- D (+13.6) · D 56.1% · R 42.5% · Other 1.3%
- 2008→2024 swing
- -5.0pp toward R · 2008: 18.6pp · 2024: 13.6pp
- All cycles
- 2024: D+13.6 2020: D+23.1 2016: D+24.6 2012: D+18.2 2008: D+18.6
Not yet ingested
- Civics
- —
Market trends
- HPI YoY
- ▼ -206.30%
- Current HPI
- 319.2139
- Rent YoY
- ▼ -2.75%
- Metro
- Orlando-Kissimmee-Sanford, FL
- State GDP YoY
- ▲ 3.28%
- F500 in state
- 36
Industry mix (Fortune 500 HQ in FL)
| Industry | F500 HQs | Revenue |
|---|---|---|
| Industrial Technology | 2 | $29B |
|
||
| Insurance | 2 | $17B |
|
||
| Retail | 1 | $60B |
|
||
| Technology Distribution | 1 | $58B |
|
||
| Homebuilding | 1 | $35B |
|
||
| Technology Manufacturing | 1 | $35B |
|
||
Price history
+470.7% since first listed21 events — show timeline
- 2026-06-10 Listed $79,900 Stellar MLS as Distributed by MLS Grid
- 2025-12-06 Listing Removed — Stellar MLS as Distributed by MLS Grid
- 2025-10-22 Price Changed $75,000 Stellar MLS as Distributed by MLS Grid
- 2025-10-22 Relisted — Stellar MLS as Distributed by MLS Grid
- 2025-09-29 Price Changed $85,000 Stellar MLS as Distributed by MLS Grid
- 2025-09-29 Listing Removed — Stellar MLS as Distributed by MLS Grid
- 2025-06-06 Listed $90,000 Stellar MLS as Distributed by MLS Grid
- 2025-06-05 Listing Removed — Stellar MLS as Distributed by MLS Grid
- 2025-06-02 Listed $90,000 Stellar MLS as Distributed by MLS Grid
- 2024-04-06 Listing Removed — Stellar MLS as Distributed by MLS Grid
- 2024-01-16 Price Changed $95,000 Stellar MLS as Distributed by MLS Grid
- 2023-12-09 Relisted — Stellar MLS as Distributed by MLS Grid
- 2023-12-06 Pending — Stellar MLS as Distributed by MLS Grid
- 2023-10-31 Listed $98,500 Stellar MLS as Distributed by MLS Grid
- 2020-08-25 Sold (Public Records) $64,000 Public Records
- 2020-08-18 Sold (MLS) $64,000 Stellar MLS as Distributed by MLS Grid
- 2020-07-23 Pending — Stellar MLS as Distributed by MLS Grid
- 2020-04-23 Price Changed $64,000 Stellar MLS as Distributed by MLS Grid
- 2020-02-15 Listed $68,000 Stellar MLS as Distributed by MLS Grid
- 2001-03-02 Sold (Public Records) $19,000 Public Records
- 1995-06-14 Sold (Public Records) $14,000 Public Records
Property tax history
+5.7%/yrLatest (2025): $711 · +3.4% YoY. Source: county tax records.
Cash-flow waterfall
monthlySold comps — $/sqft
last 12 mo · ≤1 miLoading sold comps…