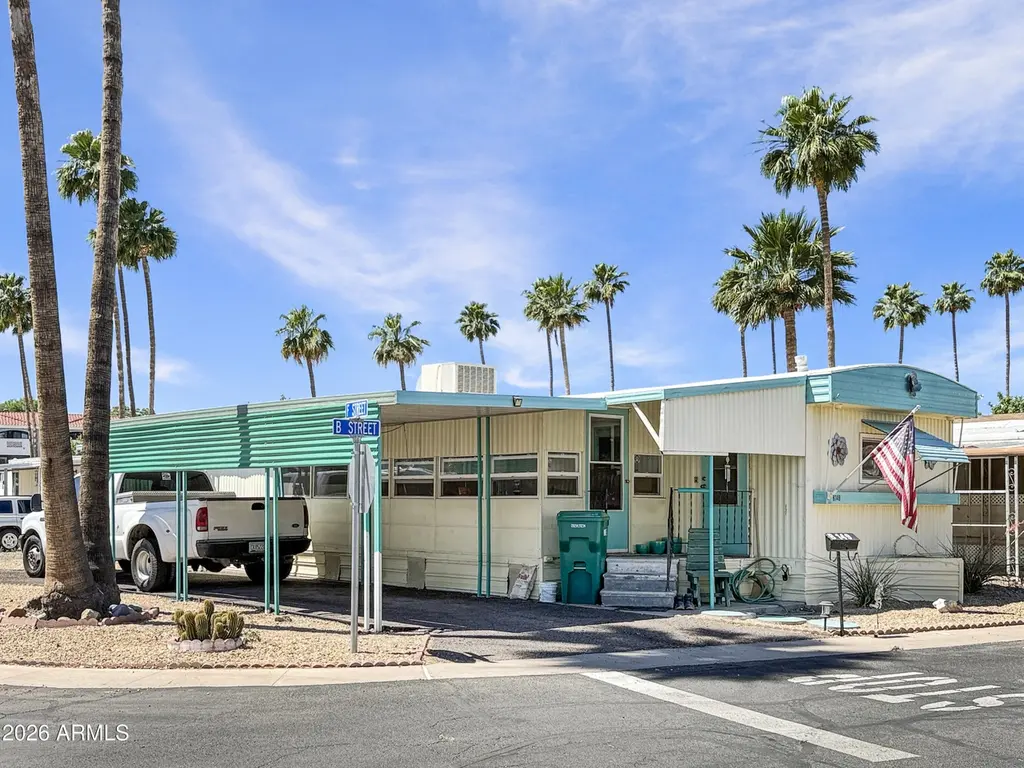
2050 W Dunlap Ave Unit B149 · Phoenix, AZ
Flood risk 3/10 · Minor
- FEMA flood zone
- X (shaded)
- Chance of flooding over 30 yrs
- 0.13%
- Est. flood insurance / yr
- $507 – $1,088
Fire risk 3/10 · Minor
- Est. fire insurance / yr
- $610 – $1,132
Heat risk 8/10 · Major
- Hot days now (above 112°F)
- 6 days/yr
- Hot days in 30 yrs
- 15 days/yr
Wind risk 1/10 · Minimal
- Chance of severe wind over 30 yrs
- —
Air-quality risk 3/10 · Minor
- Unhealthy air days now
- 3 days/yr
- Unhealthy air days in 30 yrs
- 4 days/yr
Risk factors via First Street. Map © Google.
Why this score? — see what drove the D grade
The composite is a weighted blend of 9 inputs, each scored 0–100. Each bar is that input's sub-score; the figure is the points it added to the 100-point composite (weight × sub-score).
- Cash flow +15.0/30.0
- ARV discount +7.5/15.0
- 1% rule +5.0/10.0
- DSCR +5.0/10.0
- Livability +3.8/5.0
- Condition / age +2.5/5.0
- Schools +2.3/10.0
- Rent growth +1.7/5.0
- Appreciation +0.0/10.0
$7,500
🖨 Deal sheet 📄 Offer letter ✓ Due diligence
Listing remarks
MOTIVATER SELLER. .. WILLING TO DO A SELLER CARRY!!! Tucked away on a quiet cul-de-sac in an active and welcoming 55+ community, this move-in-ready 2-bedroom, 1.5-bath home offers comfortable living with added versatility. A recently added bonus room provides the perfect space for a hobby room, office, or additional living area. Enjoy access to a beautifully remodeled recreation center featuring a swimming pool, relaxing spa, pickleball courts, and a variety of social amenities designed for an active lifestyle. Conveniently located near shopping, dining, and public transportation, this home offers the ideal blend of tranquility and convenience. Don't miss the opportunity to enjoy easy livin
Key facts
- 2 parking spots
- Community pool
- Built 1968
Property features AI
Finance
- HOA & community: Land lease: $1,010 monthly; No association fees; Community pool; Community spa (heated); Pickleball courts; Tennis courts; Community laundry; Near light rail stop; Near bus stop
Exterior
- Parking: 2 covered parking spaces; 2 carport spaces
- Security: Gated community
- Utilities: City water; Public sewer
- Home design: Manufactured/Mobile home; Leasehold ownership
- Construction: Steel frame and wood frame construction; Painted exterior
- Exterior features: Gravel/stone front; Gravel/stone back; No fencing; Metal roof
Interior
- Kitchen: Refrigerator; Dishwasher; Disposal
- Bedrooms: 2 possible bedrooms
- Flooring: Carpet; Laminate
- Bathrooms: 2 full bathrooms
- Heating & cooling: Natural gas heating; Central air conditioning; Ceiling fans
- Interior features: High speed internet available; No interior steps; Master bedroom with 3/4 bath
Neighborhood map
What this means for you Summary
Snapshot
- This is a 2-bed/2.0-bath manufactured listed at $8k.
Deal economics
- At list price, monthly cash flow is $936 ($11k/yr) — positive.
- The deal already cash-flows at list — no discount required.
- Meets the 1% rule at list price ($1k rent vs $8k).
- Recommended offer: $7k (3.0% below list) — sets the bar for market timing.
- Cap rate 156.0% vs local median 3.3% in Phoenix — top-decile yield for the area; either an underpriced asset or a hidden risk that comps aren't pricing in. Stress-test before assuming the spread holds.
Location & tenants
- Location reads 75/100 on livability (#16 in AZ, #3,924 nationally) — a middle-class / working-renter tenant base. Strengths: amenities A+, commute A+, housing A+; Watch: health & safety C-, crime F.
- Glendale Union High School District (4285) (urban): math 23% / reading 31% proficiency, ranked #130 of 249 in AZ (top 52%) — low school quality limits family demand, transient renter base, plan for 1-2y turnover.
- Market conditions: Rents falling (-3.1%/yr); 179 active listings in the ZIP; 40 comparable units currently listed for rent nearby; rentals leasing fast (median 1d on market — plan ~1-2 weeks tenant-placement turnaround); 36,011 units permitted in Maricopa County in 2024 (12,801 in 5+ unit buildings).
Forward outlook
- Local home prices are declining (-3.0%/yr); year-one equity from $52 of loan paydown is wiped out by about $225 of value loss. Plan a longer hold.
- Maricopa County population projected at +38% by 2050 — long-run rental-demand tailwind backs the buy-and-hold thesis.
- At projected returns (-3.0% appreciation + 0.0% rent growth), your $2k cash investment doubles in ~1 year — after that, you're playing with house money.
Negotiation context
- It's been on market 57 days — a 3% lower offer ($7k) is reasonable based on typical stale-listing flexibility.
Risks & watch-outs
- Climate carrying-cost: extreme-heat days projected 6→15/yr by 2055 (HVAC capex compounding) — expect insurance premiums to compound above CPI over the hold.
Questions for the listing agent
- It's been on market 57 days. Have you received any prior offers? Is the seller open to a 3% concession, seller financing, or rate buy-down credit?
- Built in 1968 — when were the roof, HVAC, electrical panel, plumbing, and water heater last replaced?
- Is there a deadline driving the sale (1031 exchange, divorce, estate, relocation)? That informs how much negotiation room exists.
- Crime grade is F in this area — have there been break-ins, vandalism, or insurance claims at this property in the last 3 years? What carrier currently insures it and at what premium?
- The area grade is low — what's the realistic commute time and amenity access for the typical tenant pool here? Any planned neighborhood developments (good or bad) we should know about?
- What's the average days-on-market for RENTAL listings here right now (not sales)? A rising rental-DOM trend means longer vacancies and softer asking-rent achievability than the comps imply.
- What's the recent tenant-quality profile in this submarket — average credit score on applications, eviction rate, late-payment / NSF rate, and stable-employment percentage? A property-management company in the area should have these aggregated.
- How much new for-sale + rental construction is in the pipeline within 1–3 miles? Heavy new supply typically softens prices + rents 12–24 months out; constrained supply supports both.
Investment metrics
- 1% rule
- 16.67% ✓
- Cap rate
- 155.99%
- Cash-on-cash
- 534.63%
- DSCR
- 24.79
- GRM
- 0.5
CMA / ARV
- ARV (on-the-fly)
- $41,440
- Comps found
- 2
Show comp detail 2 sales within ~0.75 mi
| Address | Dist | Beds/Ba | Sqft | Sold | Price | $/sf | Match |
|---|---|---|---|---|---|---|---|
| 2050 W Dunlap Ave Unit C103 | 0.19mi | 2/2.0 | 720 (-3%) | 12mo | $15,000 | $21 | 76 |
| 2050 W Dunlap Ave Unit E221 | 0.19mi | 2/1.0 | 720 (-3%) | 15mo | $40,000 | $56 | 70 |
Match score weights: distance 35% · size 25% · config 20% · recency 20%. Top-matched comps best support the ARV.
Projected returns pro-forma
-3.0% appreciation · 0.0% rent growth · sell at horizon
- IRR
- —
- Equity multiple
- 27.06×
- Total profit
- $54,729
- Equity at exit
- $1,118
- IRR
- —
- Equity multiple
- 53.53×
- Total profit
- $110,308
- Equity at exit
- $648
Cash invested: $2,100 (down + closing). Projections, not guarantees.
Landlord ↔ Tenant lean methodology
- Overall (STATE)
- 87 Strongly Landlord-Friendly
- State Arizona
- 87 Strongly Landlord-Friendly · R+3
- County
- — inherits STATE
- City
- — inherits STATE
ZIP-level market 85021
- Rents YoY
- -3.1%
- Active inventory
- 179
- Price-to-rent
- 0.5×
Monthly cashflow live
- Estimated rent
- $1,250 high interval (Pro) →
- Mortgage (P&I)
- −$39
- Tax est. 1.5%
- −$9 /mo · $112/yr
- Insurance
- −$3
- HOA
- −$0
- Vacancy / Maint / Mgmt
- −$262
- Net cashflow
- $936
Break-even live
UW: 25.0% down · 7.5% · 30yr · 1.5% tax · 5.0% vac · 8.0% maint · 8.0% mgmt
Financing live
Cash to close
- Down payment
- $1,875
- Closing costs
- $225
- Reserves months
- —
- Total cash needed
- —
Loan-product check · same deal, 3 products live
Conventional
25% down · 7.5% · 30yr
- Down + closing
- —
- Monthly P&I
- —
- Monthly cashflow
- —
- DSCR
- —
- Eligible?
- —
Personal DTI + credit; lowest rate.
DSCR
20% down · 8.5% · 30yr
- Down + closing
- —
- Monthly P&I
- —
- Monthly cashflow
- —
- DSCR
- —
- Eligible?
- —
No personal income docs; deal must DSCR.
Hard money
10% down · 12.0% · 12mo
- Down + closing
- —
- Monthly P&I
- —
- Monthly cashflow
- —
- DSCR
- —
- Eligible?
- —
Short-term bridge; refi at stabilization.
Rent comps 40 comps
| Address | Beds | Baths | Sqft | Rent | $/sqft | DOM | Units | Dist |
|---|---|---|---|---|---|---|---|---|
| 9202 N 19th Ave Phoenix, AZ | 2.0 | 1.0–2.0 | 645 | $1,550 | $2.40 | 1d | 8 | 0.18mi |
| 2220 W Mission Ln Phoenix, AZ | 1.0–3.0 | 1.0–2.0 | 944 | $1,647 | $1.74 | 1d | 67 | 0.21mi |
| 1814 W Vogel Ave Phoenix, AZ | 1.0–2.0 | 1.0 | 737 | $1,249 | $1.69 | 1d | 1 | 0.36mi |
| 8902 N 19th Ave Phoenix, AZ | 1.0–2.0 | 1.0–2.0 | 733 | $1,265 | $1.73 | 1d | 12 | 0.36mi |
| 1702 W Vogel Ave Unit C5 Phoenix, AZ | 2.0 | 1.0 | 750 | $845 | $1.13 | 14d | 1 | 0.45mi |
| 1703 W Mountain View Rd Phoenix, AZ | 1.0 | 1.0 | 625 | $795 | $1.27 | 1d | 1 | 0.49mi |
| 9633 N 17th Ave Unit 16 Phoenix, AZ | 1.0 | 1.0 | 650 | $1,095 | $1.68 | 1d | 1 | 0.49mi |
| 9633 N 17th Ave Unit 23 Phoenix, AZ | 2.0 | 1.0 | 735 | $1,395 | $1.90 | 13d | 1 | 0.49mi |
| 2323 W Dunlap Ave Phoenix, AZ | 1.0–2.0 | 1.0–2.0 | 788 | $1,370 | $1.74 | 1d | 9 | 0.53mi |
| 1614 W Purdue Ave Unit 202 Phoenix, AZ | 2.0 | 1.0 | 720 | $895 | $1.24 | 1d | 1 | 0.56mi |
| 8603 N 22nd Ave Phoenix, AZ | 1.0 | 1.0 | 400 | $1,214 | $3.04 | 1d | 6 | 0.60mi |
| 2506 W Dunlap Ave Phoenix, AZ | 2.0 | 1.0–2.0 | 719 | $1,480 | $2.06 | 1d | 14 | 0.63mi |
| 8530 N 22nd Ave Unit 1016 Phoenix, AZ | 1.0 | 1.0 | 632 | $1,099 | $1.74 | 24d | 1 | 0.66mi |
| 8530 N 22nd Ave Phoenix, AZ | 1.0–2.0 | 1.0–2.0 | 814 | $1,499 | $1.84 | 10d | 55 | 0.67mi |
| 8530 N 22nd Ave Unit 2041 Phoenix, AZ | 1.0 | 1.0 | 632 | $1,099 | $1.74 | 1d | 1 | 0.68mi |
| 2122 W Butler Dr Phoenix, AZ | 2.0 | 1.0–2.0 | 637 | $1,550 | $2.43 | 1d | 12 | 0.69mi |
| 8530 N 22nd Ave Unit 2057 Phoenix, AZ | 1.0 | 1.0 | 707 | $1,199 | $1.70 | 1d | 1 | 0.70mi |
| 8530 N 22nd Ave Unit 2051 Phoenix, AZ | 1.0 | 1.0 | 707 | $1,199 | $1.70 | 24d | 1 | 0.71mi |
| 1340 W Hatcher Rd Unit A2 Phoenix, AZ | 1.0 | 1.0 | 400 | $815 | $2.04 | 1d | 1 | 0.72mi |
| 1340 W Hatcher Rd Phoenix, AZ | 1.0 | 1.0 | 400 | $815 | $2.04 | 16d | 1 | 0.72mi |
| 8530 N 22nd Ave Unit 2119 Phoenix, AZ | 1.0 | 1.0 | 632 | $1,099 | $1.74 | 17d | 1 | 0.73mi |
| 1321 W Vogel Ave Unit 5 Phoenix, AZ | 2.0 | 1.0 | 621 | $1,050 | $1.69 | 1d | 1 | 0.77mi |
| 2045 W Butler Dr Phoenix, AZ | 1.0–3.0 | 1.0–2.0 | 738 | $1,202 | $1.63 | 1d | 14 | 0.79mi |
| 8330 N 19th Ave Phoenix, AZ | 1.0–2.0 | 1.0–2.0 | 818 | $1,440 | $1.76 | 1d | 24 | 0.82mi |
| 8445 N 23rd Ave Unit 244 Phoenix, AZ | 1.0 | 1.0 | 606 | $1,040 | $1.72 | 17d | 1 | 0.82mi |
| 2121 W Butler Dr Phoenix, AZ | 1.0–3.0 | 1.0–2.5 | 1025 | $2,095 | $2.04 | 1d | 33 | 0.84mi |
| 8445 N 23rd Ave Phoenix, AZ | 1.0 | 1.0 | 616 | $1,045 | $1.70 | 1d | 3 | 0.84mi |
| 1212 W Mountain View Rd Unit 1 Phoenix, AZ | 1.0 | 1.0 | 580 | $999 | $1.72 | 1d | 1 | 0.89mi |
| 1212 W Mountain View Rd Unit 7 Phoenix, AZ | 2.0 | 1.0 | 700 | $1,150 | $1.64 | 1d | 1 | 0.89mi |
| 10231 N 15th Ave Phoenix, AZ | 2.0 | 1.0 | 625 | $1,250 | $2.00 | 13d | 1 | 0.92mi |
| 8222 N 19th Ave Phoenix, AZ | 2.0 | 1.0–2.0 | 667 | $1,410 | $2.11 | 1d | 33 | 0.93mi |
| 10305 N 15th Ave Unit 03 Phoenix, AZ | 1.0 | 1.0 | 375 | $770 | $2.05 | 1d | 1 | 0.97mi |
| 9275 N 29th Ave Phoenix, AZ | 1.0–2.0 | 1.0–2.0 | 844 | $1,994 | $2.36 | 1d | 45 | 0.97mi |
| 9837 N 11th Ave Apt 3 Phoenix, AZ | 2.0 | 1.0 | 700 | $1,275 | $1.82 | 1d | 1 | 1.01mi |
| 1905 W Las Palmaritas Dr Phoenix, AZ | 2.0 | 1.0 | 535 | $1,317 | $2.46 | 1d | 23 | 1.01mi |
| 9647 N 10th Ave Unit 102 Phoenix, AZ | 1.0 | 1.0 | 350 | $700 | $2.00 | 1d | 1 | 1.04mi |
| 10219 N 12th Ave Unit 03 Phoenix, AZ | 2.0 | 1.0 | 750 | $1,250 | $1.67 | 1d | 1 | 1.05mi |
| 726 W Hatcher Rd Unit B-110 Phoenix, AZ | 1.0 | 1.0 | 640 | $1,066 | $1.67 | 1d | 1 | 1.10mi |
| 1408 W Becker Ln Unit 1 Phoenix, AZ | 2.0 | 1.0 | 700 | $1,150 | $1.64 | 11d | 1 | 1.11mi |
| 1627 W Desert Cove Ave Unit 1625 T1 Phoenix, AZ | 2.0 | 1.0 | 706 | $1,295 | $1.83 | 16d | 1 | 1.11mi |
Listing history 17 events
-
2026-06-18days on market $7,500 Active 57 DOM
-
2026-06-17days on market $7,500 Active 56 DOM
-
2026-06-16pricedays on market $7,500 Active 55 DOM
-
2026-06-15days on market $10,000 Active 54 DOM
-
2026-06-13days on market $10,000 Active 52 DOM
-
2026-06-09remarks 699-char remark
-
2026-06-09pricedays on market $10,000 Active 48 DOM
-
2026-06-08days on market $10,900 Active 47 DOM
-
2026-06-07days on market $10,900 Active 46 DOM
-
2026-06-04days on market $10,900 Active 43 DOM
-
2026-06-03days on market $10,900 Active 42 DOM
-
2026-06-02days on market $10,900 Active 41 DOM
-
2026-06-01days on market $10,900 Active 40 DOM
-
2026-05-31days on market $10,900 Active 39 DOM
-
2026-05-12price $15,000
-
2026-05-01price $19,990
-
2026-04-22$25,000 Active
ⓘ Source: listings_history table (triggers on properties + properties_extension) + one-shot
backfill from property_details.listing_events for pre-trigger history.
Climate risk First Street
- Flood 3/10 Moderate FEMA zone X (shaded) · 13% chance over 30 yrs
- Wildfire 3/10 Moderate
- Heat 8/10 Severe 6 d/yr ≥112°F today · 15 d/yr by 30 yrs out
- Wind 1/10 Low
- Air quality 3/10 Moderate 3 unhealthy d/yr today · 4 by 30 yrs out
Nearby sold comps map
Loading sold comps map…
Walkable amenities ~0.75 mi
Loading nearby amenities…
Taxation est. · year 1
- Rental income
- $14,999
- − Mortgage interest
- −$420
- − Property taxes
- −$112
- − Insurance
- −$38
- − Repairs & maintenance
- −$1,200
- − Management
- −$1,200
- − Depreciation
- −$218
- Taxable income
- $11,811
- Est. tax owed @ 24.0%
- −$2,835
- After-tax cash flow
- $8,393/yr
For passive investors: Depreciation is non-cash, so a rental often shows a tax loss while cash-flowing — sheltering income. Rental losses are passive: they offset passive income freely, and up to $25,000/yr can offset ordinary (W-2) income if you actively participate and your MAGI is under $100k (phasing out to $0 by $150k); unused losses carry forward. On sale, claimed depreciation is recaptured at up to 25%, and gains may owe capital-gains tax (a 1031 exchange can defer both). Figures are a year-1 estimate at your 24.0% rate — not tax advice; consult a CPA.
Schools (NCES district)
- District
- Glendale Union High School District (4285)
- NCES district ID
- 0403450
- Math proficiency
- 23% ▼ -38.00%
- Reading proficiency
- 31% ▼ -19.00%
- Median HH income
- $40,846
- Composite
- 22.81/100
- National rank
- #8020
- State rank
- #130 of 249 in AZ
Livability — Phoenix
- Score
- 75/100
- State rank
- #16
- US rank
- #3924
Category grades
Schools grade is shown separately in the Schools card above.
Census & demographics
- Census place
- Phoenix, AZ
- County
- Maricopa County · 4,537,380 people
- City population
- 1,500,198
- Metro
- Phoenix-Mesa-Chandler, AZ
- Population (ZIP)
- 39,828
- Household income
- $59,768
- Rent vs Own
- Severe rent burden
- 2553.0
Population outlook (Maricopa County) Hauer SSP2
- Today (2025)
- 4,979,203 people
- By 2030
- 5,378,229 · +8.0%
- By 2040
- 6,156,598 · +23.6%
- By 2050
- 6,872,376 · +38.0%
- By 2075
- 8,401,270 · +68.7%
- By 2100
- 9,247,439 · +85.7%
Race, ethnicity, and origin ACS 2023
- Neighborhood character
- Diverse neighborhood (Simpson 0.68)
- Race & ethnicity
- White 44% Hispanic / Latino 34% Two or more races 21% Black 12% Native American 4% Asian 2%
- Hispanic origin (detail)
- Mexican 27% Cuban 2%
- Common ancestry
- Italian 2% Slovak 1% Lithuanian 1%
- Foreign-born
- 16% · Canada
- Languages at home
- 73% English-only · Spanish 22% French/Haitian/Cajun 1% Other Asian/Pacific 1%
Political lean MEDSL · Maricopa
- 2024 margin
- Toss-up / Even · D 47.7% · R 51.2% · Other 1.1%
- 2008→2024 swing
- +7.1pp toward D · 2008: -10.6pp · 2024: -3.5pp
- All cycles
- 2024: R+3.5 2020: D+2.2 2016: R+3.5 2012: R+12.0 2008: R+10.6
Not yet ingested
- Civics
- —
Market trends
- HPI YoY
- ▼ -450.91%
- Current HPI
- 328.1754
- Rent YoY
- ▼ -3.08%
- Metro
- Phoenix-Mesa-Chandler, AZ
- State GDP YoY
- ▲ 4.54%
- F500 in state
- 20
Industry mix (Fortune 500 HQ in AZ)
| Industry | F500 HQs | Revenue |
|---|---|---|
| Technology | 2 | $13B |
|
||
| Mining / Metals | 1 | $23B |
|
||
| Environmental Services | 1 | $16B |
|
||
| Metals / Steel | 1 | $14B |
|
||
| Technology Distribution | 1 | $9B |
|
||
| Homebuilding | 1 | $8B |
|
||
Price history
-40.0% since first listed3 events — show timeline
- 2026-05-12 Price Changed $15,000 ARMLS
- 2026-05-01 Price Changed $19,990 ARMLS
- 2026-04-22 Listed $25,000 ARMLS
Cash-flow waterfall
monthlySold comps — $/sqft
last 12 mo · ≤1 miLoading sold comps…