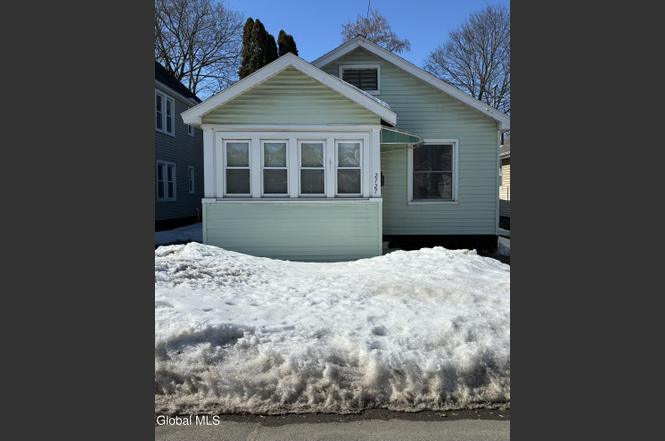
2727 Plunkett Ave · Rotterdam, NY
Flood risk 1/10 · Minimal
- FEMA flood zone
- X (unshaded)
- Chance of flooding over 30 yrs
- 0.0%
- Est. flood insurance / yr
- $473 – $860
Fire risk 3/10 · Minor
- Est. fire insurance / yr
- $691 – $1,283
Heat risk 4/10 · Minor
- Hot days now (above 96°F)
- 7 days/yr
- Hot days in 30 yrs
- 16 days/yr
Wind risk 2/10 · Minimal
- Chance of severe wind over 30 yrs
- 4.0%
Air-quality risk 1/10 · Minimal
- Unhealthy air days now
- 0 days/yr
- Unhealthy air days in 30 yrs
- 0 days/yr
Risk factors via First Street. Map © Google.
Why this score? — see what drove the C+ grade
The composite is a weighted blend of 9 inputs, each scored 0–100. Each bar is that input's sub-score; the figure is the points it added to the 100-point composite (weight × sub-score).
- Cash flow +25.8/30.0
- ARV discount +9.3/15.0
- DSCR +8.6/10.0
- 1% rule +6.6/10.0
- Schools +4.5/10.0
- Livability +3.9/5.0
- Rent growth +2.5/5.0
- Condition / age +2.5/5.0
- Appreciation +0.0/10.0
$175,000
🖨 Deal sheet 📄 Offer letter ✓ Due diligence
Listing remarks
Charming traditional-style home with 3 bedrooms and 1 full bath, offering just under 1,000 sq ft of comfortable living space. This inviting property blends character and functionality, starting with the enclosed front porch -- the perfect bonus space for morning coffee, a reading nook, or welcoming guests. Inside, you'll find a spacious living room that flows naturally into the dining area, creating an open feel that's ideal for both everyday living and entertaining. The eat-in kitchen offers room for casual meals and gatherings, while first-floor laundry adds everyday convenience. Central air conditioning keeps the home comfortable year-round. With a manageable layout and great potential t
Key facts
- 3,920 sq ft lot
- 2 parking spots
- Built 1909
Neighborhood map
What this means for you Summary
Snapshot
- This is a 3-bed/1.0-bath single-family listed at $175k.
Deal economics
- At list price, monthly cash flow is $426 ($5k/yr) — positive.
- The deal already cash-flows at list — no discount required.
- Meets the 1% rule at list price ($2k rent vs $175k).
- Cap rate 9.2% vs local median 3.0% in Rotterdam — top-decile yield for the area; either an underpriced asset or a hidden risk that comps aren't pricing in. Stress-test before assuming the spread holds.
Location & tenants
- Location reads 78/100 on livability (#161 in NY, #2,455 nationally) — a middle-class / working-renter tenant base. Strengths: housing A+, health & safety A+, employment B+; Watch: schools D+, crime F.
- Rotterdam-Mohonasen Central School District (suburban): math 48% / reading 56% proficiency, ranked #333 of 590 in NY (top 56%) — acceptable for families but not a draw, mixed tenant base, ~2y average lease.
- Market conditions: 181 active listings in the ZIP; 9 comparable units currently listed for rent nearby; rentals at typical pace (median 14d on market — plan ~3-4 weeks tenant-placement turnaround); solid renter incomes; 154 units permitted in Schenectady County in 2024 (54 in 5+ unit buildings).
Forward outlook
- Local home prices are declining (-3.0%/yr); year-one equity from $1k of loan paydown is wiped out by about $5k of value loss. Plan a longer hold.
- Schenectady County population projected to shrink 4% by 2050 — rents likely to lag national; underwrite the cash flow, not the appreciation.
Negotiation context
- Only 7 days on market — expect competitive offers; lowballing is unlikely to land.
Risks & watch-outs
- Watch-outs: built in 1909 — expect roof / HVAC / electrical / plumbing capex.
Questions for the listing agent
- Built in 1909 — when were the roof, HVAC, electrical panel, plumbing, and water heater last replaced?
- Is there a deadline driving the sale (1031 exchange, divorce, estate, relocation)? That informs how much negotiation room exists.
- Schools are D-rated, which usually means shorter tenancies and higher turnover. Who's the typical renter profile here, and what's been the actual vacancy rate?
- Crime grade is F in this area — have there been break-ins, vandalism, or insurance claims at this property in the last 3 years? What carrier currently insures it and at what premium?
- What's the average days-on-market for RENTAL listings here right now (not sales)? A rising rental-DOM trend means longer vacancies and softer asking-rent achievability than the comps imply.
- What's the recent tenant-quality profile in this submarket — average credit score on applications, eviction rate, late-payment / NSF rate, and stable-employment percentage? A property-management company in the area should have these aggregated.
- How much new for-sale + rental construction is in the pipeline within 1–3 miles? Heavy new supply typically softens prices + rents 12–24 months out; constrained supply supports both.
Investment metrics
- 1% rule
- 1.16% ✓
- Cap rate
- 9.21%
- Cash-on-cash
- 10.43%
- DSCR
- 1.46
- GRM
- 7.2
CMA / ARV
- ARV (on-the-fly)
- $182,160
- Comps found
- 12
Show comp detail 12 sales within ~0.75 mi
| Address | Dist | Beds/Ba | Sqft | Sold | Price | $/sf | Match |
|---|---|---|---|---|---|---|---|
| 474 Summer St | 0.11mi | 2/1.0 (-1) | 858 (+4%) | 15mo | $210,000 | $245 | 71 |
| 458 Eleventh St | 0.23mi | 2/1.0 (-1) | 864 (+4%) | 11mo | $170,000 | $197 | 68 |
| 2865 Plunkett Ave | 0.15mi | 2/1.0 (-1) | 894 (+8%) | 11mo | $160,000 | $179 | 65 |
| 2617 Hendricks St | 0.16mi | 2/1.0 (-1) | 792 (-4%) | 20mo | $146,500 | $185 | 64 |
| 902 Draper Ave | 0.28mi | 2/1.0 (-1) | 848 (+2%) | 19mo | $88,000 | $104 | 62 |
| 438 Olean St | 0.20mi | 3/1.5 | 912 (+10%) | 13mo | $195,000 | $214 | 61 |
| 3041 Granville Ave | 0.43mi | 3/1.0 | 920 (+11%) | 8mo | $202,000 | $220 | 54 |
| 233 Sixteenth St | 0.63mi | 3/1.0 | 920 (+11%) | 0mo | $205,000 | $223 | 52 |
| 312 Twelfth St | 0.43mi | 3/1.0 | 722 (-13%) | 10mo | $170,000 | $235 | 51 |
| 2732 Maida Ln | 0.72mi | 3/1.0 | 858 (+4%) | 12mo | $277,000 | $323 | 51 |
| 1221 Vinewood Ave | 0.64mi | 3/1.0 | 936 (+13%) | 2mo | $235,000 | $251 | 46 |
| 1026 Curry Rd | 0.51mi | 3/1.0 | 945 (+14%) | 12mo | $190,000 | $201 | 43 |
Match score weights: distance 35% · size 25% · config 20% · recency 20%. Top-matched comps best support the ARV.
Projected returns pro-forma
-3.0% appreciation · 3.0% rent growth · sell at horizon
- IRR
- -0.7%
- Equity multiple
- 0.98×
- Total profit
- $-1,211
- Equity at exit
- $26,093
- IRR
- 9.0%
- Equity multiple
- 1.69×
- Total profit
- $33,942
- Equity at exit
- $15,131
Cash invested: $49,000 (down + closing). Projections, not guarantees.
Landlord ↔ Tenant lean methodology
- Overall (STATE)
- 15 Strongly Tenant-Friendly
- State New York
- 15 Strongly Tenant-Friendly · D+10
- County
- — inherits STATE
- City
- — inherits STATE
ZIP-level market 12306
- Home prices YoY
- -23.8%
- Active inventory
- 181
- Price-to-rent
- 7.2×
Monthly cashflow live
- Estimated rent
- $2,037 high interval (Pro) →
- Mortgage (P&I)
- −$918
- Tax from tax record
- −$193 /mo · $2,315/yr
- Insurance
- −$73
- HOA
- −$0
- Vacancy / Maint / Mgmt
- −$428
- Net cashflow
- $426
Break-even live
UW: 25.0% down · 7.5% · 30yr · 1.5% tax · 5.0% vac · 8.0% maint · 8.0% mgmt
Financing live
Cash to close
- Down payment
- $43,750
- Closing costs
- $5,250
- Reserves months
- —
- Total cash needed
- —
Loan-product check · same deal, 3 products live
Conventional
25% down · 7.5% · 30yr
- Down + closing
- —
- Monthly P&I
- —
- Monthly cashflow
- —
- DSCR
- —
- Eligible?
- —
Personal DTI + credit; lowest rate.
DSCR
20% down · 8.5% · 30yr
- Down + closing
- —
- Monthly P&I
- —
- Monthly cashflow
- —
- DSCR
- —
- Eligible?
- —
No personal income docs; deal must DSCR.
Hard money
10% down · 12.0% · 12mo
- Down + closing
- —
- Monthly P&I
- —
- Monthly cashflow
- —
- DSCR
- —
- Eligible?
- —
Short-term bridge; refi at stabilization.
Rent comps 9 comps
| Address | Beds | Baths | Sqft | Rent | $/sqft | DOM | Units | Dist |
|---|---|---|---|---|---|---|---|---|
| 611 Cramer Ave Schenectady, NY | 3.0 | 1.0 | 1100 | $2,295 | $2.09 | 13d | 1 | 0.06mi |
| 1826 Campbell Ave Schenectady, NY | 3.0 | 1.0 | 1000 | $1,600 | $1.60 | 13d | 1 | 0.75mi |
| 418 Third St Schenectady, NY | 3.0 | 1.0 | 1000 | $2,200 | $2.20 | 13d | 1 | 0.76mi |
| 1120 Pleasant St Schenectady, NY | 3.0 | 1.0 | 1000 | $1,500 | $1.50 | 14d | 1 | 1.33mi |
| 1130 Pleasant St Schenectady, NY | 2.0 | 1.0 | 1069 | $1,300 | $1.22 | 43d | 1 | 1.34mi |
| 3 Lent Ct Unit 1 Schenectady, NY | 2.0 | 1.0 | 800 | $1,375 | $1.72 | 23d | 1 | 1.37mi |
| 105 Long Pond Dr Schenectady, NY | 1.0–2.0 | 1.0–2.0 | 925 | $1,900 | $2.05 | 13d | 1 | 1.38mi |
| 1729 Ferguson St Schenectady, NY | 2.0 | 1.0 | 850 | $1,730 | $2.04 | 14d | 1 | 1.40mi |
| 1121 10th Ave Schenectady, NY | 2.0 | 1.0 | 800 | $1,250 | $1.56 | 23d | 1 | 1.47mi |
Listing history 2 events
-
2026-03-10status Pending
-
2026-03-03$175,000 Active
ⓘ Source: listings_history table (triggers on properties + properties_extension) + one-shot
backfill from property_details.listing_events for pre-trigger history.
Tax reassessment forecast NY · Partial reset (capped growth)
- Current annual tax
- $2,315 · $193/mo
- Projected year-2 tax
- $2,636 · $220/mo
- Expected delta
- +$321/yr (+$27/mo · 13.9%)
ⓘ Screening estimate from a state-policy table — verify with the county assessor before closing.
Climate risk First Street
- Flood 1/10 Low FEMA zone X (unshaded) · 0% chance over 30 yrs
- Wildfire 3/10 Moderate
- Heat 4/10 Moderate 7 d/yr ≥96°F today · 16 d/yr by 30 yrs out
- Wind 2/10 Low 4% chance of damaging wind over 30 yrs
- Air quality 1/10 Low 0 unhealthy d/yr today · 0 by 30 yrs out
Nearby sold comps map
Loading sold comps map…
Walkable amenities ~0.75 mi
Loading nearby amenities…
Taxation est. · year 1
- Rental income
- $24,449
- − Mortgage interest
- −$9,803
- − Property taxes
- −$2,315
- − Insurance
- −$875
- − Repairs & maintenance
- −$1,956
- − Management
- −$1,956
- − Depreciation
- −$5,091
- Taxable income
- $2,453
- Est. tax owed @ 24.0%
- −$589
- After-tax cash flow
- $4,523/yr
For passive investors: Depreciation is non-cash, so a rental often shows a tax loss while cash-flowing — sheltering income. Rental losses are passive: they offset passive income freely, and up to $25,000/yr can offset ordinary (W-2) income if you actively participate and your MAGI is under $100k (phasing out to $0 by $150k); unused losses carry forward. On sale, claimed depreciation is recaptured at up to 25%, and gains may owe capital-gains tax (a 1031 exchange can defer both). Figures are a year-1 estimate at your 24.0% rate — not tax advice; consult a CPA.
Schools (NCES district)
- District
- Rotterdam-Mohonasen Central School District
- NCES district ID
- 3600004
- Math proficiency
- 48% ▼ -4.00%
- Reading proficiency
- 56% ▲ 9.00%
- Median HH income
- $59,640
- Composite
- 45.34/100
- National rank
- #2638
- State rank
- #333 of 590 in NY
Livability — Rotterdam
- Score
- 78/100
- State rank
- #161
- US rank
- #2455
Category grades
Schools grade is shown separately in the Schools card above.
Census & demographics
- Census place
- Rotterdam, NY
- County
- Schenectady County · 141,369 people
- Metro
- Albany-Schenectady-Troy, NY
- Population (ZIP)
- 27,865
- Household income
- $83,202
- Rent vs Own
- Severe rent burden
- 629.0
Population outlook (Schenectady County) Hauer SSP2
- Today (2025)
- 155,046 people
- By 2030
- 154,322 · -0.5%
- By 2040
- 151,796 · -2.1%
- By 2050
- 148,621 · -4.1%
- By 2075
- 141,229 · -8.9%
- By 2100
- 126,014 · -18.7%
Race, ethnicity, and origin ACS 2023
- Neighborhood character
- Predominantly White (78%)
- Race & ethnicity
- White 78% Two or more races 8% Black 7% Hispanic / Latino 7% Asian 3%
- Hispanic origin (detail)
- Puerto Rican 4% Dominican 1%
- Common ancestry
- Romanian 7% Lithuanian 5% Iranian 3%
- Foreign-born
- 6% · Canada
- Languages at home
- 94% English-only · Spanish 3% Other Indo-European 1% Other Asian/Pacific 1%
Political lean MEDSL · Schenectady
- 2024 margin
- D (+10.8) · D 55.4% · R 44.6%
- 2008→2024 swing
- -1.8pp toward R · 2008: 12.7pp · 2024: 10.8pp
- All cycles
- 2024: D+10.8 2020: D+15.7 2016: D+5.8 2012: D+15.4 2008: D+12.7
Not yet ingested
- Civics
- —
Market trends
- HPI YoY
- ▼ -91.35%
- Current HPI
- 292.1229
- Rent YoY
- —
- Metro
- Albany-Schenectady-Troy, NY
- State GDP YoY
- ▲ 2.60%
- F500 in state
- 92
Industry mix (Fortune 500 HQ in NY)
| Industry | F500 HQs | Revenue |
|---|---|---|
| Financial Services | 10 | $950B |
|
||
| Consumer Goods | 9 | $162B |
|
||
| Insurance | 4 | $225B |
|
||
| Telecommunications | 2 | $144B |
|
||
| Pharmaceuticals | 2 | $112B |
|
||
| Media / Entertainment | 2 | $69B |
|
||
Price history
2 events — show timeline
- 2026-03-10 Pending — Global MLS
- 2026-03-03 Listed $175,000 Global MLS
Property tax history
+1.9%/yrLatest (2025): $2,315 · +2.1% YoY. Source: county tax records.
Cash-flow waterfall
monthlySold comps — $/sqft
last 12 mo · ≤1 miLoading sold comps…