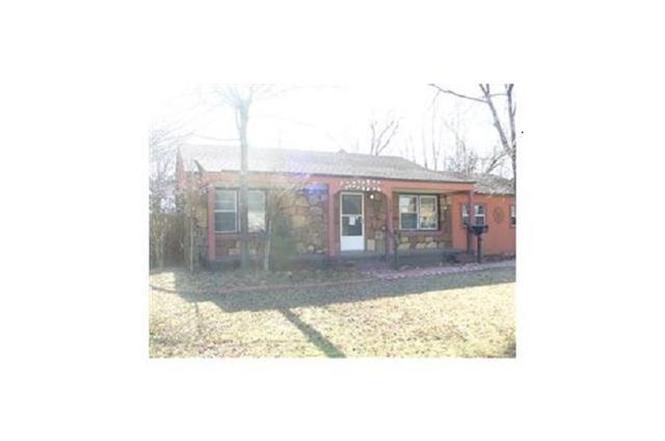
420 W Johnson St · Norman, OK
Flood risk 1/10 · Minimal
- FEMA flood zone
- X (unshaded)
- Chance of flooding over 30 yrs
- 0.0%
- Est. flood insurance / yr
- $507 – $1,088
Fire risk 1/10 · Minimal
- Est. fire insurance / yr
- $2,463 – $4,575
Heat risk 6/10 · Moderate
- Hot days now (above 108°F)
- 7 days/yr
- Hot days in 30 yrs
- 19 days/yr
Wind risk 2/10 · Minimal
- Chance of severe wind over 30 yrs
- 4.0%
Air-quality risk 2/10 · Minimal
- Unhealthy air days now
- 1 days/yr
- Unhealthy air days in 30 yrs
- 1 days/yr
Risk factors via First Street. Map © Google.
Why this score? — see what drove the D grade
The composite is a weighted blend of 9 inputs, each scored 0–100. Each bar is that input's sub-score; the figure is the points it added to the 100-point composite (weight × sub-score).
- Cash flow +13.8/30.0
- ARV discount +8.3/15.0
- Rent growth +4.4/5.0
- DSCR +4.2/10.0
- Livability +4.2/5.0
- 1% rule +3.0/10.0
- Schools +2.6/10.0
- Condition / age +2.5/5.0
- Appreciation +0.0/10.0
$213,000
🖨 Deal sheet (PDF) 📄 Offer letter ✓ Due diligence
Listing remarks MLS
Nice home just waiting for somebody to make it special. Building in back has gas, electric and plumbing.
Key facts
- New metal roof
- Fresh paint
- Remodeled kitchen
Tags
Property features AI
Finance
- Other: Existing property; Homestead not claimed
- Financial info: Listing offered As Is; Financing: Conventional, FHA or VA accepted; Not assumable
- HOA & community: No mandatory association dues
Exterior
- Parking: Concrete parking; 1-car garage
- Utilities: Public utilities
- Home design: Single family residence; One level; Residential property
- Construction: Frame, stone and stucco construction; Metal roof (2025); Double pane low-E windows; Conventional foundation
- Exterior features: Covered porch; Open deck; Outbuildings; Wood fencing; Interior lot
Interior
- Kitchen: Dishwasher; Disposal; Microwave; Refrigerator; Electric range (free standing); Electric oven (free standing)
- Bedrooms: 3 bedrooms
- Flooring: Combination flooring; Carpet; Vinyl
- Bathrooms: 2 full bathrooms
- Heating & cooling: Electric heating
- Interior features: Ceiling fans; In-law plan
Neighborhood map
What this means for you Summary
Snapshot
- This is a 3-bed/2.0-bath single-family listed at $213k.
Deal economics
- At list price, monthly cash flow is $18 ($212/yr) — positive.
- The deal already cash-flows at list — no discount required.
- To meet the 1% rule (rent ≥ 1% of price), the offer needs to be $171k (19.7% below list).
- Recommended offer: $171k (19.7% below list) — sets the bar for 1% rule.
- Cap rate 6.4% vs local median 3.6% in Norman — top-decile yield for the area; either an underpriced asset or a hidden risk that comps aren't pricing in. Stress-test before assuming the spread holds.
Location & tenants
- Location reads 85/100 on livability (#1 in OK, #557 nationally) — a professional / high-income tenant draw. Strengths: amenities A+, commute A+, cost of living A+.
- Norman (suburban): math 27% / reading 32% proficiency, ranked #61 of 270 in OK (top 23%) — low school quality limits family demand, transient renter base, plan for 1-2y turnover.
- Zoned schools: Adams Es (math 16% / reading 20%, grade F, #534 of 845 statewide, top 64%, 550 students, 0% FRL); Whittier Ms (math 25% / reading 32%, grade F, #57 of 345 statewide, top 18%, 1,016 students, 0% FRL); Norman North Hs (math 45% / reading 57%, grade D+, #2 of 447 statewide, top 0%, 2,401 students, 0% FRL) — zoned schools average 0% FRL vs 39% district-wide (39 pts lower); this property's tenant base skews higher-income than the district average.
- Market conditions: Rents rising fast (+7.7%/yr); 253 active listings in the ZIP; 30 comparable units currently listed for rent nearby; rentals at typical pace (median 16d on market — plan ~3-4 weeks tenant-placement turnaround); 592 units permitted in Cleveland County in 2024 (12 in 5+ unit buildings).
- This rent runs 35% of the median local income ($59k/yr) — at the standard rent-burdened threshold; future hikes will face affordability resistance.
Forward outlook
- Local home prices are declining (-3.0%/yr); year-one equity from $1k of loan paydown is wiped out by about $6k of value loss. Plan a longer hold.
- Cleveland County population projected at +40% by 2050 — long-run rental-demand tailwind backs the buy-and-hold thesis.
Negotiation context
- It's been on market 188 days — a 12% lower offer ($187k) is reasonable based on typical stale-listing flexibility.
- 7 sale attempts since 26y ago; this cycle's ask has dropped $12k (5%) from the opening price — seller is motivated, your offer sets the floor, not the list.
- Current owner paid $60k; list at $213k implies a 255% gain — meaningful room to come down on a strong offer.
Risks & watch-outs
- Watch-outs: built in 1950 — expect roof / HVAC / electrical / plumbing capex.
- Climate carrying-cost: extreme-heat days projected 7→19/yr by 2055 (HVAC capex compounding) — expect insurance premiums to compound above CPI over the hold.
Questions for the listing agent
- It's been on market 188 days. Have you received any prior offers? Is the seller open to a 20% concession, seller financing, or rate buy-down credit?
- Built in 1950 — when were the roof, HVAC, electrical panel, plumbing, and water heater last replaced?
- Why hasn't it sold? Are there any deal-killer items the seller is aware of (foundation, flood, title, zoning, code violations)?
- Is there a deadline driving the sale (1031 exchange, divorce, estate, relocation)? That informs how much negotiation room exists.
- The area grade is low — what's the realistic commute time and amenity access for the typical tenant pool here? Any planned neighborhood developments (good or bad) we should know about?
- What's the average days-on-market for RENTAL listings here right now (not sales)? A rising rental-DOM trend means longer vacancies and softer asking-rent achievability than the comps imply.
- What's the recent tenant-quality profile in this submarket — average credit score on applications, eviction rate, late-payment / NSF rate, and stable-employment percentage? A property-management company in the area should have these aggregated.
- How much new for-sale + rental construction is in the pipeline within 1–3 miles? Heavy new supply typically softens prices + rents 12–24 months out; constrained supply supports both.
Investment metrics
- 1% rule
- 0.80% ✗
- Cap rate
- 6.39%
- Cash-on-cash
- 0.35%
- DSCR
- 1.02
- GRM
- 10.4
CMA / ARV
- ARV (on-the-fly)
- $216,720
- Comps found
- 12
Show comp detail 12 sales within ~0.75 mi
| Address | Dist | Beds/Ba | Sqft | Sold | Price | $/sf | Match |
|---|---|---|---|---|---|---|---|
| 416 W Mosier St | 0.11mi | 3/2.0 | 1,350 (-10%) | 4mo | $214,999 | $159 | 74 |
| 609 Utah St | 0.31mi | 3/1.5 | 1,383 (-8%) | 6mo | $189,000 | $137 | 65 |
| 725 Hartman Dr | 0.27mi | 3/1.0 | 1,310 (-13%) | 0mo | $93,000 | $71 | 62 |
| 607 Nebraska St | 0.43mi | 3/1.0 | 1,342 (-11%) | 2mo | $182,000 | $136 | 56 |
| 320 N Peters Ave | 0.61mi | 3/2.0 | 1,409 (-6%) | 6mo | $345,000 | $245 | 56 |
| 1603 Denison Dr | 0.74mi | 4/2.0 (+1) | 1,486 (-1%) | 3mo | $214,000 | $144 | 56 |
| 1534 Ashley Cir | 0.73mi | 3/2.0 | 1,573 (+4%) | 6mo | $235,000 | $149 | 54 |
| 502 Kansas St | 0.52mi | 3/1.0 | 1,370 (-9%) | 4mo | $174,800 | $128 | 53 |
| 219 E Dale St | 0.61mi | 3/2.0 | 1,692 (+12%) | 1mo | $175,000 | $103 | 50 |
| 1706 N Peters Ave | 0.71mi | 3/2.0 | 1,689 (+12%) | 4mo | $195,000 | $115 | 44 |
| 1203 Barbour St | 0.75mi | 3/2.0 | 1,309 (-13%) | 0mo | $215,000 | $164 | 43 |
| 306 E Hughbert St | 0.61mi | 4/3.0 (+1) | 1,719 (+14%) | 5mo | $355,000 | $207 | 35 |
Match score weights: distance 35% · size 25% · config 20% · recency 20%. Top-matched comps best support the ARV.
Projected returns pro-forma
-3.0% appreciation · 7.66% rent growth · sell at horizon
- IRR
- -11.1%
- Equity multiple
- 0.58×
- Total profit
- $-25,056
- Equity at exit
- $31,759
- IRR
- 3.4%
- Equity multiple
- 1.29×
- Total profit
- $17,324
- Equity at exit
- $18,416
Cash invested: $59,640 (down + closing). Projections, not guarantees.
Landlord ↔ Tenant lean methodology
- Overall (STATE)
- 83 Strongly Landlord-Friendly
- State Oklahoma
- 83 Strongly Landlord-Friendly · R+20
- County
- — inherits STATE
- City
- — inherits STATE
ZIP-level market 73069
- Rents YoY
- 7.7%
- Active inventory
- 253
- Price-to-rent
- 10.4×
Monthly cashflow live
- Estimated rent
- $1,710 high interval (Pro) →
- Mortgage (P&I)
- −$1,117
- Tax from tax record
- −$128 /mo · $1,532/yr
- Insurance
- −$89
- HOA
- −$0
- Vacancy / Maint / Mgmt
- −$359
- Net cashflow
- $18
Break-even live
Sensitivity live
| Price | -10% $138 | -5% $78 | +0% $18 | +5% $-43 | +10% $-103 |
|---|---|---|---|---|---|
| Rent | -10% $-117 | -5% $-50 | +0% $18 | +5% $85 | +10% $153 |
| Rate | -1.0pp $125 | -0.5pp $72 | base $18 | +0.5pp $-38 | +1.0pp $-94 |
UW: 25.0% down · 7.5% · 30yr · 1.5% tax · 5.0% vac · 8.0% maint · 8.0% mgmt
Financing live
Cash to close
- Down payment
- $53,250
- Closing costs
- $6,390
- Reserves months
- —
- Total cash needed
- —
Loan-product check · same deal, 3 products live
Conventional
25% down · 7.5% · 30yr
- Down + closing
- —
- Monthly P&I
- —
- Monthly cashflow
- —
- DSCR
- —
- Eligible?
- —
Personal DTI + credit; lowest rate.
DSCR
20% down · 8.5% · 30yr
- Down + closing
- —
- Monthly P&I
- —
- Monthly cashflow
- —
- DSCR
- —
- Eligible?
- —
No personal income docs; deal must DSCR.
Hard money
10% down · 12.0% · 12mo
- Down + closing
- —
- Monthly P&I
- —
- Monthly cashflow
- —
- DSCR
- —
- Eligible?
- —
Short-term bridge; refi at stabilization.
Rent comps 30 comps
| Address | Beds | Baths | Sqft | Rent | $/sqft | DOM | Units | Dist |
|---|---|---|---|---|---|---|---|---|
| 106 W Mosier St Norman, OK | 4.0 | 2.0 | 1762 | $2,150 | $1.22 | 25d | 1 | 0.34mi |
| 712 Dakota St Norman, OK | 3.0 | 1.0 | 1353 | $1,395 | $1.03 | 5d | 1 | 0.35mi |
| 751 Iowa St Norman, OK | 3.0 | 1.0 | 1148 | $1,600 | $1.39 | 5d | 1 | 0.39mi |
| 418 N Flood Ave Norman, OK | 3.0 | 1.0 | 1200 | $1,600 | $1.33 | 5d | 1 | 0.50mi |
| 809 Woods Ave Norman, OK | 3.0 | 2.0 | 1556 | $1,550 | $1.00 | 25d | 1 | 0.53mi |
| 227 W Ridge Rd Norman, OK | 3.0 | 2.0 | 1172 | $1,420 | $1.21 | 16d | 1 | 0.53mi |
| 101 E Haddock St Norman, OK | 3.0 | 1.0 | 1146 | $1,425 | $1.24 | 16d | 1 | 0.56mi |
| 1008 Woods Ave Norman, OK | 3.0 | 1.5 | 1690 | $1,500 | $0.89 | 13d | 1 | 0.63mi |
| 1202 Glenwood St Norman, OK | 3.0 | 1.5 | 1221 | $1,600 | $1.31 | 16d | 1 | 0.66mi |
| 800 Lexington St Norman, OK | 3.0 | 2.0 | 1056 | $1,259 | $1.19 | 3d | 1 | 0.68mi |
| 1607 Denison Dr Norman, OK | 3.0 | 1.5 | 1357 | $1,595 | $1.18 | 25d | 1 | 0.77mi |
| 421 Foreman Ave Norman, OK | 4.0 | 2.0 | 2070 | $2,600 | $1.26 | 13d | 1 | 0.78mi |
| 523 E Main St #1 Norman, OK | 2.0 | 2.0 | 1144 | $1,400 | $1.22 | 12d | 1 | 0.92mi |
| 1005 W Eufaula St Norman, OK | 2.0 | 2.0 | 1100 | $1,350 | $1.23 | 5d | 1 | 0.94mi |
| 211 Skylark Ct #213 Norman, OK | 2.0 | 1.5 | 1050 | $1,050 | $1.00 | 22d | 1 | 0.98mi |
| 101 Maple Ln Norman, OK | 3.0 | 1.0 | 1164 | $1,700 | $1.46 | 25d | 1 | 1.00mi |
| 1205 Westlawn Dr Norman, OK | 3.0 | 1.5 | 1440 | $1,600 | $1.11 | 25d | 1 | 1.15mi |
| 1505 Shrill Ct Norman, OK | 3.0 | 2.0 | 1818 | $2,195 | $1.21 | 25d | 1 | 1.16mi |
| 1222 Camden Way Norman, OK | 4.0 | 2.0 | 2030 | $2,600 | $1.28 | 16d | 1 | 1.17mi |
| 1215 Westlawn Dr Norman, OK | 3.0 | 2.0 | 1795 | $2,195 | $1.22 | 16d | 1 | 1.17mi |
| 1510 Huntington Way Norman, OK | 3.0 | 1.0 | 1176 | $1,550 | $1.32 | 22d | 1 | 1.20mi |
| 321 E Duffy St Unit A Norman, OK | 2.0 | 1.0 | 1650 | $1,450 | $0.88 | 5d | 1 | 1.25mi |
| 212 S Mercedes Dr Norman, OK | 3.0 | 1.5 | 1066 | $1,400 | $1.31 | 25d | 1 | 1.26mi |
| 1530 Melrose Dr Norman, OK | 3.0 | 1.0 | 1266 | $1,400 | $1.11 | 25d | 1 | 1.31mi |
| 805 Grickle Dr Norman, OK | 3.0 | 2.0 | 1405 | $1,550 | $1.10 | 5d | 1 | 1.32mi |
| 1005 Classen Blvd Norman, OK | 4.0 | 2.0 | 2018 | $2,700 | $1.34 | 5d | 1 | 1.37mi |
| 930 Miller Ave Norman, OK | 2.0 | 2.0 | 1050 | $1,545 | $1.47 | 5d | 1 | 1.37mi |
| 1219 Leslie Ln Norman, OK | 4.0 | 2.5 | 1875 | $2,495 | $1.33 | 16d | 1 | 1.38mi |
| 222 McCullough Norman, OK | 3.0 | 2.0 | 1175 | $3,300 | $2.81 | 25d | 1 | 1.40mi |
| 1214 Cruce St Norman, OK | 4.0 | 2.0 | 1882 | $3,200 | $1.70 | 13d | 1 | 1.47mi |
Listing history 27 events
-
2026-06-18days on market $213,000 Active 188 DOM
-
2026-06-17days on market $213,000 Active 187 DOM
-
2026-06-16days on market $213,000 Active 186 DOM
-
2026-06-15days on market $213,000 Active 185 DOM
-
2026-06-13days on market $213,000 Active 183 DOM
-
2026-06-09days on market $213,000 Active 179 DOM
-
2026-06-08days on market $213,000 Active 178 DOM
-
2026-06-07days on market $213,000 Active 177 DOM
-
2026-06-05days on market $213,000 Active 174 DOM
-
2026-06-03days on market $213,000 Active 173 DOM
-
2026-06-02days on market $213,000 Active 172 DOM
-
2026-06-01days on market $213,000 Active 171 DOM
-
2026-05-31days on market $213,000 Active 170 DOM
-
2026-05-04status Active
-
2026-04-26status Active
-
2026-03-05price $214,975
-
2026-01-12price $219,900
-
2025-11-25$225,000 Active
-
2014-07-01soldstatus $60,000 104-char remark
Show marketing remark (104 chars)
Nice home just waiting for somebody to make it special. Building in back has gas, electric and plumbing.
-
2014-01-08$69,900 104-char remark
Show marketing remark (104 chars)
Nice home just waiting for somebody to make it special. Building in back has gas, electric and plumbing.
-
2007-12-19historical
-
2007-07-21historical
-
2006-10-19$96,400
-
2002-09-23historical
-
2001-11-08$99,000
-
2000-08-16$83,000
-
1993-09-15soldstatus $34,500
ⓘ Source: listings_history table (triggers on properties + properties_extension) + one-shot
backfill from property_details.listing_events for pre-trigger history.
Tax reassessment forecast OK · Resets to sale price
- Current annual tax
- $1,532 · $128/mo
- Projected year-2 tax
- $1,917 · $160/mo
- Expected delta
- +$385/yr (+$32/mo · 25.1%)
ⓘ Screening estimate from a state-policy table — verify with the county assessor before closing.
Climate risk First Street
- Flood 1/10 Low FEMA zone X (unshaded) · 0% chance over 30 yrs
- Wildfire 1/10 Low
- Heat 6/10 Major 7 d/yr ≥108°F today · 19 d/yr by 30 yrs out
- Wind 2/10 Low 4% chance of damaging wind over 30 yrs
- Air quality 2/10 Low 1 unhealthy d/yr today · 1 by 30 yrs out
Nearby sold comps map
Loading sold comps map…
Walkable amenities ~0.75 mi
Loading nearby amenities…
Taxation est. · year 1
- Rental income
- $20,522
- − Mortgage interest
- −$11,931
- − Property taxes
- −$1,532
- − Insurance
- −$1,065
- − Repairs & maintenance
- −$1,642
- − Management
- −$1,642
- − Depreciation
- −$6,196
- Taxable loss
- −$3,486
- Est. tax savings @ 24.0%
- +$837
- After-tax cash flow
- $1,048/yr
For passive investors: Depreciation is non-cash, so a rental often shows a tax loss while cash-flowing — sheltering income. Rental losses are passive: they offset passive income freely, and up to $25,000/yr can offset ordinary (W-2) income if you actively participate and your MAGI is under $100k (phasing out to $0 by $150k); unused losses carry forward. On sale, claimed depreciation is recaptured at up to 25%, and gains may owe capital-gains tax (a 1031 exchange can defer both). Figures are a year-1 estimate at your 24.0% rate — not tax advice; consult a CPA.
Schools (NCES district)
- District
- Norman
- NCES district ID
- 4021720
- Math proficiency
- 27% ▼ -9.00%
- Reading proficiency
- 32% ▼ -8.00%
- Median HH income
- $48,940
- Composite
- 25.67/100
- National rank
- #7395
- State rank
- #61 of 270 in OK
Livability — Norman
- Score
- 85/100
- State rank
- #1
- US rank
- #557
Category grades
Schools grade is shown separately in the Schools card above.
Census & demographics
- Census place
- Norman, OK
- County
- Cleveland County · 239,547 people
- City population
- 123,141
- Metro
- Oklahoma City, OK
- Population (ZIP)
- 28,462
- Household income
- $58,888
- Rent vs Own
- Severe rent burden
- 1704.0
Population outlook (Cleveland County) Hauer SSP2
- Today (2025)
- 323,621 people
- By 2030
- 349,070 · +7.9%
- By 2040
- 400,168 · +23.7%
- By 2050
- 454,101 · +40.3%
- By 2075
- 602,926 · +86.3%
- By 2100
- 734,485 · +127.0%
Race, ethnicity, and origin ACS 2023
- Neighborhood character
- Diverse neighborhood (Simpson 0.56)
- Race & ethnicity
- White 64% Two or more races 15% Hispanic / Latino 14% Native American 4% Black 4% Asian 3% Pacific Islander 1%
- Hispanic origin (detail)
- Mexican 9%
- Common ancestry
- Lithuanian 3% Italian 3% Slovak 2%
- Foreign-born
- 9% · Canada, China
- Languages at home
- 84% English-only · Spanish 10% Other Indo-European 1% Chinese 1%
Political lean MEDSL · Cleveland
- 2024 margin
- R (+14.9) · D 41.4% · R 56.4% · Other 2.2%
- 2008→2024 swing
- +9.1pp toward D · 2008: -24.0pp · 2024: -14.9pp
- All cycles
- 2024: R+14.9 2020: R+14.1 2016: R+21.7 2012: R+25.9 2008: R+24.0
Not yet ingested
- Civics
- —
Market trends
- HPI YoY
- ▼ -252.79%
- Current HPI
- 272.4754
- Rent YoY
- ▲ 7.66%
- Metro
- Oklahoma City, OK
- State GDP YoY
- ▲ 1.55%
- F500 in state
- 6
Industry mix (Fortune 500 HQ in OK)
| Industry | F500 HQs | Revenue |
|---|---|---|
| Energy | 3 | $48B |
|
||
Price history
+523.1% since first listed14 events — show timeline
- 2026-05-04 Relisted — MLSOK
- 2026-04-26 Relisted — MLSOK
- 2026-03-05 Price Changed $214,975 MLSOK
- 2026-01-12 Price Changed $219,900 MLSOK
- 2025-11-25 Listed $225,000 MLSOK
- 2014-07-01 Sold (MLS) $60,000 MLSOK
- 2014-01-08 Listed $69,900 MLSOK
- 2007-12-19 Listing Removed — MLSOK
- 2007-07-21 Listing Removed — MLSOK
- 2006-10-19 Listed $96,400 MLSOK
- 2002-09-23 Listing Removed — MLSOK
- 2001-11-08 Listed $99,000 MLSOK
- 2000-08-16 Listed $83,000 MLSOK
- 1993-09-15 Sold (Public Records) $34,500 Public Records
Property tax history
+4.7%/yrLatest (2024): $1,532 · +4.7% YoY. Source: county tax records.
Cash-flow waterfall
monthlySold comps — $/sqft
last 12 mo · ≤1 miLoading sold comps…