1104 15th St SE · Paris, TX
Flood risk 1/10 · Minimal
- FEMA flood zone
- X (unshaded)
- Chance of flooding over 30 yrs
- 0.0%
- Est. flood insurance / yr
- $507 – $1,088
Fire risk 6/10 · Moderate
- Est. fire insurance / yr
- $1,222 – $2,270
Heat risk 7/10 · Major
- Hot days now (above 110°F)
- 7 days/yr
- Hot days in 30 yrs
- 21 days/yr
Wind risk 4/10 · Minor
- Chance of severe wind over 30 yrs
- 21.0%
Air-quality risk 2/10 · Minimal
- Unhealthy air days now
- 0 days/yr
- Unhealthy air days in 30 yrs
- 1 days/yr
Risk factors via First Street. Map © Google.
Why this score? — see what drove the B+ grade
The composite is a weighted blend of 9 inputs, each scored 0–100. Each bar is that input's sub-score; the figure is the points it added to the 100-point composite (weight × sub-score).
- Cash flow +30.0/30.0
- ARV discount +15.0/15.0
- 1% rule +10.0/10.0
- DSCR +10.0/10.0
- Livability +3.1/5.0
- Schools +3.0/10.0
- Rent growth +2.5/5.0
- Condition / age +2.5/5.0
- Appreciation +0.0/10.0
$89,000
🖨 Deal sheet (PDF) 📄 Offer letter ✓ Due diligence
Listing remarks
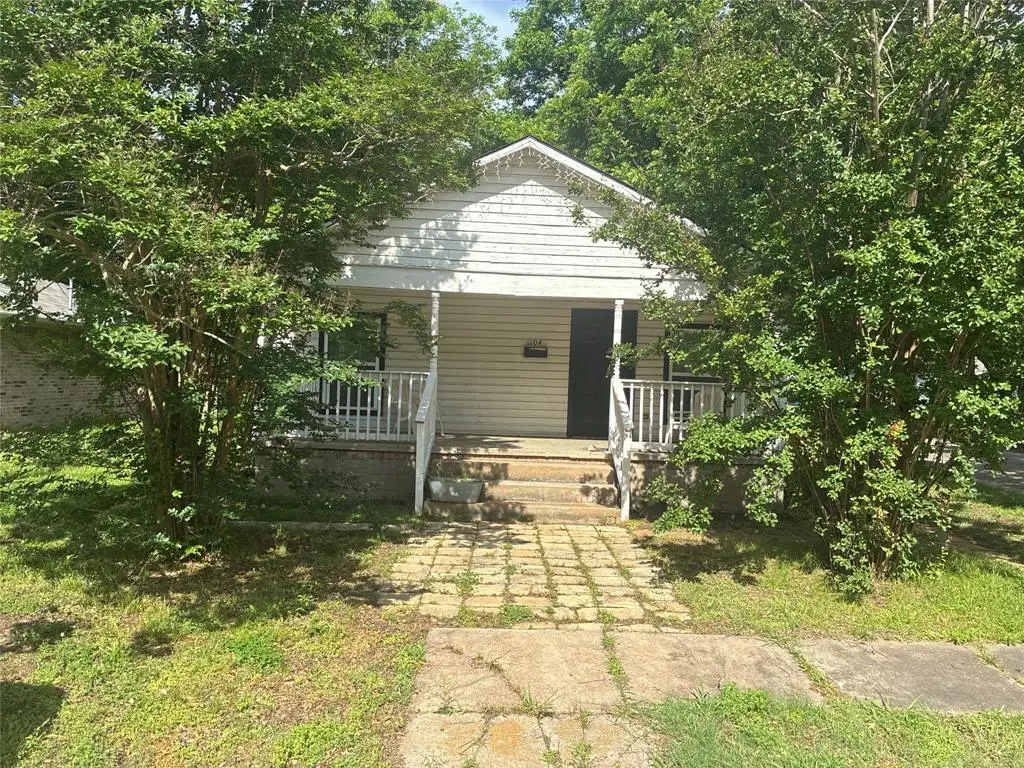
This charming 3 bed 1 bath house is located near downtown Paris Tx. It is the perfect location and just a short drive to enjoy all of the events that happen downtown and you get to enjoy all the wonderful Restaurant's while you are there. This house also includes a beautiful front porch where you can drink your coffee in the mornings and feel the nice morning breeze. It will be a corner lot, the house is white with front covered front porch. Next door will be a new house built next to it.
Key facts
- 6,360 sq ft lot
- Built 1930
- Listed 36 days
Property features AI
Finance
- HOA & community: No association
Exterior
- Parking: Off-street parking; Gravel parking
- Security: Fire alarm
- Utilities: City water; City sewer; Natural gas available
- Home design: Single-family residence; One story; Residential property
- Construction: Built in 1930; Wood construction; Shingle roof; Pillar/post/pier foundation
- Exterior features: Covered patio/porch
Interior
- Kitchen: Gas range; Electric oven
- Bedrooms: Three bedrooms (all on the main level) — two primary bedrooms approx. 13 x 13 and one bedroom approx. 10 x 10
- Flooring: Hardwood floors
- Bathrooms: One full bathroom
- Heating & cooling: Central heating (electric); Central air conditioning; Ceiling fans
- Interior features: Five total rooms; One living area; One dining area; Fire alarm
- Laundry & utility: Washer hookup; Electric dryer hookup; Utility room with space for freezer
Neighborhood map
What this means for you Summary
Snapshot
- This is a 3-bed/1.0-bath single-family listed at $89k.
Deal economics
- At list price, monthly cash flow is $528 ($6k/yr) — positive.
- The deal already cash-flows at list — no discount required.
- Meets the 1% rule at list price ($1k rent vs $89k).
- Recommended offer: $86k (3.0% below list) — sets the bar for market timing.
- Cap rate 13.4% vs local median 3.6% in Paris — top-decile yield for the area; either an underpriced asset or a hidden risk that comps aren't pricing in. Stress-test before assuming the spread holds.
Location & tenants
- Location reads 61/100 on livability (#984 in TX) — a middle-class / working-renter tenant base. Strengths: cost of living A+, housing A+; Watch: schools D+, crime F, amenities F.
- Paris ISD (town): math 36% / reading 37% proficiency, ranked #521 of 826 in TX (top 63%) — families likely to look elsewhere, expect single-tenant / working-renter base with shorter leases; 70% free/reduced lunch — lower-income household profile, screen leases tightly.
- Market conditions: 274 active listings in the ZIP; 5 comparable units currently listed for rent nearby; rentals lingering (median 45d on market — plan ~5-8 weeks vacancy on turnover, expect pricing pressure); 100% of comp listings sitting > 30 days — soft ceiling on asking rent; 119 units permitted in Lamar County in 2024 (71 in 5+ unit buildings).
- This rent runs 38% of the median local income ($46k/yr) — at the standard rent-burdened threshold; future hikes will face affordability resistance.
Forward outlook
- Local home prices are declining (-3.0%/yr); year-one equity from $615 of loan paydown is wiped out by about $3k of value loss. Plan a longer hold.
- Lamar County population projected at -13% by 2050 — secular population decline; favor cash flow + early exit over multi-decade hold.
- At projected returns (-3.0% appreciation + 3.0% rent growth), your $25k cash investment doubles in ~5 years — after that, you're playing with house money.
Negotiation context
- It's been on market 37 days — a 3% lower offer ($86k) is reasonable based on typical stale-listing flexibility.
- 2 sale attempts; this cycle's ask has dropped $20k (18%) from the opening price — seller is motivated, your offer sets the floor, not the list.
Risks & watch-outs
- Watch-outs: built in 1930 — expect roof / HVAC / electrical / plumbing capex.
- Climate carrying-cost: major wildfire risk; extreme-heat days projected 7→21/yr by 2055 (HVAC capex compounding) — expect insurance premiums to compound above CPI over the hold.
Questions for the listing agent
- It's been on market 37 days. Have you received any prior offers? Is the seller open to a 3% concession, seller financing, or rate buy-down credit?
- Built in 1930 — when were the roof, HVAC, electrical panel, plumbing, and water heater last replaced?
- Is there a deadline driving the sale (1031 exchange, divorce, estate, relocation)? That informs how much negotiation room exists.
- Schools are D-rated, which usually means shorter tenancies and higher turnover. Who's the typical renter profile here, and what's been the actual vacancy rate?
- Crime grade is F in this area — have there been break-ins, vandalism, or insurance claims at this property in the last 3 years? What carrier currently insures it and at what premium?
- What's the average days-on-market for RENTAL listings here right now (not sales)? A rising rental-DOM trend means longer vacancies and softer asking-rent achievability than the comps imply.
- What's the recent tenant-quality profile in this submarket — average credit score on applications, eviction rate, late-payment / NSF rate, and stable-employment percentage? A property-management company in the area should have these aggregated.
- How much new for-sale + rental construction is in the pipeline within 1–3 miles? Heavy new supply typically softens prices + rents 12–24 months out; constrained supply supports both.
Investment metrics
- 1% rule
- 1.66% ✓
- Cap rate
- 13.41%
- Cash-on-cash
- 25.41%
- DSCR
- 2.13
- GRM
- 5.0
CMA / ARV
- ARV (on-the-fly)
- $144,160
- Comps found
- 12
Show comp detail 12 sales within ~0.75 mi
| Address | Dist | Beds/Ba | Sqft | Sold | Price | $/sf | Match |
|---|---|---|---|---|---|---|---|
| 1070 15th St SE | 0.02mi | 2/1.0 (-1) | 1,414 (+4%) | 5mo | $31,400 | $22 | 84 |
| 718 12th St SE | 0.30mi | 3/1.0 | 1,440 (+6%) | 3mo | $65,000 | $45 | 73 |
| 1735 Bella Vis | 0.32mi | 3/2.0 | 1,393 (+2%) | 10mo | $199,900 | $144 | 68 |
| 2121 Cedar St | 0.40mi | 3/2.0 | 1,394 (+2%) | 9mo | $150,000 | $108 | 66 |
| 2131 Hubbard St | 0.69mi | 2/1.0 (-1) | 1,369 (+1%) | 4mo | $95,000 | $69 | 59 |
| 670 SE 22nd St SE | 0.51mi | 3/2.0 | 1,316 (-3%) | 11mo | $159,500 | $121 | 58 |
| 2025 Cedar St | 0.37mi | 3/2.0 | 1,552 (+14%) | 4mo | $164,500 | $106 | 52 |
| 2440 Cleveland | 0.75mi | 3/1.5 | 1,399 (+3%) | 11mo | $149,900 | $107 | 49 |
| 2252 Cleveland St | 0.67mi | 3/1.5 | 1,508 (+11%) | 10mo | $139,900 | $93 | 40 |
| 2430 Culbertson St | 0.72mi | 3/2.0 | 1,224 (-10%) | 7mo | $135,000 | $110 | 40 |
| 351 NE 6th St NE | 0.67mi | 4/1.5 (+1) | 1,480 (+9%) | 9mo | $90,000 | $61 | 40 |
| 1347 E Houston St | 0.73mi | 2/2.0 (-1) | 1,542 (+13%) | 2mo | $79,000 | $51 | 33 |
Match score weights: distance 35% · size 25% · config 20% · recency 20%. Top-matched comps best support the ARV.
Projected returns pro-forma
-3.0% appreciation · 3.0% rent growth · sell at horizon
- IRR
- 19.0%
- Equity multiple
- 1.77×
- Total profit
- $19,219
- Equity at exit
- $13,270
- IRR
- 27.3%
- Equity multiple
- 3.41×
- Total profit
- $60,151
- Equity at exit
- $7,695
Cash invested: $24,920 (down + closing). Projections, not guarantees.
Landlord ↔ Tenant lean methodology
- Overall (STATE)
- 87 Strongly Landlord-Friendly
- State Texas
- 87 Strongly Landlord-Friendly · R+5
- County
- — inherits STATE
- City
- — inherits STATE
ZIP-level market 75460
- Active inventory
- 274
- Price-to-rent
- 5.0×
Monthly cashflow live
- Estimated rent
- $1,473 high interval (Pro) →
- Mortgage (P&I)
- −$467
- Tax from tax record
- −$132 /mo · $1,590/yr
- Insurance
- −$37
- HOA
- −$0
- Vacancy / Maint / Mgmt
- −$309
- Net cashflow
- $528
Break-even live
Sensitivity live
| Price | -10% $578 | -5% $553 | +0% $528 | +5% $502 | +10% $477 |
|---|---|---|---|---|---|
| Rent | -10% $411 | -5% $469 | +0% $528 | +5% $586 | +10% $644 |
| Rate | -1.0pp $572 | -0.5pp $550 | base $528 | +0.5pp $505 | +1.0pp $481 |
UW: 25.0% down · 7.5% · 30yr · 1.5% tax · 5.0% vac · 8.0% maint · 8.0% mgmt
Financing live
Cash to close
- Down payment
- $22,250
- Closing costs
- $2,670
- Reserves months
- —
- Total cash needed
- —
Loan-product check · same deal, 3 products live
Conventional
25% down · 7.5% · 30yr
- Down + closing
- —
- Monthly P&I
- —
- Monthly cashflow
- —
- DSCR
- —
- Eligible?
- —
Personal DTI + credit; lowest rate.
DSCR
20% down · 8.5% · 30yr
- Down + closing
- —
- Monthly P&I
- —
- Monthly cashflow
- —
- DSCR
- —
- Eligible?
- —
No personal income docs; deal must DSCR.
Hard money
10% down · 12.0% · 12mo
- Down + closing
- —
- Monthly P&I
- —
- Monthly cashflow
- —
- DSCR
- —
- Eligible?
- —
Short-term bridge; refi at stabilization.
Rent comps 5 comps
| Address | Beds | Baths | Sqft | Rent | $/sqft | DOM | Units | Dist |
|---|---|---|---|---|---|---|---|---|
| 2121 Cedar St Paris, TX | 3.0 | 2.0 | 1394 | $2,000 | $1.43 | 44d | 1 | 0.40mi |
| 2246 Simpson St Paris, TX | 3.0 | 1.0 | 1508 | $1,250 | $0.83 | 44d | 1 | 0.57mi |
| 649 E Price St Paris, TX | 2.0 | 1.0 | 900 | $1,100 | $1.22 | 44d | 1 | 0.91mi |
| 370 29th St NE Paris, TX | 3.0 | 1.0 | 1220 | $1,200 | $0.98 | 44d | 1 | 1.34mi |
| 3215 Clarksville St Paris, TX | 1.0–2.0 | 1.0 | 895 | $1,395 | $1.56 | 44d | 1 | 1.46mi |
Listing history 17 events
-
2026-06-19days on market $89,000 Active 37 DOM
-
2026-06-18days on market $89,000 Active 36 DOM
-
2026-06-17days on market $89,000 Active 35 DOM
-
2026-06-16days on market $89,000 Active 34 DOM
-
2026-06-15days on market $89,000 Active 33 DOM
-
2026-06-14days on market $89,000 Active 31 DOM
-
2026-06-12days on market $89,000 Active 30 DOM
-
2026-06-09days on market $89,000 Active 27 DOM
-
2026-06-08days on market $89,000 Active 26 DOM
-
2026-06-07days on market $89,000 Active 25 DOM
-
2026-06-03days on market $89,000 Active 21 DOM
-
2026-06-02pricedays on market $89,000 Active 20 DOM
-
2026-06-01days on market $109,000 Active 19 DOM
-
2026-05-31days on market $109,000 Active 18 DOM
-
2026-05-31days on market $109,000 Active 17 DOM
-
2026-05-15status Active
-
2026-05-11$109,000 Active
ⓘ Source: listings_history table (triggers on properties + properties_extension) + one-shot
backfill from property_details.listing_events for pre-trigger history.
Tax reassessment forecast TX · Resets to sale price
- Current annual tax
- $1,590 · $132/mo
- Projected year-2 tax
- $1,629 · $136/mo
- Expected delta
- +$39/yr (+$3/mo · 2.5%)
ⓘ Screening estimate from a state-policy table — verify with the county assessor before closing.
Climate risk First Street
- Flood 1/10 Low FEMA zone X (unshaded) · 0% chance over 30 yrs
- Wildfire 6/10 Major
- Heat 7/10 Severe 7 d/yr ≥110°F today · 21 d/yr by 30 yrs out
- Wind 4/10 Moderate 21% chance of damaging wind over 30 yrs
- Air quality 2/10 Low 0 unhealthy d/yr today · 1 by 30 yrs out
Nearby sold comps map
Loading sold comps map…
Walkable amenities ~0.75 mi
Loading nearby amenities…
Taxation est. · year 1
- Rental income
- $17,680
- − Mortgage interest
- −$4,985
- − Property taxes
- −$1,590
- − Insurance
- −$445
- − Repairs & maintenance
- −$1,414
- − Management
- −$1,414
- − Depreciation
- −$2,589
- Taxable income
- $5,242
- Est. tax owed @ 24.0%
- −$1,258
- After-tax cash flow
- $5,074/yr
For passive investors: Depreciation is non-cash, so a rental often shows a tax loss while cash-flowing — sheltering income. Rental losses are passive: they offset passive income freely, and up to $25,000/yr can offset ordinary (W-2) income if you actively participate and your MAGI is under $100k (phasing out to $0 by $150k); unused losses carry forward. On sale, claimed depreciation is recaptured at up to 25%, and gains may owe capital-gains tax (a 1031 exchange can defer both). Figures are a year-1 estimate at your 24.0% rate — not tax advice; consult a CPA.
Schools (NCES district)
- District
- Paris ISD
- NCES district ID
- 4834290
- Math proficiency
- 36% ▼ -11.00%
- Reading proficiency
- 37% ▼ -1.00%
- Median HH income
- $31,515
- Composite
- 29.83/100
- National rank
- #6419
- State rank
- #521 of 826 in TX
Livability — Paris
- Score
- 61/100
- State rank
- #984
- US rank
- #17535
Category grades
Schools grade is shown separately in the Schools card above.
Census & demographics
- Census place
- Paris, TX
- County
- Lamar County · 23,426 people
- City population
- 23,426
- Metro
- Paris, TX
- Population (ZIP)
- 23,426
- Household income
- $46,473
- Rent vs Own
- Severe rent burden
- 1355.0
Population outlook (Lamar County) Hauer SSP2
- Today (2025)
- 48,319 people
- By 2030
- 47,160 · -2.4%
- By 2040
- 44,621 · -7.7%
- By 2050
- 42,024 · -13.0%
- By 2075
- 36,577 · -24.3%
- By 2100
- 30,580 · -36.7%
Race, ethnicity, and origin ACS 2023
- Neighborhood character
- Diverse neighborhood (Simpson 0.60)
- Race & ethnicity
- White 58% Black 22% Hispanic / Latino 13% Two or more races 8%
- Hispanic origin (detail)
- Mexican 12%
- Common ancestry
- Lithuanian 1% Slovak 1% Italian 1%
- Foreign-born
- 3% · Canada, China
- Languages at home
- 92% English-only · Spanish 7%
Political lean MEDSL · Lamar
- 2024 margin
- Solid R (+61.0) · D 19.2% · R 80.3%
- 2008→2024 swing
- -19.1pp toward R · 2008: -42.0pp · 2024: -61.0pp
- All cycles
- 2024: R+61.0 2020: R+57.4 2016: R+59.2 2012: R+50.3 2008: R+42.0
Not yet ingested
- Civics
- —
Market trends
- HPI YoY
- ▼ -201.50%
- Current HPI
- 145.3511
- Rent YoY
- —
- Metro
- Paris, TX
- State GDP YoY
- ▲ 3.95%
- F500 in state
- 110
Industry mix (Fortune 500 HQ in TX)
| Industry | F500 HQs | Revenue |
|---|---|---|
| Energy | 16 | $1,198B |
|
||
| Technology | 5 | $198B |
|
||
| Engineering / Construction | 4 | $72B |
|
||
| Energy Services | 3 | $60B |
|
||
| Utilities | 3 | $41B |
|
||
| Healthcare | 2 | $330B |
|
||
Price history
2 events — show timeline
- 2026-05-15 Relisted — NTREIS
- 2026-05-11 Listed $109,000 NTREIS
Property tax history
+13.3%/yrLatest (2025): $1,590 · +9.6% YoY. Source: county tax records.
Cash-flow waterfall
monthlySold comps — $/sqft
last 12 mo · ≤1 miLoading sold comps…