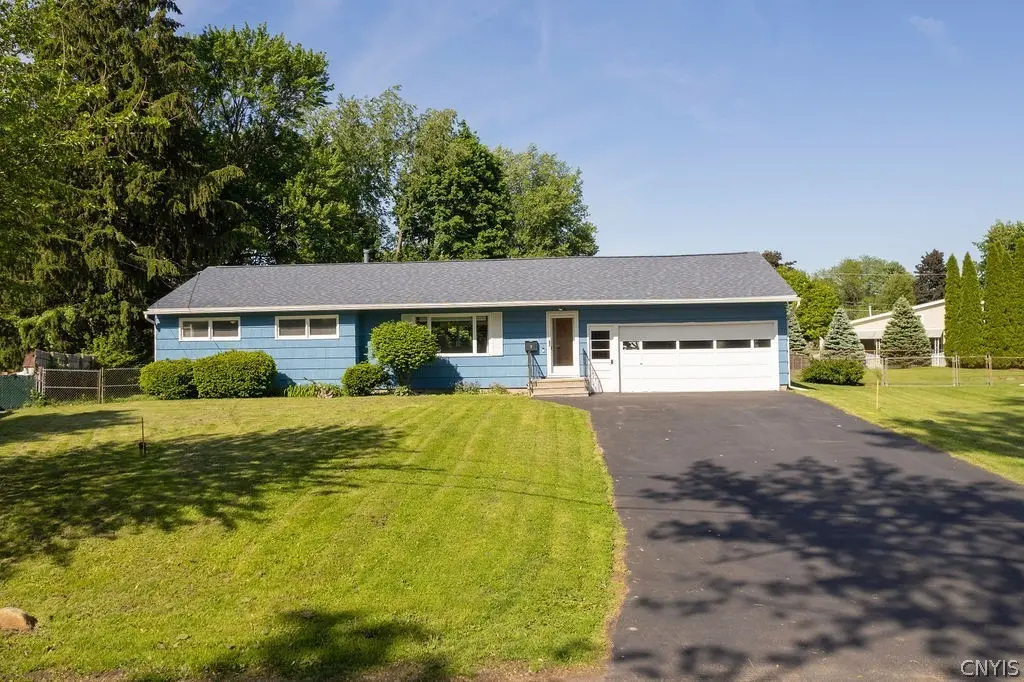
3 Trelign Dr · North Syracuse, NY
Flood risk 1/10 · Minimal
- FEMA flood zone
- X (unshaded)
- Chance of flooding over 30 yrs
- 0.0%
- Est. flood insurance / yr
- $473 – $860
Fire risk 1/10 · Minimal
- Est. fire insurance / yr
- $691 – $1,283
Heat risk 3/10 · Minor
- Hot days now (above 95°F)
- 7 days/yr
- Hot days in 30 yrs
- 16 days/yr
Wind risk 1/10 · Minimal
- Chance of severe wind over 30 yrs
- 0.0%
Air-quality risk 2/10 · Minimal
- Unhealthy air days now
- 0 days/yr
- Unhealthy air days in 30 yrs
- 1 days/yr
Risk factors via First Street. Map © Google.
Why this score? — see what drove the D grade
The composite is a weighted blend of 9 inputs, each scored 0–100. Each bar is that input's sub-score; the figure is the points it added to the 100-point composite (weight × sub-score).
- Cash flow +13.2/30.0
- ARV discount +5.9/15.0
- 1% rule +4.4/10.0
- Schools +4.2/10.0
- DSCR +4.0/10.0
- Livability +3.6/5.0
- Rent growth +2.5/5.0
- Condition / age +2.5/5.0
- Appreciation +0.0/10.0
$239,900
🖨 Deal sheet (PDF) 📄 Offer letter ✓ Due diligence
Listing remarks
This lovely ranch is just waiting for you! Everything you are looking for. .. 3 bedrooms, 1 1/2 baths, large living room with picture window for loads of natural light. Three good size bedrooms with nice closet space. Updated kitchen with cheery window over the sink looking out over your pretty backyard. Looking out your window at your picturesque yard while doing dishes even makes dishes enjoyable! 1/2 bath off of kitchen makes for a great location when outside doing yardwork or enjoying the outdoors. No tracking in grass or dirt. Home boasts hardwoods, as well as some laminate flooring. Separate dining room with sliding glass doors overlooking your beautiful fenced in backyard, large comp
Key facts
- Fenced in backyard
- Inground pool
- Updated kitchen
Tags
Property features AI
Exterior
- Parking: Attached garage with 2 spaces; Driveway; Garage with electricity
- Utilities: Public water (connected); Sewer connected; Circuit breaker electric; Cable available; High-speed internet available
- Home design: Single-story home; Entry level: main level; Existing construction; Faces city street
- Construction: Asphalt roof; Copper plumbing; Poured foundation; Resale property
- Exterior features: Blacktop driveway; Deck; Fully fenced yard; Above-ground pool
Interior
- Kitchen: Built-in range; Built-in oven; Electric cooktop; Dishwasher; Refrigerator; Eat-in kitchen
- Bedrooms: 3 main-level bedrooms
- Flooring: Hardwood; Laminate; Tile; Varies
- Bathrooms: 1 full bathroom; 1 half bathroom; 2 bathrooms on the main level
- Heating & cooling: Gas forced-air heating; Window air conditioning units
- Interior features: Ceiling fans; Eat-in kitchen; Separate/formal living room; Sliding glass doors; Natural woodwork; Main-level primary bedroom; Thermal windows; Sliding doors
- Laundry & utility: Washer; Dryer; Electric water heater
Neighborhood map
What this means for you Summary
Snapshot
- This is a 3-bed/1.5-bath single-family listed at $240k.
Deal economics
- At list price, monthly cash flow is $-6 ($-68/yr) — negative.
- To cash-flow at today's rent, offer at most $239k (0.4% below list).
- To meet the 1% rule (rent ≥ 1% of price), the offer needs to be $225k (6.2% below list).
- Recommended offer: $225k (6.2% below list) — sets the bar for 1% rule.
- Cap rate 6.3% vs local median 5.1% in North Syracuse — meaningfully above typical; check what's discounted (condition, days-on-market, listing class) to confirm the premium yield is real.
Location & tenants
- Location reads 72/100 on livability (#379 in NY) — a middle-class / working-renter tenant base. Strengths: housing A+, health & safety A+, cost of living A; Watch: schools C-, crime D, amenities F.
- North Syracuse Central School District (suburban): math 45% / reading 50% proficiency, ranked #402 of 590 in NY (top 68%) — families likely to look elsewhere, expect single-tenant / working-renter base with shorter leases.
- Market conditions: 65 active listings in the ZIP; 1 comparable units currently listed for rent nearby; 616 units permitted in Onondaga County in 2024 (256 in 5+ unit buildings).
Forward outlook
- Local home prices are declining (-3.0%/yr); year-one equity from $2k of loan paydown is wiped out by about $7k of value loss. Plan a longer hold.
- Onondaga County population projected to shrink 9% by 2050 — rents likely to lag national; underwrite the cash flow, not the appreciation.
Negotiation context
- Only 4 days on market — expect competitive offers; lowballing is unlikely to land.
Risks & watch-outs
- Watch-outs: built in 1953 — expect roof / HVAC / electrical / plumbing capex.
Questions for the listing agent
- What do current leases actually rent for vs. the listed asking? Can we see a recent rent roll and the last 12 months of T-12 income?
- Built in 1953 — when were the roof, HVAC, electrical panel, plumbing, and water heater last replaced?
- Is there a deadline driving the sale (1031 exchange, divorce, estate, relocation)? That informs how much negotiation room exists.
- Crime grade is D in this area — have there been break-ins, vandalism, or insurance claims at this property in the last 3 years? What carrier currently insures it and at what premium?
- The area grade is low — what's the realistic commute time and amenity access for the typical tenant pool here? Any planned neighborhood developments (good or bad) we should know about?
- What's the average days-on-market for RENTAL listings here right now (not sales)? A rising rental-DOM trend means longer vacancies and softer asking-rent achievability than the comps imply.
- What's the recent tenant-quality profile in this submarket — average credit score on applications, eviction rate, late-payment / NSF rate, and stable-employment percentage? A property-management company in the area should have these aggregated.
- How much new for-sale + rental construction is in the pipeline within 1–3 miles? Heavy new supply typically softens prices + rents 12–24 months out; constrained supply supports both.
Investment metrics
- 1% rule
- 0.94% ✗
- Cap rate
- 6.26%
- Cash-on-cash
- -0.10%
- DSCR
- 1.00
- GRM
- 8.9
CMA / ARV
- ARV (on-the-fly)
- $231,896
- Comps found
- 12
Show comp detail 12 sales within ~0.75 mi
| Address | Dist | Beds/Ba | Sqft | Sold | Price | $/sf | Match |
|---|---|---|---|---|---|---|---|
| 7 Trelign Dr | 0.03mi | 4/2.5 (+1) | 1,134 (-1%) | 1mo | $272,000 | $240 | 86 |
| 114 Bel Air Dr Dr | 0.17mi | 3/1.5 | 1,130 (-2%) | 4mo | $240,000 | $212 | 86 |
| 16 Bellewood Cir | 0.13mi | 4/1.0 (+1) | 1,200 (+4%) | 5mo | $230,000 | $192 | 75 |
| 7388 Palmcrest Rd | 0.31mi | 3/2.0 | 1,092 (-5%) | 1mo | $305,000 | $279 | 75 |
| 109 Leroy Rd | 0.39mi | 3/1.0 | 1,152 (+0%) | 6mo | $180,000 | $156 | 74 |
| 206 Church Pkwy | 0.34mi | 3/1.0 | 1,188 (+4%) | 3mo | $240,000 | $202 | 74 |
| 5955 Smith Rd | 0.46mi | 3/2.0 | 1,137 (-1%) | 6mo | $251,000 | $221 | 70 |
| 100 Marywood Dr | 0.12mi | 3/1.5 | 1,302 (+13%) | 6mo | $272,500 | $209 | 66 |
| 111 Randall Ter | 0.57mi | 3/1.5 | 1,199 (+4%) | 2mo | $185,000 | $154 | 65 |
| 107 Colonial Dr | 0.32mi | 3/1.0 | 1,307 (+14%) | 4mo | $260,000 | $199 | 57 |
| 5943 Smith Rd | 0.46mi | 3/1.5 | 1,288 (+12%) | 6mo | $198,000 | $154 | 53 |
| 5911 Smith Rd | 0.50mi | 3/2.0 | 1,288 (+12%) | 8mo | $228,642 | $178 | 48 |
Match score weights: distance 35% · size 25% · config 20% · recency 20%. Top-matched comps best support the ARV.
Projected returns pro-forma
-3.0% appreciation · 3.0% rent growth · sell at horizon
- IRR
- -16.4%
- Equity multiple
- 0.42×
- Total profit
- $-39,122
- Equity at exit
- $35,770
- IRR
- -8.1%
- Equity multiple
- 0.49×
- Total profit
- $-34,077
- Equity at exit
- $20,742
Cash invested: $67,172 (down + closing). Projections, not guarantees.
Landlord ↔ Tenant lean methodology
- Overall (STATE)
- 15 Strongly Tenant-Friendly
- State New York
- 15 Strongly Tenant-Friendly · D+10
- County
- — inherits STATE
- City
- — inherits STATE
ZIP-level market 13212
- Active inventory
- 65
- Price-to-rent
- 8.9×
Monthly cashflow live
- Estimated rent
- $2,250 medium interval (Pro) →
- Mortgage (P&I)
- −$1,258
- Tax from tax record
- −$425 /mo · $5,101/yr
- Insurance
- −$100
- HOA
- −$0
- Vacancy / Maint / Mgmt
- −$472
- Net cashflow
- $-6
Break-even live
Sensitivity live
| Price | -10% $130 | -5% $62 | +0% $-6 | +5% $-74 | +10% $-141 |
|---|---|---|---|---|---|
| Rent | -10% $-183 | -5% $-95 | +0% $-6 | +5% $83 | +10% $172 |
| Rate | -1.0pp $115 | -0.5pp $55 | base $-6 | +0.5pp $-68 | +1.0pp $-131 |
UW: 25.0% down · 7.5% · 30yr · 1.5% tax · 5.0% vac · 8.0% maint · 8.0% mgmt
Financing live
Cash to close
- Down payment
- $59,975
- Closing costs
- $7,197
- Reserves months
- —
- Total cash needed
- —
Loan-product check · same deal, 3 products live
Conventional
25% down · 7.5% · 30yr
- Down + closing
- —
- Monthly P&I
- —
- Monthly cashflow
- —
- DSCR
- —
- Eligible?
- —
Personal DTI + credit; lowest rate.
DSCR
20% down · 8.5% · 30yr
- Down + closing
- —
- Monthly P&I
- —
- Monthly cashflow
- —
- DSCR
- —
- Eligible?
- —
No personal income docs; deal must DSCR.
Hard money
10% down · 12.0% · 12mo
- Down + closing
- —
- Monthly P&I
- —
- Monthly cashflow
- —
- DSCR
- —
- Eligible?
- —
Short-term bridge; refi at stabilization.
Rent comps 1 comps
| Address | Beds | Baths | Sqft | Rent | $/sqft | DOM | Units | Dist |
|---|---|---|---|---|---|---|---|---|
| 107 Stephen Pl Syracuse, NY | 2.0 | 1.0 | 1199 | $2,250 | $1.88 | 44d | 1 | 0.40mi |
Listing history 6 events
-
2026-06-03status $239,900 Pending 4 DOM
-
2026-06-02days on market $239,900 Active 4 DOM
-
2026-06-01days on market $239,900 Active 3 DOM
-
2026-05-31days on market $239,900 Active 2 DOM
-
2026-05-30remarks 699-char remark
-
2026-05-30$239,900 Active 1 DOM
ⓘ Source: listings_history table (triggers on properties + properties_extension) + one-shot
backfill from property_details.listing_events for pre-trigger history.
Tax reassessment forecast NY · Partial reset (capped growth)
- Current annual tax
- $5,101 · $425/mo
- Projected year-2 tax
- $5,101 · $425/mo
- Expected delta
- $0/yr ($0/mo · 0.0%)
ⓘ Screening estimate from a state-policy table — verify with the county assessor before closing.
Climate risk First Street
- Flood 1/10 Low FEMA zone X (unshaded) · 0% chance over 30 yrs
- Wildfire 1/10 Low
- Heat 3/10 Moderate 7 d/yr ≥95°F today · 16 d/yr by 30 yrs out
- Wind 1/10 Low 0% chance of damaging wind over 30 yrs
- Air quality 2/10 Low 0 unhealthy d/yr today · 1 by 30 yrs out
Nearby sold comps map
Loading sold comps map…
Walkable amenities ~0.75 mi
Loading nearby amenities…
Taxation est. · year 1
- Rental income
- $27,000
- − Mortgage interest
- −$13,438
- − Property taxes
- −$5,101
- − Insurance
- −$1,200
- − Repairs & maintenance
- −$2,160
- − Management
- −$2,160
- − Depreciation
- −$6,979
- Taxable loss
- −$4,038
- Est. tax savings @ 24.0%
- +$969
- After-tax cash flow
- $902/yr
For passive investors: Depreciation is non-cash, so a rental often shows a tax loss while cash-flowing — sheltering income. Rental losses are passive: they offset passive income freely, and up to $25,000/yr can offset ordinary (W-2) income if you actively participate and your MAGI is under $100k (phasing out to $0 by $150k); unused losses carry forward. On sale, claimed depreciation is recaptured at up to 25%, and gains may owe capital-gains tax (a 1031 exchange can defer both). Figures are a year-1 estimate at your 24.0% rate — not tax advice; consult a CPA.
Schools (NCES district)
- District
- North Syracuse Central School District
- NCES district ID
- 3621210
- Math proficiency
- 45% ▼ -9.00%
- Reading proficiency
- 50% ▲ 1.00%
- Median HH income
- $62,904
- Composite
- 41.93/100
- National rank
- #3356
- State rank
- #402 of 590 in NY
Livability — North Syracuse
- Score
- 72/100
- State rank
- #379
- US rank
- #6513
Category grades
Schools grade is shown separately in the Schools card above.
Census & demographics
- City population
- 20,185
- Population (ZIP)
- 20,185
Population outlook (Onondaga County) Hauer SSP2
- Today (2025)
- 467,894 people
- By 2030
- 463,381 · -1.0%
- By 2040
- 447,697 · -4.3%
- By 2050
- 426,399 · -8.9%
- By 2075
- 373,661 · -20.1%
- By 2100
- 307,967 · -34.2%
Race, ethnicity, and origin ACS 2023
- Neighborhood character
- Predominantly White (90%)
- Race & ethnicity
- White 90% Two or more races 5% Hispanic / Latino 4% Black 1%
- Common ancestry
- Romanian 10% Lithuanian 5% Slovak 2%
- Foreign-born
- 4% · Canada
- Languages at home
- 93% English-only · Spanish 3% Other Indo-European 2% German/W. Germanic 1%
Political lean MEDSL · Onondaga
- 2024 margin
- D (+17.3) · D 58.6% · R 41.4%
- 2008→2024 swing
- -3.0pp toward R · 2008: 20.3pp · 2024: 17.3pp
- All cycles
- 2024: D+17.3 2020: D+20.6 2016: D+12.8 2012: D+21.1 2008: D+20.3
Not yet ingested
- Civics
- —
Market trends
- HPI YoY
- ▼ -210.93%
- Current HPI
- 317.7322
- Rent YoY
- —
- Metro
- —
- State GDP YoY
- ▲ 2.60%
- F500 in state
- 92
Industry mix (Fortune 500 HQ in NY)
| Industry | F500 HQs | Revenue |
|---|---|---|
| Financial Services | 10 | $950B |
|
||
| Consumer Goods | 9 | $162B |
|
||
| Insurance | 4 | $225B |
|
||
| Telecommunications | 2 | $144B |
|
||
| Pharmaceuticals | 2 | $112B |
|
||
| Media / Entertainment | 2 | $69B |
|
||
Price history
1 event — show timeline
- 2026-05-28 Listed $239,900 CNYIS
Property tax history
+1.6%/yrLatest (2025): $5,101 · +3.3% YoY. Source: county tax records.
Cash-flow waterfall
monthlySold comps — $/sqft
last 12 mo · ≤1 miLoading sold comps…