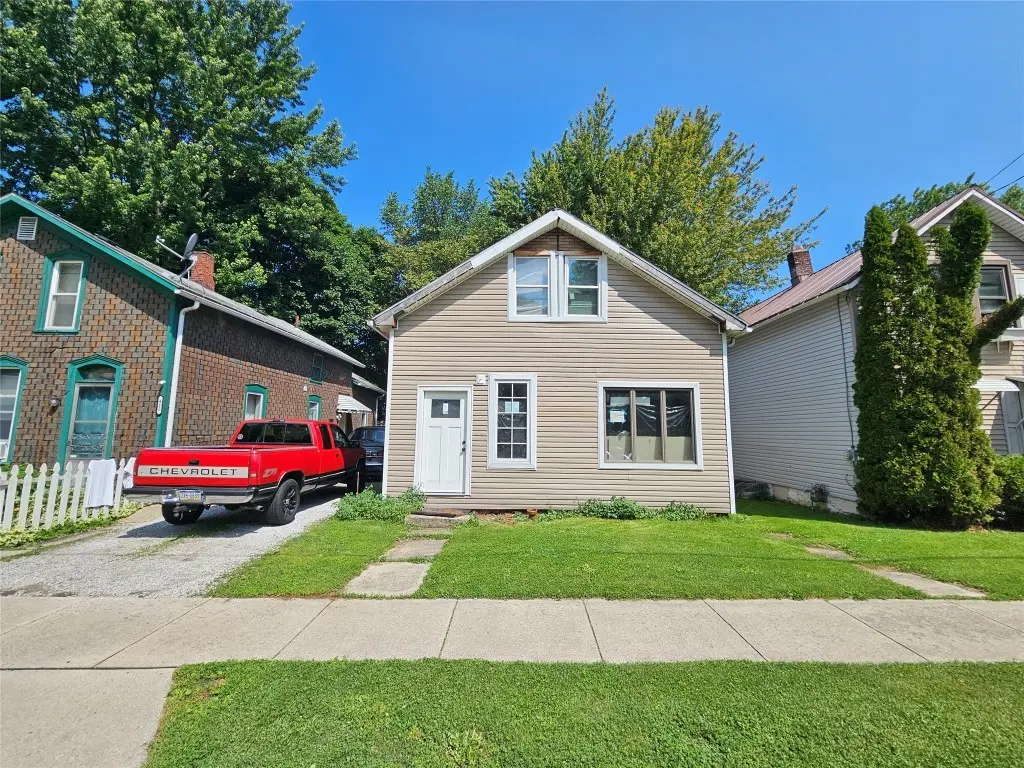
448 W 19th St · Erie, PA
Flood risk 1/10 · Minimal
- FEMA flood zone
- X (unshaded)
- Chance of flooding over 30 yrs
- 0.0%
- Est. flood insurance / yr
- $473 – $860
Fire risk 1/10 · Minimal
- Est. fire insurance / yr
- $511 – $949
Heat risk 2/10 · Minimal
- Hot days now (above 90°F)
- 7 days/yr
- Hot days in 30 yrs
- 15 days/yr
Wind risk 1/10 · Minimal
- Chance of severe wind over 30 yrs
- —
Air-quality risk 2/10 · Minimal
- Unhealthy air days now
- 1 days/yr
- Unhealthy air days in 30 yrs
- 3 days/yr
Risk factors via First Street. Map © Google.
Why this score? — see what drove the B+ grade
The composite is a weighted blend of 9 inputs, each scored 0–100. Each bar is that input's sub-score; the figure is the points it added to the 100-point composite (weight × sub-score).
- Cash flow +30.0/30.0
- ARV discount +15.0/15.0
- 1% rule +10.0/10.0
- DSCR +10.0/10.0
- Livability +4.2/5.0
- Rent growth +3.2/5.0
- Condition / age +2.5/5.0
- Schools +1.3/10.0
- Appreciation +0.0/10.0
$70,000
🖨 Deal sheet (PDF) 📄 Offer letter ✓ Due diligence
Listing remarks MLS
Three bedroom, one bathroom blank canvas. Electric already ran, studs already in place. No gas hooked up, water needs connected from the street
Key facts
- 3,899 sq ft lot
- Built 1882
- Listed 375 days
Neighborhood map
What this means for you Summary
Snapshot
- This is a 3-bed/1.0-bath single-family listed at $70k.
Deal economics
- At list price, monthly cash flow is $349 ($4k/yr) — positive.
- The deal already cash-flows at list — no discount required.
- Meets the 1% rule at list price ($1k rent vs $70k).
- Recommended offer: $62k (12.0% below list) — sets the bar for market timing.
- Cap rate 12.3% vs local median 5.1% in Erie — top-decile yield for the area; either an underpriced asset or a hidden risk that comps aren't pricing in. Stress-test before assuming the spread holds.
Location & tenants
- Location reads 83/100 on livability (#109 in PA, #840 nationally) — a professional / high-income tenant draw. Strengths: amenities A+, commute A+, cost of living A+; Watch: crime D+, employment F.
- Erie City SD (urban): math 12% / reading 19% proficiency, ranked #510 of 539 in PA (top 95%) — low school quality limits family demand, transient renter base, plan for 1-2y turnover; 81% free/reduced lunch — lower-income household profile, screen leases tightly.
- Zoned schools: Pfeiffer-Burleigh Sch (math 7% / reading 14%, grade F, #1,396 of 1,518 statewide, top 92%, 565 students, 100% FRL); Northwest Pa Collegiate Academy (math 82%, 753 students, 100% FRL) — zoned schools average 100% FRL vs 81% district-wide (19 pts higher); higher-poverty schools than district average — tighter screening recommended.
- Market conditions: Rents rising (+3.0%/yr); 57 active listings in the ZIP; 17 comparable units currently listed for rent nearby; rentals lingering (median 46d on market — plan ~5-8 weeks vacancy on turnover, expect pricing pressure); 100% of comp listings sitting > 30 days — soft ceiling on asking rent; lower-income renter base — watch delinquency; 364 units permitted in Erie County in 2024 (188 in 5+ unit buildings).
- This rent runs 33% of the median local income ($39k/yr) — at the standard rent-burdened threshold; future hikes will face affordability resistance.
Forward outlook
- Local home prices are declining (-3.0%/yr); year-one equity from $484 of loan paydown is wiped out by about $2k of value loss. Plan a longer hold.
- Erie County population projected at -14% by 2050 — secular population decline; favor cash flow + early exit over multi-decade hold.
- At projected returns (-3.0% appreciation + 3.0% rent growth), your $20k cash investment doubles in ~6 years — after that, you're playing with house money.
Negotiation context
- It's been on market 376 days — a 12% lower offer ($62k) is reasonable based on typical stale-listing flexibility.
Risks & watch-outs
- Watch-outs: built in 1882 — expect roof / HVAC / electrical / plumbing capex.
Questions for the listing agent
- It's been on market 376 days. Have you received any prior offers? Is the seller open to a 12% concession, seller financing, or rate buy-down credit?
- Built in 1882 — when were the roof, HVAC, electrical panel, plumbing, and water heater last replaced?
- Why hasn't it sold? Are there any deal-killer items the seller is aware of (foundation, flood, title, zoning, code violations)?
- Is there a deadline driving the sale (1031 exchange, divorce, estate, relocation)? That informs how much negotiation room exists.
- Crime grade is D in this area — have there been break-ins, vandalism, or insurance claims at this property in the last 3 years? What carrier currently insures it and at what premium?
- What's the average days-on-market for RENTAL listings here right now (not sales)? A rising rental-DOM trend means longer vacancies and softer asking-rent achievability than the comps imply.
- What's the recent tenant-quality profile in this submarket — average credit score on applications, eviction rate, late-payment / NSF rate, and stable-employment percentage? A property-management company in the area should have these aggregated.
- How much new for-sale + rental construction is in the pipeline within 1–3 miles? Heavy new supply typically softens prices + rents 12–24 months out; constrained supply supports both.
Investment metrics
- 1% rule
- 1.54% ✓
- Cap rate
- 12.28%
- Cash-on-cash
- 21.38%
- DSCR
- 1.95
- GRM
- 5.4
CMA / ARV
- ARV (median comp)
- $93,810
- List price
- $70,000
- Delta
- -25.38%
- Verdict
- UNDERPRICED
- Comps
- 20 within 1.0 mi
Show comp detail 8 sales within ~0.75 mi
| Address | Dist | Beds/Ba | Sqft | Sold | Price | $/sf | Match |
|---|---|---|---|---|---|---|---|
| 545 W 16th St | 0.21mi | 4/1.0 (+1) | 1,128 (+11%) | 8mo | $91,000 | $81 | 60 |
| 2421 Plum St | 0.58mi | 3/1.5 | 1,104 (+9%) | 0mo | $159,900 | $145 | 56 |
| 906 W 18th St | 0.48mi | 3/1.5 | 1,104 (+9%) | 7mo | $68,177 | $62 | 55 |
| 2677 Cherry St | 0.64mi | 3/1.0 | 960 (-5%) | 9mo | $75,000 | $78 | 54 |
| 904 W 26th St | 0.65mi | 4/1.0 (+1) | 1,040 (+3%) | 8mo | $60,300 | $58 | 54 |
| 2673 Poplar St | 0.68mi | 3/1.0 | 1,034 (+2%) | 20mo | $127,000 | $123 | 48 |
| 556 W 29 St | 0.65mi | 3/1.0 | 1,144 (+13%) | 3mo | $152,000 | $133 | 46 |
| 2413 Plum St | 0.58mi | 3/1.0 | 1,144 (+13%) | 20mo | $135,000 | $118 | 35 |
Match score weights: distance 35% · size 25% · config 20% · recency 20%. Top-matched comps best support the ARV.
Projected returns pro-forma
-3.0% appreciation · 2.97% rent growth · sell at horizon
- IRR
- 13.9%
- Equity multiple
- 1.56×
- Total profit
- $10,896
- Equity at exit
- $10,437
- IRR
- 22.7%
- Equity multiple
- 2.94×
- Total profit
- $38,106
- Equity at exit
- $6,052
Cash invested: $19,600 (down + closing). Projections, not guarantees.
Landlord ↔ Tenant lean methodology
- Overall (STATE)
- 62 Landlord-Friendly
- State Pennsylvania
- 62 Landlord-Friendly · EVEN
- County
- — inherits STATE
- City
- — inherits STATE
ZIP-level market 16502
- Home prices YoY
- -30.5%
- Rents YoY
- 3.0%
- Active inventory
- 57
- Price-to-rent
- 5.4×
Monthly cashflow live
- Estimated rent
- $1,075 high interval (Pro) →
- Mortgage (P&I)
- −$367
- Tax from tax record
- −$104 /mo · $1,244/yr
- Insurance
- −$29
- HOA
- −$0
- Lot rent
- −$0
- Vacancy / Maint / Mgmt
- −$226
- Net cashflow
- $349
Break-even live
Sensitivity live
| Price | -10% $389 | -5% $369 | +0% $349 | +5% $329 | +10% $310 |
|---|---|---|---|---|---|
| Rent | -10% $264 | -5% $307 | +0% $349 | +5% $392 | +10% $434 |
| Rate | -1.0pp $385 | -0.5pp $367 | base $349 | +0.5pp $331 | +1.0pp $313 |
UW: 25.0% down · 7.5% · 30yr · 1.5% tax · 5.0% vac · 8.0% maint · 8.0% mgmt
Financing live
Cash to close
- Down payment
- $17,500
- Closing costs
- $2,100
- Reserves months
- —
- Total cash needed
- —
Loan-product check · same deal, 3 products live
Conventional
25% down · 7.5% · 30yr
- Down + closing
- —
- Monthly P&I
- —
- Monthly cashflow
- —
- DSCR
- —
- Eligible?
- —
Personal DTI + credit; lowest rate.
DSCR
20% down · 8.5% · 30yr
- Down + closing
- —
- Monthly P&I
- —
- Monthly cashflow
- —
- DSCR
- —
- Eligible?
- —
No personal income docs; deal must DSCR.
Hard money
10% down · 12.0% · 12mo
- Down + closing
- —
- Monthly P&I
- —
- Monthly cashflow
- —
- DSCR
- —
- Eligible?
- —
Short-term bridge; refi at stabilization.
Rent comps 17 comps
| Address | Beds | Baths | Sqft | Rent | $/sqft | DOM | Units | Dist |
|---|---|---|---|---|---|---|---|---|
| 1610 Poplar St Unit Downstairs Erie, PA | 3.0 | 1.0 | 1200 | $875 | $0.73 | 46d | 1 | 0.34mi |
| 2619 Liberty St Apt 2 Erie, PA | 2.0 | 1.0 | 800 | $800 | $1.00 | 47d | 1 | 0.62mi |
| 504 W 29th St Unit 2 Erie, PA | 3.0 | 1.0 | 1200 | $1,500 | $1.25 | 46d | 1 | 0.63mi |
| 923 Chestnut St Unit 2 Erie, PA | 4.0 | 2.0 | 1100 | $1,150 | $1.05 | 46d | 1 | 0.63mi |
| 440 W 9th St Erie, PA | 2.0 | 1.0 | 800 | $775 | $0.97 | 46d | 1 | 0.69mi |
| 811 W 30th St Unit 1 Erie, PA | 2.0 | 1.0 | 900 | $1,175 | $1.31 | 46d | 1 | 0.83mi |
| 1022 W 30th St Unit 2 Erie, PA | 2.0 | 1.0 | 1000 | $850 | $0.85 | 46d | 1 | 0.94mi |
| 3603 Maple St Erie, PA | 2.0 | 1.0 | 1200 | $1,000 | $0.83 | 46d | 1 | 1.12mi |
| 16 W 5th St Apt 504 Erie, PA | 2.0 | 1.5 | 1072 | $2,499 | $2.33 | 46d | 1 | 1.14mi |
| 100 Erie Insurance Pl Erie, PA | 3.0 | 1.0 | 1120 | $1,425 | $1.27 | 46d | 1 | 1.17mi |
| 407 E 13th St Unit 2 Erie, PA | 2.0 | 1.0 | 750 | $850 | $1.13 | 46d | 1 | 1.18mi |
| 1164 W 7th St Erie, PA | 3.0 | 1.0 | 1248 | $1,600 | $1.28 | 46d | 1 | 1.19mi |
| 305 Cascade St Unit 305 Erie, PA | 2.0 | 1.0 | 1000 | $900 | $0.90 | 46d | 1 | 1.25mi |
| 1257 W 6th St Erie, PA | 2.0 | 1.0 | 1100 | $1,350 | $1.23 | 46d | 1 | 1.32mi |
| 614 E 22nd St Unit 1 Erie, PA | 3.0 | 1.0 | 1300 | $1,000 | $0.77 | 46d | 1 | 1.40mi |
| 612 E 14th St #1 Erie, PA | 3.0 | 1.0 | 775 | $850 | $1.10 | 46d | 1 | 1.42mi |
| 626 E 23rd St Unit 2 Erie, PA | 3.0 | 1.0 | 850 | $800 | $0.94 | 46d | 1 | 1.43mi |
Listing history 20 events
-
2026-06-23days on market $70,000 Active 376 DOM
-
2026-06-21days on market $70,000 Active 375 DOM
-
2026-06-19days on market $70,000 Active 373 DOM
-
2026-06-18days on market $70,000 Active 372 DOM
-
2026-06-17days on market $70,000 Active 371 DOM
-
2026-06-16days on market $70,000 Active 370 DOM
-
2026-06-15days on market $70,000 Active 369 DOM
-
2026-06-14days on market $70,000 Active 367 DOM
-
2026-06-13days on market $70,000 Active 366 DOM
-
2026-06-10days on market $70,000 Active 364 DOM
-
2026-06-09days on market $70,000 Active 363 DOM
-
2026-06-08days on market $70,000 Active 362 DOM
-
2026-06-07days on market $70,000 Active 361 DOM
-
2026-06-05days on market $70,000 Active 358 DOM
-
2026-06-03days on market $70,000 Active 357 DOM
-
2026-06-02days on market $70,000 Active 356 DOM
-
2026-06-01days on market $70,000 Active 355 DOM
-
2026-05-31days on market $70,000 Active 354 DOM
-
2026-05-30days on market $70,000 Active 353 DOM
-
2025-06-12$70,000 Active 143-char remark
Show marketing remark (143 chars)
Three bedroom, one bathroom blank canvas. Electric already ran, studs already in place. No gas hooked up, water needs connected from the street
ⓘ Source: listings_history table (triggers on properties + properties_extension) + one-shot
backfill from property_details.listing_events for pre-trigger history.
Tax reassessment forecast PA · Partial reset (capped growth)
- Current annual tax
- $1,244 · $104/mo
- Projected year-2 tax
- $1,244 · $104/mo
- Expected delta
- $0/yr ($0/mo · 0.0%)
ⓘ Screening estimate from a state-policy table — verify with the county assessor before closing.
Climate risk First Street
- Flood 1/10 Low FEMA zone X (unshaded) · 0% chance over 30 yrs
- Wildfire 1/10 Low
- Heat 2/10 Low 7 d/yr ≥90°F today · 15 d/yr by 30 yrs out
- Wind 1/10 Low
- Air quality 2/10 Low 1 unhealthy d/yr today · 3 by 30 yrs out
Nearby sold comps map
Loading sold comps map…
Walkable amenities ~0.75 mi
Loading nearby amenities…
Taxation est. · year 1
- Rental income
- $12,899
- − Mortgage interest
- −$3,921
- − Property taxes
- −$1,244
- − Insurance
- −$350
- − Repairs & maintenance
- −$1,032
- − Management
- −$1,032
- − Depreciation
- −$2,036
- Taxable income
- $3,284
- Est. tax owed @ 24.0%
- −$788
- After-tax cash flow
- $3,403/yr
For passive investors: Depreciation is non-cash, so a rental often shows a tax loss while cash-flowing — sheltering income. Rental losses are passive: they offset passive income freely, and up to $25,000/yr can offset ordinary (W-2) income if you actively participate and your MAGI is under $100k (phasing out to $0 by $150k); unused losses carry forward. On sale, claimed depreciation is recaptured at up to 25%, and gains may owe capital-gains tax (a 1031 exchange can defer both). Figures are a year-1 estimate at your 24.0% rate — not tax advice; consult a CPA.
Schools (NCES district)
- District
- Erie City SD
- NCES district ID
- 4209300
- Math proficiency
- 12% ▼ -11.00%
- Reading proficiency
- 19% ▼ -16.00%
- Median HH income
- $33,625
- Composite
- 12.59/100
- National rank
- #9617
- State rank
- #510 of 539 in PA
Livability — Erie
- Score
- 83/100
- State rank
- #109
- US rank
- #840
Category grades
Schools grade is shown separately in the Schools card above.
Census & demographics
- Census place
- Erie, PA
- County
- Erie County · 92,215 people
- City population
- 92,215
- Metro
- Erie, PA
- Population (ZIP)
- 15,995
- Household income
- $38,566
- Rent vs Own
- Severe rent burden
- 1044.0
Population outlook (Erie County) Hauer SSP2
- Today (2025)
- 272,159 people
- By 2030
- 266,299 · -2.2%
- By 2040
- 250,987 · -7.8%
- By 2050
- 234,925 · -13.7%
- By 2075
- 199,164 · -26.8%
- By 2100
- 162,985 · -40.1%
Race, ethnicity, and origin ACS 2023
- Neighborhood character
- Predominantly White (66%)
- Race & ethnicity
- White 66% Two or more races 16% Hispanic / Latino 13% Black 11% Asian 2%
- Hispanic origin (detail)
- Mexican 5% Puerto Rican 5%
- Common ancestry
- Romanian 7% Serbian 2% Italian 1%
- Foreign-born
- 5% · Canada
- Languages at home
- 89% English-only · Spanish 8% Other Indo-European 1% Russian/Polish/Slavic 1%
Political lean MEDSL · Erie
- 2024 margin
- Toss-up / Even · D 49.0% · R 50.0%
- 2008→2024 swing
- -20.9pp toward R · 2008: 19.9pp · 2024: -1.0pp
- All cycles
- 2024: R+1.0 2020: D+1.0 2016: R+2.0 2012: D+16.9 2008: D+19.9
Not yet ingested
- Civics
- —
Market trends
- HPI YoY
- ▼ -92.73%
- Current HPI
- 211.4408
- Rent YoY
- ▲ 2.97%
- Metro
- Erie, PA
- State GDP YoY
- ▲ 1.68%
- F500 in state
- 34
Industry mix (Fortune 500 HQ in PA)
| Industry | F500 HQs | Revenue |
|---|---|---|
| Healthcare | 2 | $309B |
|
||
| Insurance | 2 | $27B |
|
||
| Telecommunications / Media | 1 | $124B |
|
||
| Industrial Distribution | 1 | $22B |
|
||
| Financial Services | 1 | $20B |
|
||
| Chemicals / Materials | 1 | $18B |
|
||
Price history
1 event — show timeline
- 2025-06-12 Listed $70,000 GEBOR
Property tax history
+1.9%/yrLatest (2026): $1,244 · +3.4% YoY. Source: county tax records.
Cash-flow waterfall
monthlySold comps — $/sqft
last 12 mo · ≤1 miLoading sold comps…