35 Steere Rd · Harmony, RI
Flood risk 1/10 · Minimal
- FEMA flood zone
- X (unshaded)
- Chance of flooding over 30 yrs
- 0.0%
- Est. flood insurance / yr
- $507 – $1,088
Fire risk 2/10 · Minimal
- Est. fire insurance / yr
- $835 – $1,551
Heat risk 4/10 · Minor
- Hot days now (above 95°F)
- 7 days/yr
- Hot days in 30 yrs
- 15 days/yr
Wind risk 6/10 · Moderate
- Chance of severe wind over 30 yrs
- 72.0%
Air-quality risk 2/10 · Minimal
- Unhealthy air days now
- 2 days/yr
- Unhealthy air days in 30 yrs
- 2 days/yr
Risk factors via First Street. Map © Google.
Why this score? — see what drove the B grade
The composite is a weighted blend of 9 inputs, each scored 0–100. Each bar is that input's sub-score; the figure is the points it added to the 100-point composite (weight × sub-score).
- Cash flow +25.8/30.0
- Appreciation +10.0/10.0
- DSCR +8.6/10.0
- ARV discount +7.5/15.0
- 1% rule +6.5/10.0
- Schools +5.1/10.0
- Livability +3.2/5.0
- Rent growth +2.5/5.0
- Condition / age +2.5/5.0
$149,900
🖨 Deal sheet (PDF) 📄 Offer letter ✓ Due diligence
Listing remarks MLS
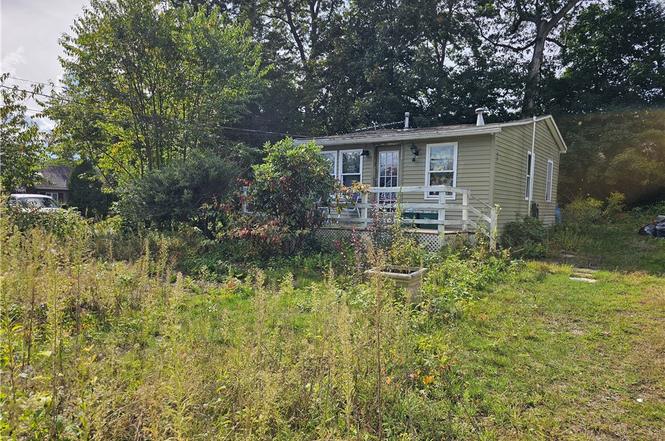
1-bedroom cottage overlooking beautiful Waterman Reservoir! This property offers a rare opportunity to own a home with water views at an affordable price. The cottage does need some work, but with a little vision and effort, it can be transformed into the perfect weekend retreat or year-round residence. Enjoy peaceful surroundings, stunning sunsets, and the chance to make this home truly your own. Don't miss out on this hidden gem with endless potential!
Key facts
- 0.25 acre lot
- 2 parking spots
- Built 1943
Neighborhood map
What this means for you Summary
Snapshot
- This is a 1-bed/1.0-bath single-family listed at $150k.
Deal economics
- At list price, monthly cash flow is $364 ($4k/yr) — positive.
- The deal already cash-flows at list — no discount required.
- Meets the 1% rule at list price ($2k rent vs $150k).
Location & tenants
- Location reads 63/100 on livability (#26 in RI) — a middle-class / working-renter tenant base. Strengths: crime A+, housing A+, employment B+; Watch: cost of living D+, schools D-, amenities F.
- Glocester (rural): math 46% / reading 66% proficiency, ranked #4 of 39 in RI (top 10%) — acceptable for families but not a draw, mixed tenant base, ~2y average lease; only 12% free/reduced lunch — higher-income household profile.
- Market conditions: 40 active listings in the ZIP; 776 units permitted in Providence County in 2024 (229 in 5+ unit buildings).
Forward outlook
- In year one you build about $16k of equity ($1k loan paydown + $15k appreciation (10.0% local appreciation)).
- Providence County population projected at +5% by 2050 — modest demand growth; plan on rents tracking national, not racing it.
- At projected returns (10.0% appreciation + 3.0% rent growth), your $42k cash investment doubles in ~2 years — after that, you're playing with house money.
- By year 3, paydown + projected appreciation supports a ~$41k cash-out refi (75% LTV) — recoverable capital for the next deal without selling this one.
Negotiation context
- Only 11 days on market — expect competitive offers; lowballing is unlikely to land.
- 2 sale attempts with the ask held roughly flat each time — persistent listings suggest the price (not the market) is what's stuck; bring a comps-based counter.
Risks & watch-outs
- Watch-outs: built in 1943 — expect roof / HVAC / electrical / plumbing capex.
- Climate carrying-cost: major wind risk, 72% chance of damaging wind over 30y — expect insurance premiums to compound above CPI over the hold.
Questions for the listing agent
- Built in 1943 — when were the roof, HVAC, electrical panel, plumbing, and water heater last replaced?
- Is there a deadline driving the sale (1031 exchange, divorce, estate, relocation)? That informs how much negotiation room exists.
- Schools are D-rated, which usually means shorter tenancies and higher turnover. Who's the typical renter profile here, and what's been the actual vacancy rate?
- What's the average days-on-market for RENTAL listings here right now (not sales)? A rising rental-DOM trend means longer vacancies and softer asking-rent achievability than the comps imply.
- What's the recent tenant-quality profile in this submarket — average credit score on applications, eviction rate, late-payment / NSF rate, and stable-employment percentage? A property-management company in the area should have these aggregated.
- How much new for-sale + rental construction is in the pipeline within 1–3 miles? Heavy new supply typically softens prices + rents 12–24 months out; constrained supply supports both.
Investment metrics
- 1% rule
- 1.15% ✓
- Cap rate
- 9.20%
- Cash-on-cash
- 10.40%
- DSCR
- 1.46
- GRM
- 7.3
CMA / ARV
- ARV (on-the-fly)
- $33,696
- Comps found
- 1
Show comp detail 1 sale within ~0.75 mi
| Address | Dist | Beds/Ba | Sqft | Sold | Price | $/sf | Match |
|---|---|---|---|---|---|---|---|
| 8 Long Meadow Dr | 0.21mi | 2/1.0 (+1) | 476 (+10%) | 23mo | $37,000 | $78 | 49 |
Match score weights: distance 35% · size 25% · config 20% · recency 20%. Top-matched comps best support the ARV.
Projected returns pro-forma
10.0% appreciation · 3.0% rent growth · sell at horizon
- IRR
- 31.9%
- Equity multiple
- 3.50×
- Total profit
- $104,801
- Equity at exit
- $135,042
- IRR
- 27.5%
- Equity multiple
- 7.92×
- Total profit
- $290,412
- Equity at exit
- $291,223
Cash invested: $41,972 (down + closing). Projections, not guarantees.
Landlord ↔ Tenant lean methodology
- Overall (STATE)
- 31 Tenant-Leaning
- State Rhode Island
- 31 Tenant-Leaning · D+8
- County
- — inherits STATE
- City
- — inherits STATE
ZIP-level market 02814
- Home prices YoY
- 3.0%
- Active inventory
- 40
- Price-to-rent
- 7.3×
Monthly cashflow live
- Estimated rent
- $1,722 medium interval (Pro) →
- Mortgage (P&I)
- −$786
- Tax from tax record
- −$148 /mo · $1,781/yr
- Insurance
- −$62
- HOA
- −$0
- Vacancy / Maint / Mgmt
- −$362
- Net cashflow
- $364
Break-even live
Sensitivity live
| Price | -10% $448 | -5% $406 | +0% $364 | +5% $321 | +10% $279 |
|---|---|---|---|---|---|
| Rent | -10% $228 | -5% $296 | +0% $364 | +5% $432 | +10% $500 |
| Rate | -1.0pp $439 | -0.5pp $402 | base $364 | +0.5pp $325 | +1.0pp $285 |
UW: 25.0% down · 7.5% · 30yr · 1.5% tax · 5.0% vac · 8.0% maint · 8.0% mgmt
Financing live
Cash to close
- Down payment
- $37,475
- Closing costs
- $4,497
- Reserves months
- —
- Total cash needed
- —
Loan-product check · same deal, 3 products live
Conventional
25% down · 7.5% · 30yr
- Down + closing
- —
- Monthly P&I
- —
- Monthly cashflow
- —
- DSCR
- —
- Eligible?
- —
Personal DTI + credit; lowest rate.
DSCR
20% down · 8.5% · 30yr
- Down + closing
- —
- Monthly P&I
- —
- Monthly cashflow
- —
- DSCR
- —
- Eligible?
- —
No personal income docs; deal must DSCR.
Hard money
10% down · 12.0% · 12mo
- Down + closing
- —
- Monthly P&I
- —
- Monthly cashflow
- —
- DSCR
- —
- Eligible?
- —
Short-term bridge; refi at stabilization.
Listing history 4 events
-
2025-10-10status Pending 458-char remark
Show marketing remark (458 chars)
1-bedroom cottage overlooking beautiful Waterman Reservoir! This property offers a rare opportunity to own a home with water views at an affordable price. The cottage does need some work, but with a little vision and effort, it can be transformed into the perfect weekend retreat or year-round residence. Enjoy peaceful surroundings, stunning sunsets, and the chance to make this home truly your own. Don't miss out on this hidden gem with endless potential!
-
2025-10-10status Pending
Show marketing remark (458 chars)
1-bedroom cottage overlooking beautiful Waterman Reservoir! This property offers a rare opportunity to own a home with water views at an affordable price. The cottage does need some work, but with a little vision and effort, it can be transformed into the perfect weekend retreat or year-round residence. Enjoy peaceful surroundings, stunning sunsets, and the chance to make this home truly your own. Don't miss out on this hidden gem with endless potential!
-
2025-09-29$149,900 Active 458-char remark
Show marketing remark (458 chars)
1-bedroom cottage overlooking beautiful Waterman Reservoir! This property offers a rare opportunity to own a home with water views at an affordable price. The cottage does need some work, but with a little vision and effort, it can be transformed into the perfect weekend retreat or year-round residence. Enjoy peaceful surroundings, stunning sunsets, and the chance to make this home truly your own. Don't miss out on this hidden gem with endless potential!
-
2025-09-29$149,900 Active
Show marketing remark (458 chars)
1-bedroom cottage overlooking beautiful Waterman Reservoir! This property offers a rare opportunity to own a home with water views at an affordable price. The cottage does need some work, but with a little vision and effort, it can be transformed into the perfect weekend retreat or year-round residence. Enjoy peaceful surroundings, stunning sunsets, and the chance to make this home truly your own. Don't miss out on this hidden gem with endless potential!
ⓘ Source: listings_history table (triggers on properties + properties_extension) + one-shot
backfill from property_details.listing_events for pre-trigger history.
Tax reassessment forecast RI · Partial reset (capped growth)
- Current annual tax
- $1,781 · $148/mo
- Projected year-2 tax
- $2,112 · $176/mo
- Expected delta
- +$331/yr (+$28/mo · 18.6%)
ⓘ Screening estimate from a state-policy table — verify with the county assessor before closing.
Climate risk First Street
- Flood 1/10 Low FEMA zone X (unshaded) · 0% chance over 30 yrs
- Wildfire 2/10 Low
- Heat 4/10 Moderate 7 d/yr ≥95°F today · 15 d/yr by 30 yrs out
- Wind 6/10 Major 72% chance of damaging wind over 30 yrs
- Air quality 2/10 Low 2 unhealthy d/yr today · 2 by 30 yrs out
Nearby sold comps map
Loading sold comps map…
Walkable amenities ~0.75 mi
Loading nearby amenities…
Taxation est. · year 1
- Rental income
- $20,667
- − Mortgage interest
- −$8,397
- − Property taxes
- −$1,781
- − Insurance
- −$750
- − Repairs & maintenance
- −$1,653
- − Management
- −$1,653
- − Depreciation
- −$4,361
- Taxable income
- $2,072
- Est. tax owed @ 24.0%
- −$497
- After-tax cash flow
- $3,866/yr
For passive investors: Depreciation is non-cash, so a rental often shows a tax loss while cash-flowing — sheltering income. Rental losses are passive: they offset passive income freely, and up to $25,000/yr can offset ordinary (W-2) income if you actively participate and your MAGI is under $100k (phasing out to $0 by $150k); unused losses carry forward. On sale, claimed depreciation is recaptured at up to 25%, and gains may owe capital-gains tax (a 1031 exchange can defer both). Figures are a year-1 estimate at your 24.0% rate — not tax advice; consult a CPA.
Schools (NCES district)
- District
- Glocester
- NCES district ID
- 4400450
- Math proficiency
- 46% ▼ -9.00%
- Reading proficiency
- 66% ▲ 2.00%
- Median HH income
- $81,483
- Composite
- 50.69/100
- National rank
- #1822
- State rank
- #4 of 39 in RI
Livability — Harmony
- Score
- 63/100
- State rank
- #26
- US rank
- #15838
Category grades
Schools grade is shown separately in the Schools card above.
Census & demographics
- Census place
- Harmony, RI
- City population
- 63
- Population (ZIP)
- 7,421
Population outlook (Providence County) Hauer SSP2
- Today (2025)
- 653,469 people
- By 2030
- 660,819 · +1.1%
- By 2040
- 672,747 · +3.0%
- By 2050
- 683,741 · +4.6%
- By 2075
- 720,435 · +10.2%
- By 2100
- 741,582 · +13.5%
Race, ethnicity, and origin ACS 2023
- Neighborhood character
- Predominantly White (95%)
- Race & ethnicity
- White 95% Two or more races 3% Hispanic / Latino 1%
- Common ancestry
- Lithuanian 13% Romanian 5% Russian 5%
- Foreign-born
- 2% · Canada
- Languages at home
- 97% English-only · Spanish 1% Other Indo-European 1%
Political lean MEDSL · Providence
- 2024 margin
- D (+14.4) · D 56.1% · R 41.7% · Other 2.2%
- 2008→2024 swing
- -20.0pp toward R · 2008: 34.4pp · 2024: 14.4pp
- All cycles
- 2024: D+14.4 2020: D+22.9 2016: D+21.2 2012: D+34.9 2008: D+34.4
Not yet ingested
- Civics
- —
Market trends
- HPI YoY
- ▲ 11.23%
- Current HPI
- 383.6236
- Rent YoY
- —
- Metro
- —
- State GDP YoY
- ▲ 2.25%
- F500 in state
- 10
Industry mix (Fortune 500 HQ in RI)
| Industry | F500 HQs | Revenue |
|---|---|---|
| Healthcare | 1 | $373B |
|
||
| Food Distribution | 1 | $31B |
|
||
| Aerospace / Defense | 1 | $14B |
|
||
| Financial Services | 1 | $8B |
|
||
| Consumer Goods | 1 | $4B |
|
||
Price history
+0.0% since first listed4 events — show timeline
- 2025-10-10 Pending — RIS
- 2025-10-10 Pending — RIS
- 2025-09-29 Listed $149,900 RIS
- 2025-09-29 Listed $149,900 RIS
Property tax history
-0.7%/yrLatest (2025): $1,781 · +2.9% YoY. Source: county tax records.
Cash-flow waterfall
monthlySold comps — $/sqft
last 12 mo · ≤1 miLoading sold comps…