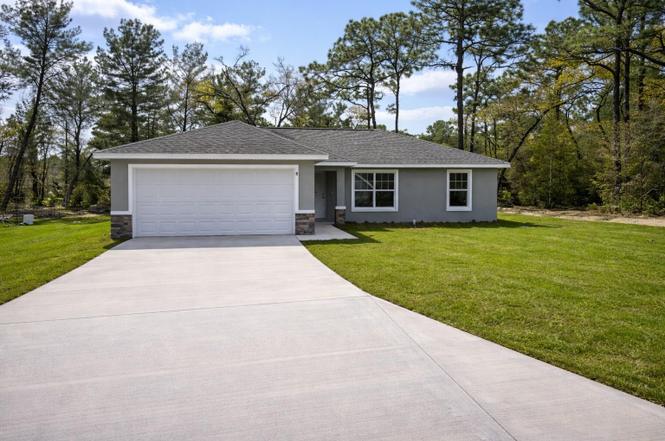
8 Oak Trail Pl · Silver Springs Shores, FL
Flood risk 1/10 · Minimal
- FEMA flood zone
- X (unshaded)
- Chance of flooding over 30 yrs
- 0.0%
- Est. flood insurance / yr
- $507 – $1,088
Fire risk 5/10 · Moderate
- Est. fire insurance / yr
- $947 – $1,759
Heat risk 8/10 · Major
- Hot days now (above 108°F)
- 7 days/yr
- Hot days in 30 yrs
- 21 days/yr
Wind risk 9/10 · Severe
- Chance of severe wind over 30 yrs
- 99.0%
Air-quality risk 3/10 · Minor
- Unhealthy air days now
- 3 days/yr
- Unhealthy air days in 30 yrs
- 4 days/yr
Risk factors via First Street. Map © Google.
Why this score? — see what drove the D- grade
The composite is a weighted blend of 9 inputs, each scored 0–100. Each bar is that input's sub-score; the figure is the points it added to the 100-point composite (weight × sub-score).
- Appreciation +8.0/10.0
- ARV discount +7.5/15.0
- Cash flow +7.3/30.0
- Schools +3.6/10.0
- Livability +3.4/5.0
- Rent growth +2.5/5.0
- Condition / age +2.5/5.0
- 1% rule +2.1/10.0
- DSCR +1.5/10.0
$267,000
🖨 Deal sheet (PDF) 📄 Offer letter ✓ Due diligence
Listing remarks
One or more photo(s) has been virtually staged. This gorgeous brand-new home located in SE Ocala is the ideal escape from the hustle and bustle of city life! Located on a cul-de-sac!! With an open floor plan, pleasing neutral colors and vinyl plank flooring throughout, this 3-bedroom, 2-bathroom residence has all the charm and comfort any family could desire. Showcasing shaker style cabinets with quartz counter tops in the kitchen, a washer/dryer hook up in the inside laundry for added convenience, plus a stainless-steel appliance package, this home is sure to impress. Enjoy your time in the neighborhood while nearby shopping, dining, medical centers and natural springs keep life exciting.
Key facts
- Open floor plan
- Granite counter tops
- Cul-de-sac
Tags
Property features AI
Finance
- Other: Lot size approximately 0.23 acres (one lot); Living area: 1,400 (builder source); Total building area: 1,839; Lot acreage: 0 to less than 1/4 acre; Number of rooms: 5; Furnished: Unfurnished; Direction faces: Southeast; Number of wells: 1
- HOA & community: No HOA/association indicated
Exterior
- Parking: Driveway; Attached 2-car garage
- Utilities: Well water; Septic tank; Electricity connected
- Home design: Single family residence; New construction — completed; One story; Southeast facing; Entry on main level
- Construction: Concrete construction; Shingle roof; Slab foundation; Built by ALDANA (model: JOSIE)
- Exterior features: Patio; Sliding doors; Cleared lot; Located on a cul-de-sac; Paved, publicly maintained road
Interior
- Kitchen: Dishwasher; Range; Range hood
- Bedrooms: 3 bedrooms
- Flooring: Tile flooring; Vinyl flooring
- Bathrooms: 2 full bathrooms
- Heating & cooling: Central heating (electric); Central air conditioning
- Interior features: Cathedral ceilings; Ceiling fans; Kitchen/family room combo; Living room/dining room combo; Open floorplan; Split bedroom layout; Thermostat; Walk-in closets
- Laundry & utility: Laundry inside
Neighborhood map
What this means for you Summary
Snapshot
- This is a 3-bed/2.0-bath land listed at $267k.
Deal economics
- At list price, monthly cash flow is $-357 ($-4k/yr) — negative.
- To cash-flow at today's rent, offer at most $215k (19.3% below list).
- To meet the 1% rule (rent ≥ 1% of price), the offer needs to be $188k (29.4% below list).
- Recommended offer: $188k (29.4% below list) — sets the bar for 1% rule.
Location & tenants
- Location reads 68/100 on livability (#527 in FL) — a middle-class / working-renter tenant base. Strengths: cost of living A+, housing A+, health & safety A-; Watch: crime C-, employment D, amenities F.
- Marion (rural): math 42% / reading 43% proficiency, ranked #61 of 73 in FL (top 84%) — families likely to look elsewhere, expect single-tenant / working-renter base with shorter leases; 61% free/reduced lunch — lower-income household profile, screen leases tightly.
- Zoned schools: Emerald Shores Elementary School (math 30% / reading 34%, grade F, #1,797 of 2,144 statewide, top 86%, 666 students, 74% FRL); Lake Weir Middle School (math 37% / reading 33%, grade F, #416 of 571 statewide, top 74%, 1,207 students, 76% FRL); Lake Weir High School (math 23% / reading 34%, grade F, #458 of 667 statewide, top 69%, 1,483 students, 68% FRL).
- Market conditions: Rents flat; 683 active listings in the ZIP; 6 comparable units currently listed for rent nearby; rentals at typical pace (median 16d on market — plan ~3-4 weeks tenant-placement turnaround); 7,071 units permitted in Marion County in 2024 (534 in 5+ unit buildings).
- This rent runs 35% of the median local income ($64k/yr) — at the standard rent-burdened threshold; future hikes will face affordability resistance.
Forward outlook
- In year one you build about $18k of equity ($2k loan paydown + $16k appreciation (5.9% local appreciation)).
- Marion County population projected at +13% by 2050 — modest demand growth; plan on rents tracking national, not racing it.
- By year 3, paydown + projected appreciation supports a ~$44k cash-out refi (75% LTV) — recoverable capital for the next deal without selling this one.
Negotiation context
- It's been on market 53 days — a 3% lower offer ($259k) is reasonable based on typical stale-listing flexibility.
- Current owner paid $20k; list at $267k implies a 1228% gain — meaningful room to come down on a strong offer.
Risks & watch-outs
- Climate carrying-cost: severe wind risk, 99% chance of damaging wind over 30y; moderate wildfire risk; extreme-heat days projected 7→21/yr by 2055 (HVAC capex compounding) — expect insurance premiums to compound above CPI over the hold.
Questions for the listing agent
- What do current leases actually rent for vs. the listed asking? Can we see a recent rent roll and the last 12 months of T-12 income?
- It's been on market 53 days. Have you received any prior offers? Is the seller open to a 29% concession, seller financing, or rate buy-down credit?
- Is there a deadline driving the sale (1031 exchange, divorce, estate, relocation)? That informs how much negotiation room exists.
- Schools are F-rated, which usually means shorter tenancies and higher turnover. Who's the typical renter profile here, and what's been the actual vacancy rate?
- The area grade is low — what's the realistic commute time and amenity access for the typical tenant pool here? Any planned neighborhood developments (good or bad) we should know about?
- What's the average days-on-market for RENTAL listings here right now (not sales)? A rising rental-DOM trend means longer vacancies and softer asking-rent achievability than the comps imply.
- What's the recent tenant-quality profile in this submarket — average credit score on applications, eviction rate, late-payment / NSF rate, and stable-employment percentage? A property-management company in the area should have these aggregated.
- How much new for-sale + rental construction is in the pipeline within 1–3 miles? Heavy new supply typically softens prices + rents 12–24 months out; constrained supply supports both.
Investment metrics
- 1% rule
- 0.71% ✗
- Cap rate
- 4.69%
- Cash-on-cash
- -5.73%
- DSCR
- 0.75
- GRM
- 11.8
CMA / ARV
No comps found within radius.
Projected returns pro-forma
5.93% appreciation · 0.17% rent growth · sell at horizon
- IRR
- 9.6%
- Equity multiple
- 1.64×
- Total profit
- $48,095
- Equity at exit
- $166,710
- IRR
- 10.2%
- Equity multiple
- 3.01×
- Total profit
- $150,182
- Equity at exit
- $301,345
Cash invested: $74,760 (down + closing). Projections, not guarantees.
Landlord ↔ Tenant lean methodology
- Overall (STATE)
- 87 Strongly Landlord-Friendly
- State Florida
- 87 Strongly Landlord-Friendly · R+3
- County
- — inherits STATE
- City
- — inherits STATE
ZIP-level market 34472
- Home prices YoY
- 2.4%
- Rents YoY
- 0.2%
- Active inventory
- 683
- Price-to-rent
- 11.8×
Monthly cashflow live
- Estimated rent
- $1,884 high interval (Pro) →
- Mortgage (P&I)
- −$1,400
- Tax est. 1.5%
- −$334 /mo · $4,005/yr
- Insurance
- −$111
- HOA
- −$0
- Vacancy / Maint / Mgmt
- −$396
- Net cashflow
- $-357
Break-even live
Sensitivity live
| Price | -10% $-172 | -5% $-265 | +0% $-357 | +5% $-449 | +10% $-542 |
|---|---|---|---|---|---|
| Rent | -10% $-506 | -5% $-431 | +0% $-357 | +5% $-283 | +10% $-208 |
| Rate | -1.0pp $-223 | -0.5pp $-289 | base $-357 | +0.5pp $-426 | +1.0pp $-497 |
UW: 25.0% down · 7.5% · 30yr · 1.5% tax · 5.0% vac · 8.0% maint · 8.0% mgmt
Financing live
Cash to close
- Down payment
- $66,750
- Closing costs
- $8,010
- Reserves months
- —
- Total cash needed
- —
Loan-product check · same deal, 3 products live
Conventional
25% down · 7.5% · 30yr
- Down + closing
- —
- Monthly P&I
- —
- Monthly cashflow
- —
- DSCR
- —
- Eligible?
- —
Personal DTI + credit; lowest rate.
DSCR
20% down · 8.5% · 30yr
- Down + closing
- —
- Monthly P&I
- —
- Monthly cashflow
- —
- DSCR
- —
- Eligible?
- —
No personal income docs; deal must DSCR.
Hard money
10% down · 12.0% · 12mo
- Down + closing
- —
- Monthly P&I
- —
- Monthly cashflow
- —
- DSCR
- —
- Eligible?
- —
Short-term bridge; refi at stabilization.
Rent comps 6 comps
| Address | Beds | Baths | Sqft | Rent | $/sqft | DOM | Units | Dist |
|---|---|---|---|---|---|---|---|---|
| 106 Oak Cir Ocala, FL | 3.0 | 2.0 | 1453 | $1,795 | $1.24 | 15d | 1 | 0.10mi |
| 5 Olive Dr Ocala, FL | 3.0 | 2.0 | 1450 | $1,800 | $1.24 | 23d | 1 | 0.27mi |
| 21 Olive Cir Ocala, FL | 3.0 | 2.0 | 1459 | $1,800 | $1.23 | 15d | 1 | 0.30mi |
| 226 Oak Cir Ocala, FL | 3.0 | 2.0 | 1406 | $1,675 | $1.19 | 15d | 1 | 0.71mi |
| 2 Ash Dr Ocala, FL | 3.0 | 2.0 | 1083 | $1,750 | $1.62 | 15d | 1 | 0.96mi |
| 8 Ash Pass Run Ocala, FL | 3.0 | 2.0 | 1128 | $1,650 | $1.46 | 23d | 1 | 1.06mi |
Listing history 5 events
-
2026-05-04status Pending
-
2026-04-17price $267,000
-
2026-03-25price $268,900
-
2026-03-12$269,900 Active
-
1996-11-26soldstatus $20,100
ⓘ Source: listings_history table (triggers on properties + properties_extension) + one-shot
backfill from property_details.listing_events for pre-trigger history.
Climate risk First Street
- Flood 1/10 Low FEMA zone X (unshaded) · 0% chance over 30 yrs
- Wildfire 5/10 Major
- Heat 8/10 Severe 7 d/yr ≥108°F today · 21 d/yr by 30 yrs out
- Wind 9/10 Extreme 99% chance of damaging wind over 30 yrs
- Air quality 3/10 Moderate 3 unhealthy d/yr today · 4 by 30 yrs out
Nearby sold comps map
Loading sold comps map…
Walkable amenities ~0.75 mi
Loading nearby amenities…
Taxation est. · year 1
- Rental income
- $22,605
- − Mortgage interest
- −$14,956
- − Property taxes
- −$4,005
- − Insurance
- −$1,335
- − Repairs & maintenance
- −$1,808
- − Management
- −$1,808
- − Depreciation
- −$7,767
- Taxable loss
- −$9,075
- Est. tax savings @ 24.0%
- +$2,178
- After-tax cash flow
- $-2,106/yr
For passive investors: Depreciation is non-cash, so a rental often shows a tax loss while cash-flowing — sheltering income. Rental losses are passive: they offset passive income freely, and up to $25,000/yr can offset ordinary (W-2) income if you actively participate and your MAGI is under $100k (phasing out to $0 by $150k); unused losses carry forward. On sale, claimed depreciation is recaptured at up to 25%, and gains may owe capital-gains tax (a 1031 exchange can defer both). Figures are a year-1 estimate at your 24.0% rate — not tax advice; consult a CPA.
Schools (NCES district)
- District
- Marion
- NCES district ID
- 1201260
- Math proficiency
- 42% ▼ -7.00%
- Reading proficiency
- 43% ▼ -4.00%
- Median HH income
- $40,015
- Composite
- 35.61/100
- National rank
- #4890
- State rank
- #61 of 73 in FL
Livability — Silver Springs Shores
- Score
- 68/100
- State rank
- #527
- US rank
- #9854
Category grades
Schools grade is shown separately in the Schools card above.
Census & demographics
- Census place
- Silver Springs Shores, FL
- County
- Marion County · 315,796 people
- City population
- 34,665
- Metro
- Ocala, FL
- Population (ZIP)
- 35,851
- Household income
- $64,208
- Rent vs Own
- Severe rent burden
- 655.0
Population outlook (Marion County) Hauer SSP2
- Today (2025)
- 365,905 people
- By 2030
- 376,768 · +3.0%
- By 2040
- 396,555 · +8.4%
- By 2050
- 412,723 · +12.8%
- By 2075
- 446,090 · +21.9%
- By 2100
- 436,193 · +19.2%
Race, ethnicity, and origin ACS 2023
- Neighborhood character
- Diverse neighborhood (Simpson 0.65)
- Race & ethnicity
- White 50% Hispanic / Latino 25% Black 21% Two or more races 18% Asian 2%
- Hispanic origin (detail)
- Mexican 2% Puerto Rican 14% Cuban 3%
- Common ancestry
- Romanian 2% Iranian 1% Lithuanian 1%
- Foreign-born
- 11% · Canada, Jamaica, China
- Languages at home
- 78% English-only · Spanish 19% Other Indo-European 1%
Political lean MEDSL · Marion
- 2024 margin
- Solid R (+31.6) · D 33.8% · R 65.5%
- 2008→2024 swing
- -20.0pp toward R · 2008: -11.6pp · 2024: -31.6pp
- All cycles
- 2024: R+31.6 2020: R+25.9 2016: R+26.2 2012: R+16.2 2008: R+11.6
Not yet ingested
- Civics
- —
Market trends
- HPI YoY
- ▲ 5.93%
- Current HPI
- 255.0714
- Rent YoY
- ▲ 0.17%
- Metro
- Ocala, FL
- State GDP YoY
- ▲ 3.28%
- F500 in state
- 36
Industry mix (Fortune 500 HQ in FL)
| Industry | F500 HQs | Revenue |
|---|---|---|
| Industrial Technology | 2 | $29B |
|
||
| Insurance | 2 | $17B |
|
||
| Retail | 1 | $60B |
|
||
| Technology Distribution | 1 | $58B |
|
||
| Homebuilding | 1 | $35B |
|
||
| Technology Manufacturing | 1 | $35B |
|
||
Price history
+1228.4% since first listed5 events — show timeline
- 2026-05-04 Pending — Stellar MLS as Distributed by MLS Grid
- 2026-04-17 Price Changed $267,000 Stellar MLS as Distributed by MLS Grid
- 2026-03-25 Price Changed $268,900 Stellar MLS as Distributed by MLS Grid
- 2026-03-12 Listed $269,900 Stellar MLS as Distributed by MLS Grid
- 1996-11-26 Sold (Public Records) $20,100 Public Records
Property tax history
+8.7%/yrLatest (2025): $287 · +14.7% YoY. Source: county tax records.
Cash-flow waterfall
monthlySold comps — $/sqft
last 12 mo · ≤1 miLoading sold comps…