1462 Flatbush Ave Unit 2D · New York, NY
Flood risk No data
- FEMA flood zone
- —
- Chance of flooding over 30 yrs
- —
- Est. flood insurance / yr
- —
Fire risk No data
- Est. fire insurance / yr
- —
Heat risk No data
- Hot days now (above threshold)
- —
- Hot days in 30 yrs
- —
Wind risk No data
- Chance of severe wind over 30 yrs
- —
Air-quality risk No data
- Unhealthy air days now
- —
- Unhealthy air days in 30 yrs
- —
Risk factors via First Street. Map © Google.
Why this score? — see what drove the D+ grade
The composite is a weighted blend of 9 inputs, each scored 0–100. Each bar is that input's sub-score; the figure is the points it added to the 100-point composite (weight × sub-score).
- Cash flow +16.5/30.0
- ARV discount +7.5/15.0
- 1% rule +5.5/10.0
- DSCR +5.1/10.0
- Schools +5.0/10.0
- Livability +3.8/5.0
- Rent growth +3.0/5.0
- Condition / age +2.5/5.0
- Appreciation +0.0/10.0
$445,000
🖨 Deal sheet 📄 Offer letter ✓ Due diligence
Listing remarks
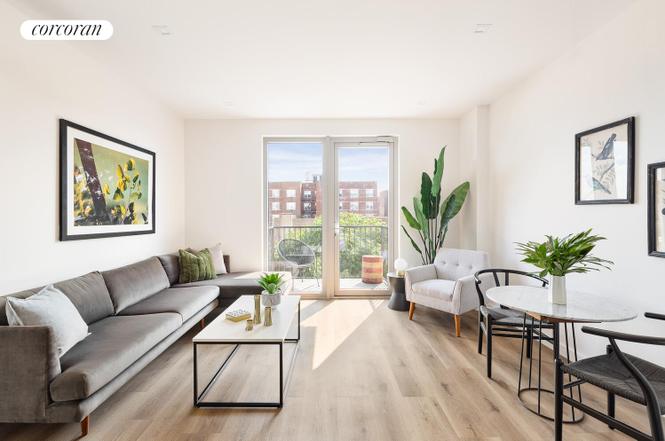
The final phase of sales has commenced at the Avanti, a 45-unit boutique condominium located in the heart of booming and bustling Flatbush Brooklyn. These newly released homes include nine unique 1-bedroom layouts and a 3-bedroom penthouse with wide open views. With comfort, convenience, and function at the forefront of design, these beautiful condominiums offer plenty of room for living, dining, storage and more. King sized bedrooms, commodious foyers, private terraces, and an array of in-unit and building amenities elevate the standard of living to the next level at 1462 Flatbush Avenue. All residences feature private balconies or terraces, walls of double paned Pella windows and doors
Key facts
- Private balconies
- Double paned windows
- Private terraces
Tags
Property features AI
Finance
- Other: Pets allowed in building
- HOA & community: Monthly association fee of $351; Building has elevator(s); 45 total units in the building
Exterior
- Utilities: Has cooling (central air)
- Home design: Condominium in a 7-story building; Entry on level 2; Building named Avanti; New construction
- Construction: Zoning: R7A
- Exterior features: Juliet balcony; Private outdoor space (under 60 sqft); West exposure
Interior
- Kitchen: Dishwasher
- Bedrooms: 3 total rooms (includes bedrooms and living spaces)
- Bathrooms: 1 full bathroom
- Heating & cooling: Central air conditioning
- Interior features: Dining area
- Laundry & utility: Washer hookup; In-unit washer/dryer allowed
Neighborhood map
What this means for you Summary
Snapshot
- This is a 1-bed/1.0-bath single-family listed at $445k.
Deal economics
- At list price, monthly cash flow is $263 ($3k/yr) — positive.
- The deal already cash-flows at list — no discount required.
- Meets the 1% rule at list price ($5k rent vs $445k).
- Recommended offer: $392k (12.0% below list) — sets the bar for market timing.
- Cap rate 7.0% vs local median 2.6% in New York — top-decile yield for the area; either an underpriced asset or a hidden risk that comps aren't pricing in. Stress-test before assuming the spread holds.
Location & tenants
- Location reads 75/100 on livability (#268 in NY, #4,188 nationally) — a middle-class / working-renter tenant base. Strengths: amenities A+, commute A+, health & safety A; Watch: crime F, cost of living F.
- Market conditions: Rents rising (+2.1%/yr); 165 active listings in the ZIP; 25 comparable units currently listed for rent nearby; rentals leasing fast (median 3d on market — plan ~1-2 weeks tenant-placement turnaround); solid renter incomes; 10,063 units permitted in Kings County in 2024 (9,789 in 5+ unit buildings).
- At $4,658/mo this rent would consume 67% of the median local household income ($84k/yr) (locally 3513% of renters already pay >50% of income on rent) — very limited rent-growth headroom before tenants either downsize or default.
Forward outlook
- Local home prices are declining (-3.0%/yr); year-one equity from $3k of loan paydown is wiped out by about $13k of value loss. Plan a longer hold.
- Kings County population projected at +13% by 2050 — modest demand growth; plan on rents tracking national, not racing it.
Negotiation context
- It's been on market 161 days — a 12% lower offer ($392k) is reasonable based on typical stale-listing flexibility.
Questions for the listing agent
- It's been on market 161 days. Have you received any prior offers? Is the seller open to a 12% concession, seller financing, or rate buy-down credit?
- What does the HOA fee cover, when was the last increase, and are there any pending special assessments or reserve-fund shortfalls?
- Why hasn't it sold? Are there any deal-killer items the seller is aware of (foundation, flood, title, zoning, code violations)?
- Is there a deadline driving the sale (1031 exchange, divorce, estate, relocation)? That informs how much negotiation room exists.
- Schools are B-rated — typically a magnet for longer-tenancy family renters. What's the average tenant stay here, and is there a school-zone premium baked into asking?
- Crime grade is F in this area — have there been break-ins, vandalism, or insurance claims at this property in the last 3 years? What carrier currently insures it and at what premium?
- The area grade is low — what's the realistic commute time and amenity access for the typical tenant pool here? Any planned neighborhood developments (good or bad) we should know about?
- What's the average days-on-market for RENTAL listings here right now (not sales)? A rising rental-DOM trend means longer vacancies and softer asking-rent achievability than the comps imply.
- What's the recent tenant-quality profile in this submarket — average credit score on applications, eviction rate, late-payment / NSF rate, and stable-employment percentage? A property-management company in the area should have these aggregated.
- How much new for-sale + rental construction is in the pipeline within 1–3 miles? Heavy new supply typically softens prices + rents 12–24 months out; constrained supply supports both.
Investment metrics
- 1% rule
- 1.05% ✓
- Cap rate
- 7.00%
- Cash-on-cash
- 2.53%
- DSCR
- 1.11
- GRM
- 8.0
CMA / ARV
No comps found within radius.
Projected returns pro-forma
-3.0% appreciation · 2.11% rent growth · sell at horizon
- IRR
- -13.3%
- Equity multiple
- 0.52×
- Total profit
- $-59,223
- Equity at exit
- $66,351
- IRR
- -5.9%
- Equity multiple
- 0.63×
- Total profit
- $-45,540
- Equity at exit
- $38,475
Cash invested: $124,600 (down + closing). Projections, not guarantees.
Landlord ↔ Tenant lean methodology
- Overall (CITY)
- 0 Strongly Tenant-Friendly
- State New York
- 15 Strongly Tenant-Friendly · D+10
- County
- — inherits STATE
- City New York
- 0 Strongly Tenant-Friendly · D+34
ZIP-level market 11210
- Rents YoY
- 2.1%
- Active inventory
- 165
- Price-to-rent
- 8.0×
Monthly cashflow live
- Estimated rent
- $4,658 high interval (Pro) →
- Mortgage (P&I)
- −$2,334
- Tax est. 1.5%
- −$556 /mo · $6,675/yr
- Insurance
- −$185
- HOA
- −$342
- Vacancy / Maint / Mgmt
- −$978
- Net cashflow
- $263
Break-even live
UW: 25.0% down · 7.5% · 30yr · 1.5% tax · 5.0% vac · 8.0% maint · 8.0% mgmt
Financing live
Cash to close
- Down payment
- $111,250
- Closing costs
- $13,350
- Reserves months
- —
- Total cash needed
- —
Loan-product check · same deal, 3 products live
Conventional
25% down · 7.5% · 30yr
- Down + closing
- —
- Monthly P&I
- —
- Monthly cashflow
- —
- DSCR
- —
- Eligible?
- —
Personal DTI + credit; lowest rate.
DSCR
20% down · 8.5% · 30yr
- Down + closing
- —
- Monthly P&I
- —
- Monthly cashflow
- —
- DSCR
- —
- Eligible?
- —
No personal income docs; deal must DSCR.
Hard money
10% down · 12.0% · 12mo
- Down + closing
- —
- Monthly P&I
- —
- Monthly cashflow
- —
- DSCR
- —
- Eligible?
- —
Short-term bridge; refi at stabilization.
Rent comps 25 comps
| Address | Beds | Baths | Sqft | Rent | $/sqft | DOM | Units | Dist |
|---|---|---|---|---|---|---|---|---|
| 540 Fulton St #1729 Brooklyn, NY | 3.0 | 1.0–2.0 | 750 | $5,737 | $7.65 | 24d | 4 | 0.02mi |
| 10 Nevins St Unit 9D Brooklyn, NY | — | 1.0 | 488 | $3,500 | $7.17 | 24d | 1 | 0.04mi |
| 333 Schermerhorn St Brooklyn, NY | 1.0 | 1.0 | 585 | $6,782 | $11.58 | 4d | 16 | 0.13mi |
| 196 Willoughby St Brooklyn, NY | 2.0 | 1.0–2.0 | 717 | $6,064 | $8.46 | 2d | 8 | 0.19mi |
| 214 Duffield St Brooklyn, NY | 3.0 | 1.0–2.0 | 956 | $4,347 | $4.55 | 2d | 1 | 0.27mi |
| 100 Willoughby St Brooklyn, NY | 3.0 | 1.0–2.0 | 892 | $5,232 | $5.87 | 8d | 1 | 0.29mi |
| 72 Willoughby St Brooklyn, NY | 1.0–2.0 | 1.0 | 487 | $3,900 | $8.00 | 2d | 2 | 0.33mi |
| 150 Lawrence St Brooklyn, NY | 1.0–2.0 | 1.0–2.0 | 700 | $4,920 | $7.03 | 2d | 2 | 0.34mi |
| 343 Gold St Brooklyn, NY | 3.0 | 1.0–2.0 | 903 | $5,053 | $5.59 | 4d | 1 | 0.36mi |
| 111 Lawrence St Brooklyn, NY | 3.0 | 1.0–2.0 | 950 | $4,356 | $4.58 | 2d | 24 | 0.38mi |
| 151 S Elliott Pl Brooklyn, NY | 1.0–2.0 | 1.0–2.0 | 655 | $4,670 | $7.13 | 2d | 2 | 0.43mi |
| 461 Dean St Brooklyn, NY | 1.0 | 1.0 | 781 | $5,320 | $6.81 | 5d | 5 | 0.56mi |
| 200 Montague St #1516 Brooklyn, NY | 1.0 | 1.0 | 600 | $7,500 | $12.50 | 21d | 1 | 0.63mi |
| 180 Montague St Brooklyn, NY | 3.0 | 1.0–2.0 | 901 | $5,327 | $5.91 | 2d | 13 | 0.67mi |
| 141 Joralemon St #819 Brooklyn, NY | 1.0–3.0 | 1.0–2.0 | 750 | $5,820 | $7.76 | 2d | 3 | 0.72mi |
| 475 Clermont Ave Brooklyn, NY | 2.0 | 1.0–2.0 | 807 | $5,144 | $6.37 | 4d | 7 | 0.78mi |
| 655 Union St #1846 Brooklyn, NY | 1.0–2.0 | 1.0–2.0 | 727 | $5,780 | $7.95 | 3d | 2 | 0.79mi |
| 545 Vanderbilt Ave Brooklyn, NY | 2.0 | 1.0 | 600 | $4,910 | $8.18 | 3d | 3 | 0.85mi |
| 160 Front St Brooklyn, NY | 1.0 | 1.0 | 597 | $5,191 | $8.70 | 2d | 2 | 0.94mi |
| 107 Columbia Hts #1757 Brooklyn, NY | 1.0–2.0 | 1.0–2.0 | 708 | $5,710 | $8.06 | 2d | 2 | 1.04mi |
| 68 Gold St New York, NY | 1.0–2.0 | 1.0 | 700 | $3,610 | $5.16 | 24d | 2 | 1.07mi |
| 755 Washington Ave Brooklyn, NY | 1.0 | 1.0 | 700 | $1,800 | $2.57 | 21d | 1 | 1.40mi |
| 478 Kent Ave Brooklyn, NY | 2.0 | 1.0–2.0 | 775 | $5,920 | $7.64 | 3d | 3 | 1.42mi |
| 482 Kent Ave Brooklyn, NY | 2.0 | 1.0–2.0 | 750 | $6,545 | $8.73 | 3d | 3 | 1.42mi |
| 11 Wharf Way Brooklyn, NY | 1.0 | 1.0 | 610 | $4,870 | $7.98 | 2d | 2 | 1.46mi |
HOA detail
- Monthly dues
- $342 · $4,104/yr
Listing history 13 events
-
2026-06-18days on market $445,000 Active 161 DOM
-
2026-06-17days on market $445,000 Active 160 DOM
-
2026-06-15days on market $445,000 Active 158 DOM
-
2026-06-13pricedays on market $445,000 Active 156 DOM
-
2026-06-10days on market $459,000 Active 152 DOM
-
2026-06-08days on market $459,000 Active 151 DOM
-
2026-06-04days on market $459,000 Active 147 DOM
-
2026-06-03days on market $459,000 Active 146 DOM
-
2026-06-01days on market $459,000 Active 144 DOM
-
2026-05-31days on market $459,000 Active 143 DOM
-
2026-05-15price $459,000
-
2026-01-26price $499,000
-
2026-01-08$445,000 Active
ⓘ Source: listings_history table (triggers on properties + properties_extension) + one-shot
backfill from property_details.listing_events for pre-trigger history.
Nearby sold comps map
Loading sold comps map…
Walkable amenities ~0.75 mi
Loading nearby amenities…
Taxation est. · year 1
- Rental income
- $55,901
- − Mortgage interest
- −$24,927
- − Property taxes
- −$6,675
- − Insurance
- −$2,225
- − Repairs & maintenance
- −$4,472
- − Management
- −$4,472
- − HOA
- −$4,104
- − Depreciation
- −$12,945
- Taxable loss
- −$3,920
- Est. tax savings @ 24.0%
- +$941
- After-tax cash flow
- $4,095/yr
For passive investors: Depreciation is non-cash, so a rental often shows a tax loss while cash-flowing — sheltering income. Rental losses are passive: they offset passive income freely, and up to $25,000/yr can offset ordinary (W-2) income if you actively participate and your MAGI is under $100k (phasing out to $0 by $150k); unused losses carry forward. On sale, claimed depreciation is recaptured at up to 25%, and gains may owe capital-gains tax (a 1031 exchange can defer both). Figures are a year-1 estimate at your 24.0% rate — not tax advice; consult a CPA.
Schools (NCES district)
No district data.
Livability — New York
- Score
- 75/100
- State rank
- #268
- US rank
- #4188
Category grades
Schools grade is shown separately in the Schools card above.
Census & demographics
- Census place
- New York, NY
- County
- Kings County · 2,614,986 people
- City population
- 7,731,280
- Metro
- New York-Newark-Jersey City, NY-NJ-PA
- Population (ZIP)
- 57,915
- Household income
- $83,692
- Rent vs Own
- Severe rent burden
- 3513.0
Population outlook (Kings County) Hauer SSP2
- Today (2025)
- 2,847,441 people
- By 2030
- 2,937,006 · +3.1%
- By 2040
- 3,095,491 · +8.7%
- By 2050
- 3,228,968 · +13.4%
- By 2075
- 3,321,723 · +16.7%
- By 2100
- 3,111,387 · +9.3%
Race, ethnicity, and origin ACS 2023
- Neighborhood character
- Diverse neighborhood (Simpson 0.65)
- Race & ethnicity
- Black 50% White 30% Two or more races 8% Hispanic / Latino 7% Asian 5%
- Hispanic origin (detail)
- Puerto Rican 2% Dominican 1%
- Common ancestry
- Hispanic 12% Romanian 2% Scotch-Irish 2%
- Foreign-born
- 39% · Canada, China, Mexico
- Languages at home
- 67% English-only · French/Haitian/Cajun 13% Spanish 5% Other Indo-European 3%
Political lean MEDSL · Kings
- 2024 margin
- Solid D (+44.0) · D 72.0% · R 28.0%
- 2008→2024 swing
- -15.5pp toward R · 2008: 59.4pp · 2024: 44.0pp
- All cycles
- 2024: D+44.0 2020: D+54.8 2016: D+61.8 2012: D+63.9 2008: D+59.4
Not yet ingested
- Civics
- —
Market trends
- HPI YoY
- ▼ -831.01%
- Current HPI
- 389.9293
- Rent YoY
- ▲ 2.11%
- Metro
- New York-Newark-Jersey City, NY-NJ-PA
- State GDP YoY
- ▲ 2.60%
- F500 in state
- 92
Industry mix (Fortune 500 HQ in NY)
| Industry | F500 HQs | Revenue |
|---|---|---|
| Financial Services | 10 | $950B |
|
||
| Consumer Goods | 9 | $162B |
|
||
| Insurance | 4 | $225B |
|
||
| Telecommunications | 2 | $144B |
|
||
| Pharmaceuticals | 2 | $112B |
|
||
| Media / Entertainment | 2 | $69B |
|
||
Price history
+3.1% since first listed3 events — show timeline
- 2026-05-15 Price Changed $459,000 RLS at REBNY
- 2026-01-26 Price Changed $499,000 RLS at REBNY
- 2026-01-08 Listed $445,000 RLS at REBNY
Cash-flow waterfall
monthlySold comps — $/sqft
last 12 mo · ≤1 miLoading sold comps…