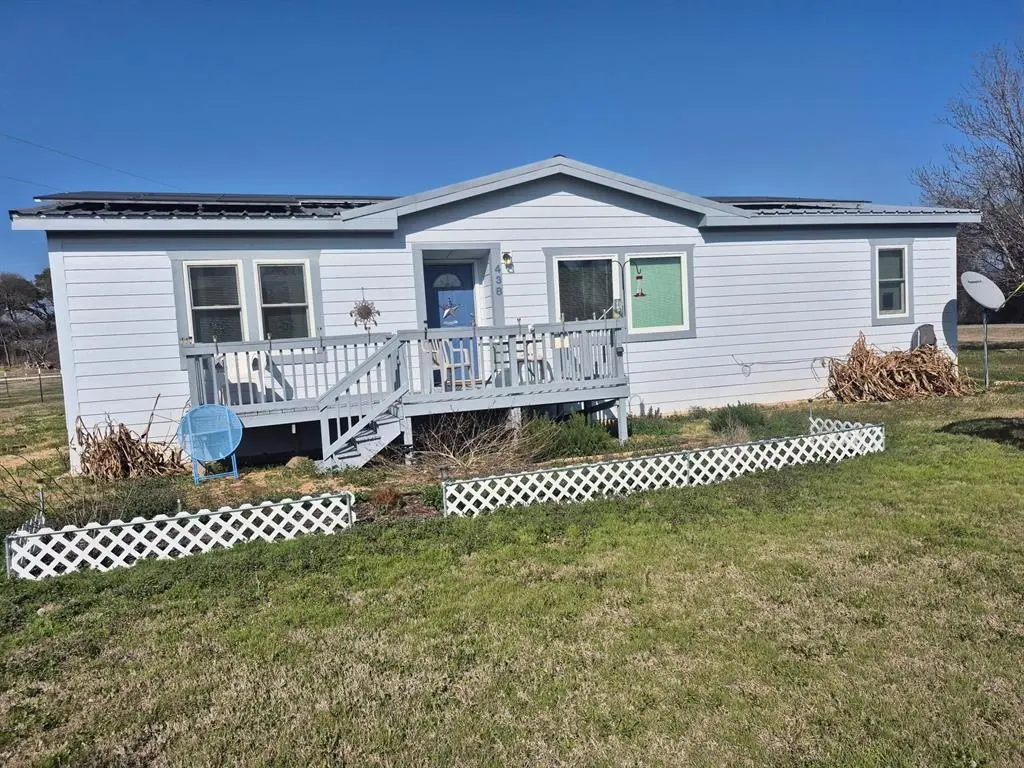
438 Silver River Rd · Gholson, TX
Flood risk 10/10 · Severe
- FEMA flood zone
- A
- Chance of flooding over 30 yrs
- 0.99%
- Est. flood insurance / yr
- $1,009 – $1,996
Fire risk 6/10 · Moderate
- Est. fire insurance / yr
- $1,222 – $2,270
Heat risk 7/10 · Major
- Hot days now (above 110°F)
- 7 days/yr
- Hot days in 30 yrs
- 24 days/yr
Wind risk 6/10 · Moderate
- Chance of severe wind over 30 yrs
- 67.0%
Air-quality risk 2/10 · Minimal
- Unhealthy air days now
- 0 days/yr
- Unhealthy air days in 30 yrs
- 1 days/yr
Risk factors via First Street. Map © Google.
Why this score? — see what drove the C- grade
The composite is a weighted blend of 9 inputs, each scored 0–100. Each bar is that input's sub-score; the figure is the points it added to the 100-point composite (weight × sub-score).
- Cash flow +17.4/30.0
- ARV discount +15.0/15.0
- DSCR +5.4/10.0
- Schools +3.7/10.0
- 1% rule +3.6/10.0
- Livability +3.2/5.0
- Rent growth +3.1/5.0
- Condition / age +2.5/5.0
- Appreciation +0.0/10.0
$180,000
🖨 Deal sheet 📄 Offer letter ✓ Due diligence
Listing remarks MLS
Welcome to this charming 3-bedroom, 2-bathroom manufactured home, boasting 1456 square feet of comfortable living space on a spacious .54 acre lot. The home features a sturdy metal roof, durable Hardie plank siding, New Anderson Windows installed throughout and energy-efficient solar panels, ensuring long-term sustainability. Step outside and enjoy a front deck perfect for relaxing and entertaining. A lovely gazebo provides additional outdoor entertainment, The property includes a one-car carport for convenience, outdoor space for gardening or recreation, as well as a storage shed, perfect for keeping tools, outdoor equipment, or extra belongings. Inside, you'll be greeted by an open floor plan that seamlessly blends the living and dining areas with the kitchen. The kitchen is highlighted by a large island, offering plenty of counter space for meal prep and entertaining. A separate utility room adds to the home's functionality. The master bedroom is generously sized and isolated for privacy, providing a peaceful retreat. The ensuite master bathroom features a spacious layout for maximum comfort, features dual vanities, separate shower and tub for your personal enjoyment. Don't miss the chance to own this beautifully maintained home country home in Gholson, TX.
Key facts
- Hardie plank siding
- Metal roof
- Front deck
Tags
Neighborhood map
What this means for you Summary
Snapshot
- This is a 3-bed/2.0-bath manufactured listed at $180k.
Deal economics
- At list price, monthly cash flow is $10 ($121/yr) — positive.
- The deal already cash-flows at list — no discount required.
- To meet the 1% rule (rent ≥ 1% of price), the offer needs to be $155k (13.7% below list).
- Recommended offer: $155k (13.7% below list) — sets the bar for 1% rule.
- Cap rate 7.2% vs local median 1.7% in Gholson — top-decile yield for the area; either an underpriced asset or a hidden risk that comps aren't pricing in. Stress-test before assuming the spread holds.
Location & tenants
- Location reads 65/100 on livability (#713 in TX) — a middle-class / working-renter tenant base. Strengths: crime A+, cost of living A+, housing A+; Watch: schools F, amenities F, commute F.
- Gholson ISD (rural): math 45% / reading 35% proficiency, ranked #701 of 1,141 in TX (top 61%) — families likely to look elsewhere, expect single-tenant / working-renter base with shorter leases.
- Market conditions: Rents rising (+2.2%/yr); 297 active listings in the ZIP; 1,014 units permitted in McLennan County in 2024 (200 in 5+ unit buildings).
- This rent runs 32% of the median local income ($58k/yr) — at the standard rent-burdened threshold; future hikes will face affordability resistance.
Forward outlook
- Local home prices are declining (-3.0%/yr); year-one equity from $1k of loan paydown is wiped out by about $5k of value loss. Plan a longer hold.
- McLennan County population projected at +17% by 2050 — long-run rental-demand tailwind backs the buy-and-hold thesis.
Negotiation context
- It's been on market 116 days — a 9% lower offer ($164k) is reasonable based on typical stale-listing flexibility.
- 5 sale attempts since 4y ago; this cycle's ask has dropped $45k (20%) from the opening price — seller is motivated, your offer sets the floor, not the list.
Risks & watch-outs
- Watch-outs: flood insurance adds $125/mo.
- Climate carrying-cost: in FEMA flood zone A (mandatory federal flood insurance); major wind risk, 67% chance of damaging wind over 30y; major wildfire risk; extreme-heat days projected 7→24/yr by 2055 (HVAC capex compounding) — expect insurance premiums to compound above CPI over the hold.
Questions for the listing agent
- It's been on market 116 days. Have you received any prior offers? Is the seller open to a 14% concession, seller financing, or rate buy-down credit?
- What's the actual annual flood-insurance premium (NFIP or private), and is the property in a SFHA with mandatory coverage?
- Why hasn't it sold? Are there any deal-killer items the seller is aware of (foundation, flood, title, zoning, code violations)?
- Is there a deadline driving the sale (1031 exchange, divorce, estate, relocation)? That informs how much negotiation room exists.
- Schools are F-rated, which usually means shorter tenancies and higher turnover. Who's the typical renter profile here, and what's been the actual vacancy rate?
- What's the average days-on-market for RENTAL listings here right now (not sales)? A rising rental-DOM trend means longer vacancies and softer asking-rent achievability than the comps imply.
- What's the recent tenant-quality profile in this submarket — average credit score on applications, eviction rate, late-payment / NSF rate, and stable-employment percentage? A property-management company in the area should have these aggregated.
- How much new for-sale + rental construction is in the pipeline within 1–3 miles? Heavy new supply typically softens prices + rents 12–24 months out; constrained supply supports both.
Investment metrics
- 1% rule
- 0.86% ✗
- Cap rate
- 7.20%
- Cash-on-cash
- 3.22%
- DSCR
- 1.14
- GRM
- 9.7
CMA / ARV
- ARV (median comp)
- $336,625
- List price
- $180,000
- Delta
- -46.53%
- Verdict
- UNDERPRICED
- Comps
- 6 within 1.0 mi
Show comp detail 1 sale within ~0.75 mi
| Address | Dist | Beds/Ba | Sqft | Sold | Price | $/sf | Match |
|---|---|---|---|---|---|---|---|
| 281 Fox Glenn Rd | 0.11mi | 4/2.0 (+1) | 1,404 (-4%) | 20mo | $280,000 | $199 | 67 |
Match score weights: distance 35% · size 25% · config 20% · recency 20%. Top-matched comps best support the ARV.
Projected returns pro-forma
-3.0% appreciation · 2.2% rent growth · sell at horizon
- IRR
- -16.8%
- Equity multiple
- 0.41×
- Total profit
- $-29,757
- Equity at exit
- $26,839
- IRR
- -10.1%
- Equity multiple
- 0.40×
- Total profit
- $-30,063
- Equity at exit
- $15,563
Cash invested: $50,400 (down + closing). Projections, not guarantees.
Landlord ↔ Tenant lean methodology
- Overall (STATE)
- 87 Strongly Landlord-Friendly
- State Texas
- 87 Strongly Landlord-Friendly · R+5
- County
- — inherits STATE
- City
- — inherits STATE
ZIP-level market 76705
- Home prices YoY
- -29.6%
- Rents YoY
- 2.2%
- Active inventory
- 297
- Price-to-rent
- 9.7×
Monthly cashflow live
- Estimated rent
- $1,553 medium interval (Pro) →
- Mortgage (P&I)
- −$944
- Tax from tax record
- −$73 /mo · $870/yr
- Insurance
- −$75
- Flood insurance flood zone
- −$125 /mo · $1,502/yr
- HOA
- −$0
- Vacancy / Maint / Mgmt
- −$326
- Net cashflow
- $10
Break-even live
UW: 25.0% down · 7.5% · 30yr · 1.5% tax · 5.0% vac · 8.0% maint · 8.0% mgmt
Financing live
Cash to close
- Down payment
- $45,000
- Closing costs
- $5,400
- Reserves months
- —
- Total cash needed
- —
Loan-product check · same deal, 3 products live
Conventional
25% down · 7.5% · 30yr
- Down + closing
- —
- Monthly P&I
- —
- Monthly cashflow
- —
- DSCR
- —
- Eligible?
- —
Personal DTI + credit; lowest rate.
DSCR
20% down · 8.5% · 30yr
- Down + closing
- —
- Monthly P&I
- —
- Monthly cashflow
- —
- DSCR
- —
- Eligible?
- —
No personal income docs; deal must DSCR.
Hard money
10% down · 12.0% · 12mo
- Down + closing
- —
- Monthly P&I
- —
- Monthly cashflow
- —
- DSCR
- —
- Eligible?
- —
Short-term bridge; refi at stabilization.
Listing history 29 events
-
2026-06-18days on market $180,000 Active 116 DOM
-
2026-06-18price $180,000 Active 115 DOM
-
2026-06-17days on market $225,000 Active 115 DOM
-
2026-06-16days on market $225,000 Active 114 DOM
-
2026-06-15days on market $225,000 Active 113 DOM
-
2026-06-14days on market $225,000 Active 111 DOM
-
2026-06-13days on market $225,000 Active 110 DOM
-
2026-06-10days on market $225,000 Active 108 DOM
-
2026-06-09days on market $225,000 Active 107 DOM
-
2026-06-08days on market $225,000 Active 106 DOM
-
2026-06-07days on market $225,000 Active 105 DOM
-
2026-06-03days on market $225,000 Active 101 DOM
-
2026-06-02days on market $225,000 Active 100 DOM
-
2026-06-01days on market $225,000 Active 99 DOM
-
2026-05-31days on market $225,000 Active 98 DOM
-
2026-05-30days on market $225,000 Active 97 DOM
-
2026-02-21$225,000 Active 1280-char remark
Show marketing remark (1280 chars)
Welcome to this charming 3-bedroom, 2-bathroom manufactured home, boasting 1456 square feet of comfortable living space on a spacious .54 acre lot. The home features a sturdy metal roof, durable Hardie plank siding, New Anderson Windows installed throughout and energy-efficient solar panels, ensuring long-term sustainability. Step outside and enjoy a front deck perfect for relaxing and entertaining. A lovely gazebo provides additional outdoor entertainment, The property includes a one-car carport for convenience, outdoor space for gardening or recreation, as well as a storage shed, perfect for keeping tools, outdoor equipment, or extra belongings. Inside, you'll be greeted by an open floor plan that seamlessly blends the living and dining areas with the kitchen. The kitchen is highlighted by a large island, offering plenty of counter space for meal prep and entertaining. A separate utility room adds to the home's functionality. The master bedroom is generously sized and isolated for privacy, providing a peaceful retreat. The ensuite master bathroom features a spacious layout for maximum comfort, features dual vanities, separate shower and tub for your personal enjoyment. Don't miss the chance to own this beautifully maintained home country home in Gholson, TX.
-
2026-02-15historical
-
2025-12-26price $174,999
-
2025-10-21$175,000 Active
-
2025-09-26historical
-
2025-07-31$175,000 Active
-
2025-07-01historical
-
2025-02-10$175,000 Active
-
2022-05-02soldstatus
-
2022-04-29soldstatus
-
2022-03-22$140,000
-
2017-09-19soldstatus
-
2002-04-11soldstatus
ⓘ Source: listings_history table (triggers on properties + properties_extension) + one-shot
backfill from property_details.listing_events for pre-trigger history.
Tax reassessment forecast TX · Resets to sale price
- Current annual tax
- $870 · $73/mo
- Projected year-2 tax
- $3,294 · $274/mo
- Expected delta
- +$2,424/yr (+$202/mo · 278.6%)
ⓘ Screening estimate from a state-policy table — verify with the county assessor before closing.
Climate risk First Street
- Flood 10/10 Extreme FEMA zone A · 99% chance over 30 yrs
- Wildfire 6/10 Major
- Heat 7/10 Severe 7 d/yr ≥110°F today · 24 d/yr by 30 yrs out
- Wind 6/10 Major 67% chance of damaging wind over 30 yrs
- Air quality 2/10 Low 0 unhealthy d/yr today · 1 by 30 yrs out
Nearby sold comps map
Loading sold comps map…
Walkable amenities ~0.75 mi
Loading nearby amenities…
Taxation est. · year 1
- Rental income
- $18,635
- − Mortgage interest
- −$10,083
- − Property taxes
- −$870
- − Insurance
- −$2,402
- − Repairs & maintenance
- −$1,491
- − Management
- −$1,491
- − Depreciation
- −$5,236
- Taxable loss
- −$2,939
- Est. tax savings @ 24.0%
- +$705
- After-tax cash flow
- $827/yr
For passive investors: Depreciation is non-cash, so a rental often shows a tax loss while cash-flowing — sheltering income. Rental losses are passive: they offset passive income freely, and up to $25,000/yr can offset ordinary (W-2) income if you actively participate and your MAGI is under $100k (phasing out to $0 by $150k); unused losses carry forward. On sale, claimed depreciation is recaptured at up to 25%, and gains may owe capital-gains tax (a 1031 exchange can defer both). Figures are a year-1 estimate at your 24.0% rate — not tax advice; consult a CPA.
Schools (NCES district)
- District
- Gholson ISD
- NCES district ID
- 4820610
- Math proficiency
- 45% ▲ 15.00%
- Reading proficiency
- 35% ▲ 5.00%
- Median HH income
- $49,477
- Composite
- 36.89/100
- National rank
- #9136
- State rank
- #701 of 1141 in TX
Livability — Gholson
- Score
- 65/100
- State rank
- #713
- US rank
- #13345
Category grades
Schools grade is shown separately in the Schools card above.
Census & demographics
- Census place
- Gholson, TX
- County
- McLennan County · 213,088 people
- Metro
- Waco, TX
- Population (ZIP)
- 31,616
- Household income
- $58,236
- Rent vs Own
- Severe rent burden
- 668.0
Population outlook (McLennan County) Hauer SSP2
- Today (2025)
- 264,191 people
- By 2030
- 273,578 · +3.6%
- By 2040
- 291,506 · +10.3%
- By 2050
- 308,044 · +16.6%
- By 2075
- 349,648 · +32.3%
- By 2100
- 364,779 · +38.1%
Race, ethnicity, and origin ACS 2023
- Neighborhood character
- Diverse neighborhood (Simpson 0.68)
- Race & ethnicity
- White 43% Hispanic / Latino 32% Two or more races 20% Black 18% Native American 1% Asian 1%
- Hispanic origin (detail)
- Mexican 31%
- Common ancestry
- Slovak 2% Lithuanian 1% Serbian 1%
- Foreign-born
- 13% · Canada, Vietnam
- Languages at home
- 73% English-only · Spanish 24% Other Indo-European 1% German/W. Germanic 1%
Political lean MEDSL · McLennan
- 2024 margin
- Solid R (+30.9) · D 34.0% · R 64.9% · Other 1.0%
- 2008→2024 swing
- -7.0pp toward R · 2008: -23.9pp · 2024: -30.9pp
- All cycles
- 2024: R+30.9 2020: R+23.4 2016: R+27.1 2012: R+29.8 2008: R+23.9
Not yet ingested
- Civics
- —
Market trends
- HPI YoY
- ▼ -91.45%
- Current HPI
- 217.9429
- Rent YoY
- ▲ 2.20%
- Metro
- Waco, TX
- State GDP YoY
- ▲ 3.95%
- F500 in state
- 110
Industry mix (Fortune 500 HQ in TX)
| Industry | F500 HQs | Revenue |
|---|---|---|
| Energy | 16 | $1,198B |
|
||
| Technology | 5 | $198B |
|
||
| Engineering / Construction | 4 | $72B |
|
||
| Energy Services | 3 | $60B |
|
||
| Utilities | 3 | $41B |
|
||
| Healthcare | 2 | $330B |
|
||
Price history
+60.7% since first listed13 events — show timeline
- 2026-02-21 Listed $225,000 NTREIS
- 2026-02-15 Listing Removed — NTREIS
- 2025-12-26 Price Changed $174,999 NTREIS
- 2025-10-21 Listed $175,000 NTREIS
- 2025-09-26 Listing Removed — NTREIS
- 2025-07-31 Listed $175,000 NTREIS
- 2025-07-01 Listing Removed — NTREIS
- 2025-02-10 Listed $175,000 NTREIS
- 2022-05-02 Sold (Public Records) — Public Records
- 2022-04-29 Sold (MLS) — NTREIS
- 2022-03-22 Listed $140,000 NTREIS
- 2017-09-19 Sold (Public Records) — Public Records
- 2002-04-11 Sold (Public Records) — Public Records
Property tax history
+2.3%/yrLatest (2025): $870 · +3.7% YoY. Source: county tax records.
Cash-flow waterfall
monthlySold comps — $/sqft
last 12 mo · ≤1 miLoading sold comps…