315 Grandview Dr · Camp Nelson, CA
Flood risk No data
- FEMA flood zone
- —
- Chance of flooding over 30 yrs
- —
- Est. flood insurance / yr
- —
Fire risk No data
- Est. fire insurance / yr
- —
Heat risk No data
- Hot days now (above threshold)
- —
- Hot days in 30 yrs
- —
Wind risk No data
- Chance of severe wind over 30 yrs
- —
Air-quality risk No data
- Unhealthy air days now
- —
- Unhealthy air days in 30 yrs
- —
Risk factors via First Street. Map © Google.
Why this score? — see what drove the C grade
The composite is a weighted blend of 9 inputs, each scored 0–100. Each bar is that input's sub-score; the figure is the points it added to the 100-point composite (weight × sub-score).
- Cash flow +15.4/30.0
- ARV discount +15.0/15.0
- Appreciation +10.0/10.0
- DSCR +4.7/10.0
- Schools +4.4/10.0
- 1% rule +3.1/10.0
- Rent growth +2.5/5.0
- Condition / age +2.5/5.0
- Livability +1.2/5.0
$225,000
🖨 Deal sheet (PDF) 📄 Offer letter ✓ Due diligence
Listing remarks
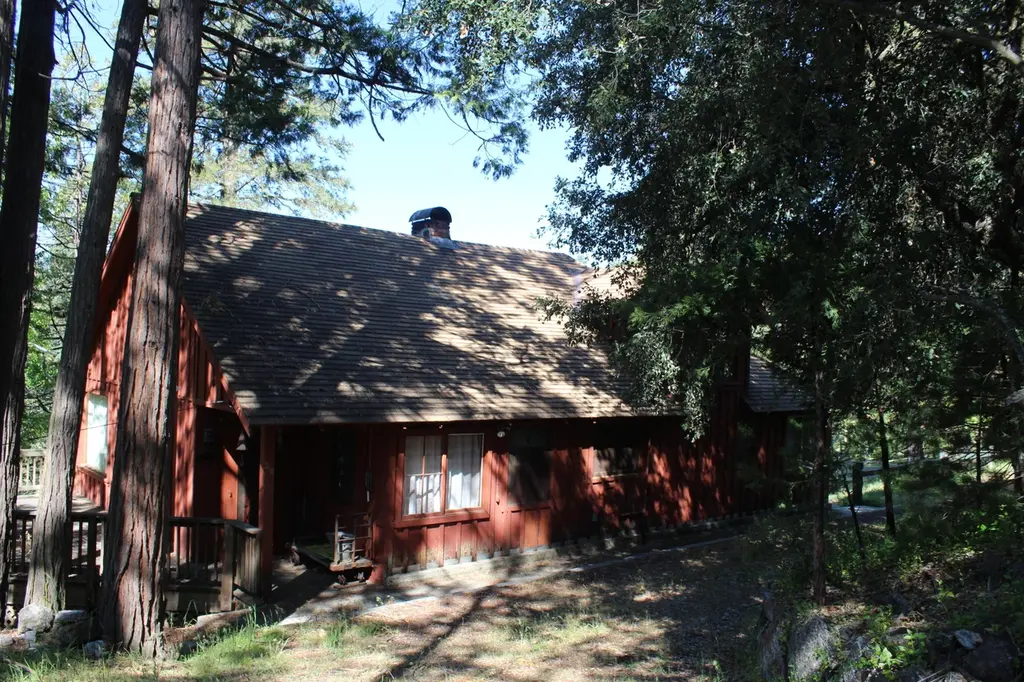
This rustic cabin is on a private cul de sac street with a circular driveway. Lots of knotty pine throughout for a true cabin feel. The main level offers a living room with dining area and a wood stove, adjacent is the family room area with a large brick fireplace. Kitchen is older style but functions just fine for your periodic getaways. There are also 2 bedrooms and a hall bath. Upstairs is another bedroom and room to put a small 3/4 bath if you want. This parcel overlooks the neighbors meadow. Easy walk to the Camp Nelson General Store, Saloon, Laundry facility and the Meadow and Conservancy where many of our events take place. If you're looking for that mountain cabin feel this home has
Key facts
- Wood stove
- Easy walk to saloon
- Private cul de sac
Tags
Property features AI
Exterior
- Parking: Detached parking; Gravel surfaces; Circular driveway; Driveway
- Security: Carbon monoxide detector(s); Smoke detector(s)
- Utilities: Private water source; Septic tank; 100 amp electric service; Electricity connected; Water connected; Sewer connected
- Home design: Single-family residence; 2 stories; Fixer condition; Residential use; Mountain Residential zoning
- Construction: Wood siding and board & batten siding; Raised pier/pillar foundation; Composition roof; Built on two stories
- Exterior features: Deck; Sloped, irregular lot with backyard; Gentle to moderate slopes; Asphalt road access; Has view
Interior
- Kitchen: Free-standing electric range; Refrigerator; Free-standing refrigerator; Electric water heater
- Bedrooms: 2 main-level bedrooms
- Flooring: Laminate flooring; Vinyl flooring; Wood flooring
- Bathrooms: One main-level three-quarter bathroom
- Heating & cooling: Wood heating with wood stove and fireplace; Electric cooling; Ceiling fans
- Interior features: Ceiling fans; Laminate counters; Pantry; Storage; Wood-burning fireplace (masonry) with wood stove; Has fireplace
- Laundry & utility: No laundry hookups listed
Neighborhood map
What this means for you Summary
Snapshot
- This is a 3-bed/1.0-bath single-family listed at $225k.
Deal economics
- At list price, monthly cash flow is $88 ($1k/yr) — positive.
- The deal already cash-flows at list — no discount required.
- To meet the 1% rule (rent ≥ 1% of price), the offer needs to be $182k (18.9% below list).
- Recommended offer: $182k (18.9% below list) — sets the bar for 1% rule.
Location & tenants
- Location reads 25/100 on livability (#1,489 in CA) — a limited-amenity area; tenant pool skews transient or value-seeking. Strengths: crime A, health & safety A; Watch: amenities F, commute F, employment F.
- Springville Union Elementary (rural): math 44% / reading 52% proficiency, ranked #476 of 1,400 in CA (top 34%) — families likely to look elsewhere, expect single-tenant / working-renter base with shorter leases.
- Zoned schools: Springville Elementary (math 32% / reading 47%, grade F, #621 of 1,571 statewide, top 42%, 329 students, 60% FRL) — zoned schools average 60% FRL vs 35% district-wide (24 pts higher); higher-poverty schools than district average — tighter screening recommended.
- Market conditions: 125 active listings in the ZIP; 1,447 units permitted in Tulare County in 2024 (307 in 5+ unit buildings).
Forward outlook
- In year one you build about $24k of equity ($2k loan paydown + $22k appreciation (10.0% local appreciation)).
- Tulare County population projected at +10% by 2050 — modest demand growth; plan on rents tracking national, not racing it.
- At projected returns (10.0% appreciation + 3.0% rent growth), your $63k cash investment doubles in ~3 years — after that, you're playing with house money.
- By year 2, paydown + projected appreciation supports a ~$39k cash-out refi (75% LTV) — recoverable capital for the next deal without selling this one.
Negotiation context
- It's been on market 56 days — a 3% lower offer ($218k) is reasonable based on typical stale-listing flexibility.
- Current owner paid $55k; list at $225k implies a 309% gain — meaningful room to come down on a strong offer.
Risks & watch-outs
- Watch-outs: built in 1950 — expect roof / HVAC / electrical / plumbing capex.
Questions for the listing agent
- It's been on market 56 days. Have you received any prior offers? Is the seller open to a 19% concession, seller financing, or rate buy-down credit?
- Built in 1950 — when were the roof, HVAC, electrical panel, plumbing, and water heater last replaced?
- Is there a deadline driving the sale (1031 exchange, divorce, estate, relocation)? That informs how much negotiation room exists.
- What's the average days-on-market for RENTAL listings here right now (not sales)? A rising rental-DOM trend means longer vacancies and softer asking-rent achievability than the comps imply.
- What's the recent tenant-quality profile in this submarket — average credit score on applications, eviction rate, late-payment / NSF rate, and stable-employment percentage? A property-management company in the area should have these aggregated.
- How much new for-sale + rental construction is in the pipeline within 1–3 miles? Heavy new supply typically softens prices + rents 12–24 months out; constrained supply supports both.
Investment metrics
- 1% rule
- 0.81% ✗
- Cap rate
- 6.76%
- Cash-on-cash
- 1.67%
- DSCR
- 1.07
- GRM
- 10.3
CMA / ARV
- ARV (on-the-fly)
- $363,150
- Comps found
- 2
Show comp detail 2 sales within ~0.75 mi
| Address | Dist | Beds/Ba | Sqft | Sold | Price | $/sf | Match |
|---|---|---|---|---|---|---|---|
| 654 Trails End Dr | 0.40mi | 2/1.5 (-1) | 1,300 (-4%) | 18mo | $215,000 | $165 | 53 |
| 1184 Highway 190 | 0.65mi | 2/2.0 (-1) | 1,150 (-15%) | 10mo | $309,000 | $269 | 27 |
Match score weights: distance 35% · size 25% · config 20% · recency 20%. Top-matched comps best support the ARV.
Projected returns pro-forma
10.0% appreciation · 3.0% rent growth · sell at horizon
- IRR
- 25.5%
- Equity multiple
- 3.03×
- Total profit
- $128,029
- Equity at exit
- $202,698
- IRR
- 22.4%
- Equity multiple
- 6.91×
- Total profit
- $372,441
- Equity at exit
- $437,126
Cash invested: $63,000 (down + closing). Projections, not guarantees.
Landlord ↔ Tenant lean methodology
- Overall (STATE)
- 18 Strongly Tenant-Friendly
- State California
- 18 Strongly Tenant-Friendly · D+13
- County
- — inherits STATE
- City
- — inherits STATE
ZIP-level market 93265
- Home prices YoY
- 9.1%
- Active inventory
- 125
- Price-to-rent
- 10.3×
Monthly cashflow live
- Estimated rent
- $1,824 medium interval (Pro) →
- Mortgage (P&I)
- −$1,180
- Tax from tax record
- −$80 /mo · $957/yr
- Insurance
- −$94
- HOA
- −$0
- Vacancy / Maint / Mgmt
- −$383
- Net cashflow
- $88
Break-even live
Sensitivity live
| Price | -10% $215 | -5% $151 | +0% $88 | +5% $24 | +10% $-40 |
|---|---|---|---|---|---|
| Rent | -10% $-56 | -5% $16 | +0% $88 | +5% $160 | +10% $232 |
| Rate | -1.0pp $201 | -0.5pp $145 | base $88 | +0.5pp $29 | +1.0pp $-30 |
UW: 25.0% down · 7.5% · 30yr · 1.5% tax · 5.0% vac · 8.0% maint · 8.0% mgmt
Financing live
Cash to close
- Down payment
- $56,250
- Closing costs
- $6,750
- Reserves months
- —
- Total cash needed
- —
Loan-product check · same deal, 3 products live
Conventional
25% down · 7.5% · 30yr
- Down + closing
- —
- Monthly P&I
- —
- Monthly cashflow
- —
- DSCR
- —
- Eligible?
- —
Personal DTI + credit; lowest rate.
DSCR
20% down · 8.5% · 30yr
- Down + closing
- —
- Monthly P&I
- —
- Monthly cashflow
- —
- DSCR
- —
- Eligible?
- —
No personal income docs; deal must DSCR.
Hard money
10% down · 12.0% · 12mo
- Down + closing
- —
- Monthly P&I
- —
- Monthly cashflow
- —
- DSCR
- —
- Eligible?
- —
Short-term bridge; refi at stabilization.
Listing history 20 events
-
2026-06-21days on market $225,000 Active 56 DOM
-
2026-06-18price $225,000 Active 53 DOM
-
2026-06-18days on market $240,000 Active 53 DOM
-
2026-06-17days on market $240,000 Active 52 DOM
-
2026-06-16days on market $240,000 Active 51 DOM
-
2026-06-15days on market $240,000 Active 50 DOM
-
2026-06-14days on market $240,000 Active 48 DOM
-
2026-06-13days on market $240,000 Active 47 DOM
-
2026-06-10days on market $240,000 Active 45 DOM
-
2026-06-09days on market $240,000 Active 44 DOM
-
2026-06-08days on market $240,000 Active 43 DOM
-
2026-06-07days on market $240,000 Active 42 DOM
-
2026-06-05days on market $240,000 Active 39 DOM
-
2026-06-03days on market $240,000 Active 38 DOM
-
2026-06-02days on market $240,000 Active 37 DOM
-
2026-06-01days on market $240,000 Active 36 DOM
-
2026-05-31days on market $240,000 Active 35 DOM
-
2026-05-30days on market $240,000 Active 34 DOM
-
2026-04-26$240,000 Active
-
1996-10-25soldstatus $55,000
ⓘ Source: listings_history table (triggers on properties + properties_extension) + one-shot
backfill from property_details.listing_events for pre-trigger history.
Tax reassessment forecast CA · Resets to sale price
- Current annual tax
- $957 · $80/mo
- Projected year-2 tax
- $1,710 · $142/mo
- Expected delta
- +$753/yr (+$63/mo · 78.6%)
ⓘ Screening estimate from a state-policy table — verify with the county assessor before closing.
Nearby sold comps map
Loading sold comps map…
Walkable amenities ~0.75 mi
Loading nearby amenities…
Taxation est. · year 1
- Rental income
- $21,891
- − Mortgage interest
- −$12,603
- − Property taxes
- −$957
- − Insurance
- −$1,125
- − Repairs & maintenance
- −$1,751
- − Management
- −$1,751
- − Depreciation
- −$6,545
- Taxable loss
- −$2,843
- Est. tax savings @ 24.0%
- +$682
- After-tax cash flow
- $1,735/yr
For passive investors: Depreciation is non-cash, so a rental often shows a tax loss while cash-flowing — sheltering income. Rental losses are passive: they offset passive income freely, and up to $25,000/yr can offset ordinary (W-2) income if you actively participate and your MAGI is under $100k (phasing out to $0 by $150k); unused losses carry forward. On sale, claimed depreciation is recaptured at up to 25%, and gains may owe capital-gains tax (a 1031 exchange can defer both). Figures are a year-1 estimate at your 24.0% rate — not tax advice; consult a CPA.
Schools (NCES district)
- District
- Springville Union Elementary
- NCES district ID
- 0637770
- Math proficiency
- 44% ▲ 4.00%
- Reading proficiency
- 52% ▲ 1.00%
- Median HH income
- $53,881
- Composite
- 43.58/100
- National rank
- #6431
- State rank
- #476 of 1400 in CA
Livability — Camp Nelson
- Score
- 25/100
- State rank
- #1489
- US rank
- #27998
Category grades
Schools grade is shown separately in the Schools card above.
Census & demographics
- Census place
- Camp Nelson, CA
- Population (ZIP)
- 3,532
Population outlook (Tulare County) Hauer SSP2
- Today (2025)
- 484,681 people
- By 2030
- 496,241 · +2.4%
- By 2040
- 518,507 · +7.0%
- By 2050
- 534,920 · +10.4%
- By 2075
- 548,417 · +13.2%
- By 2100
- 513,085 · +5.9%
Race, ethnicity, and origin ACS 2023
- Neighborhood character
- Majority White (64%)
- Race & ethnicity
- White 64% Hispanic / Latino 22% Two or more races 19% Asian 6% Pacific Islander 1%
- Hispanic origin (detail)
- Mexican 21%
- Common ancestry
- Slovak 2% Iranian 2% Scottish 1%
- Foreign-born
- 4% · Canada, Guatemala, South Korea
- Languages at home
- 92% English-only · Spanish 4% Tagalog/Filipino 3% Other Asian/Pacific 1%
Political lean MEDSL · Tulare
- 2024 margin
- Strong R (+20.7) · D 38.5% · R 59.2% · Other 2.3%
- 2008→2024 swing
- -5.4pp toward R · 2008: -15.3pp · 2024: -20.7pp
- All cycles
- 2024: R+20.7 2020: R+7.8 2016: R+12.1 2012: R+17.8 2008: R+15.3
Not yet ingested
- Civics
- —
Market trends
- HPI YoY
- ▲ 30.24%
- Current HPI
- 361.9818
- Rent YoY
- —
- Metro
- —
- State GDP YoY
- ▲ 3.21%
- F500 in state
- 116
Industry mix (Fortune 500 HQ in CA)
| Industry | F500 HQs | Revenue |
|---|---|---|
| Technology | 27 | $1,492B |
|
||
| Financial Services | 3 | $174B |
|
||
| Retail | 3 | $44B |
|
||
| Insurance | 3 | $26B |
|
||
| Media / Entertainment | 2 | $115B |
|
||
| Pharmaceuticals / Biotech | 2 | $62B |
|
||
Price history
+336.4% since first listed2 events — show timeline
- 2026-04-26 Listed $240,000 TCMLS
- 1996-10-25 Sold (Public Records) $55,000 Public Records
Property tax history
+2.1%/yrLatest (2025): $957 · +3.5% YoY. Source: county tax records.
Cash-flow waterfall
monthlySold comps — $/sqft
last 12 mo · ≤1 miLoading sold comps…