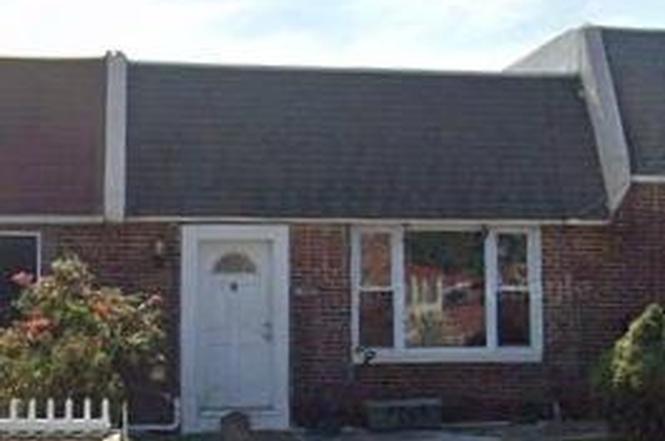
1402 Cosgrove St · Linwood, PA
Flood risk 1/10 · Minimal
- FEMA flood zone
- X (unshaded)
- Chance of flooding over 30 yrs
- 0.0%
- Est. flood insurance / yr
- $473 – $860
Fire risk 1/10 · Minimal
- Est. fire insurance / yr
- $511 – $949
Heat risk 7/10 · Major
- Hot days now (above 104°F)
- 7 days/yr
- Hot days in 30 yrs
- 15 days/yr
Wind risk 6/10 · Moderate
- Chance of severe wind over 30 yrs
- 27.0%
Air-quality risk 4/10 · Minor
- Unhealthy air days now
- 4 days/yr
- Unhealthy air days in 30 yrs
- 7 days/yr
Risk factors via First Street. Map © Google.
Why this score? — see what drove the C+ grade
The composite is a weighted blend of 9 inputs, each scored 0–100. Each bar is that input's sub-score; the figure is the points it added to the 100-point composite (weight × sub-score).
- Cash flow +23.5/30.0
- ARV discount +15.0/15.0
- DSCR +7.5/10.0
- 1% rule +5.2/10.0
- Livability +4.0/5.0
- Rent growth +3.0/5.0
- Schools +2.7/10.0
- Condition / age +2.5/5.0
- Appreciation +0.0/10.0
$144,000
🖨 Deal sheet 📄 Offer letter ✓ Due diligence
Listing remarks
Welcome to 1402 Cosgrove St in Marcus Hook, PA — a thoughtfully updated 3-bedroom, 1 full bath split-level home offering comfortable living spaces, modern finishes, and great everyday functionality. Step inside to a bright living room with high ceilings that create an open, airy feel and make the space live larger. The living room, upper-level bedrooms, and full bath feature luxury vinyl plank flooring, giving the home a clean, cohesive look with easy-care appeal. The full bath is enhanced by a skylight, bringing in natural light and adding a fresh, inviting touch. On the lower level, you’ll find tile flooring, bright kitchen cabinetry, and convenient built-ins throughout the ho
Key facts
- Bright living room
- Tile flooring
- Built 1955
Tags
Property features AI
Exterior
- Parking: On-street parking
- Utilities: Public water; Public sewer; Electric service available; Phone service available; Cable TV available
- Home design: Interior townhouse/rowhouse; Facing not specified
- Construction: Brick construction; Flat roof; Crawl space foundation; Built year as recorded by assessor
- Exterior features: Patio(s); Property in good condition; Pets allowed with no restrictions
Interior
- Kitchen: Gas oven/range; Refrigerator
- Bedrooms: Two bedrooms on the upper level; One bedroom on the lower level
- Flooring: Luxury vinyl plank
- Bathrooms: One full bathroom
- Heating & cooling: Forced air heating (natural gas); Central air conditioning (electric); Natural gas hot water
- Interior features: Skylights; Tub with shower
- Laundry & utility: Laundry hookups
Neighborhood map
What this means for you Summary
Snapshot
- This is a 2-bed/1.0-bath townhouse listed at $144k.
Deal economics
- At list price, monthly cash flow is $268 ($3k/yr) — positive.
- The deal already cash-flows at list — no discount required.
- Meets the 1% rule at list price ($1k rent vs $144k).
Location & tenants
- Location reads 79/100 on livability (#234 in PA, #2,020 nationally) — a middle-class / working-renter tenant base. Strengths: cost of living A+, housing A+, crime A; Watch: commute D+, amenities F.
- Chichester SD (suburban): math 19% / reading 41% proficiency, ranked #438 of 539 in PA (top 81%) — families likely to look elsewhere, expect single-tenant / working-renter base with shorter leases.
- Market conditions: Rents rising (+1.8%/yr); 68 active listings in the ZIP; 6 comparable units currently listed for rent nearby; rentals lingering (median 44d on market — plan ~5-8 weeks vacancy on turnover, expect pricing pressure); 50% of comp listings sitting > 30 days — soft ceiling on asking rent; solid renter incomes; 299 units permitted in Delaware County in 2024 (5 in 5+ unit buildings).
Forward outlook
- Local home prices are declining (-3.0%/yr); year-one equity from $996 of loan paydown is wiped out by about $4k of value loss. Plan a longer hold.
Negotiation context
- Only 1 days on market — expect competitive offers; lowballing is unlikely to land.
- Current owner paid $64k; list at $144k implies a 127% gain — meaningful room to come down on a strong offer.
Risks & watch-outs
- Watch-outs: built in 1955 — expect roof / HVAC / electrical / plumbing capex.
- Climate carrying-cost: major wind risk, 27% chance of damaging wind over 30y; extreme-heat days projected 7→15/yr by 2055 (HVAC capex compounding) — expect insurance premiums to compound above CPI over the hold.
Questions for the listing agent
- Built in 1955 — when were the roof, HVAC, electrical panel, plumbing, and water heater last replaced?
- Is there a deadline driving the sale (1031 exchange, divorce, estate, relocation)? That informs how much negotiation room exists.
- What's the average days-on-market for RENTAL listings here right now (not sales)? A rising rental-DOM trend means longer vacancies and softer asking-rent achievability than the comps imply.
- What's the recent tenant-quality profile in this submarket — average credit score on applications, eviction rate, late-payment / NSF rate, and stable-employment percentage? A property-management company in the area should have these aggregated.
- How much new for-sale + rental construction is in the pipeline within 1–3 miles? Heavy new supply typically softens prices + rents 12–24 months out; constrained supply supports both.
Investment metrics
- 1% rule
- 1.02% ✓
- Cap rate
- 8.52%
- Cash-on-cash
- 7.97%
- DSCR
- 1.35
- GRM
- 8.2
CMA / ARV
- ARV (on-the-fly)
- $195,120
- Comps found
- 12
Show comp detail 12 sales within ~0.75 mi
| Address | Dist | Beds/Ba | Sqft | Sold | Price | $/sf | Match |
|---|---|---|---|---|---|---|---|
| 1412 Simpson St | 0.04mi | 3/1.0 (+1) | 720 (0%) | 7mo | $195,000 | $271 | 87 |
| 325 White Ave | 0.09mi | 3/1.0 (+1) | 720 (0%) | 6mo | $179,900 | $250 | 86 |
| 1414 Simpson St | 0.04mi | 3/1.0 (+1) | 720 (0%) | 11mo | $175,000 | $243 | 84 |
| 332 White Ave | 0.12mi | 3/2.0 (+1) | 720 (0%) | 2mo | $230,000 | $319 | 84 |
| 119 Chadwick Ave | 0.25mi | 3/1.0 (+1) | 720 (0%) | 2mo | $213,000 | $296 | 82 |
| 156 Fronefield Ave | 0.28mi | 2/1.5 | 720 (0%) | 8mo | $160,000 | $222 | 78 |
| 135 Ervin | 0.25mi | 3/1.5 (+1) | 720 (0%) | 5mo | $118,000 | $164 | 78 |
| 105 Fronefield Ave | 0.32mi | 3/1.5 (+1) | 720 (0%) | 1mo | $146,000 | $203 | 77 |
| 163 Chadwick Ave | 0.19mi | 3/1.5 (+1) | 720 (0%) | 9mo | $175,000 | $243 | 77 |
| 1556 Summit St | 0.33mi | 3/1.5 (+1) | 720 (0%) | 4mo | $216,000 | $300 | 74 |
| 111 Ervin Ave | 0.28mi | 3/1.5 (+1) | 720 (0%) | 10mo | $196,000 | $272 | 71 |
| 1592 Summit St | 0.38mi | 3/1.0 (+1) | 720 (0%) | 10mo | $199,900 | $278 | 69 |
Match score weights: distance 35% · size 25% · config 20% · recency 20%. Top-matched comps best support the ARV.
Projected returns pro-forma
-3.0% appreciation · 1.83% rent growth · sell at horizon
- IRR
- -5.4%
- Equity multiple
- 0.80×
- Total profit
- $-8,033
- Equity at exit
- $21,471
- IRR
- 2.9%
- Equity multiple
- 1.20×
- Total profit
- $7,957
- Equity at exit
- $12,450
Cash invested: $40,320 (down + closing). Projections, not guarantees.
Landlord ↔ Tenant lean methodology
- Overall (STATE)
- 62 Landlord-Friendly
- State Pennsylvania
- 62 Landlord-Friendly · EVEN
- County
- — inherits STATE
- City
- — inherits STATE
ZIP-level market 19061
- Rents YoY
- 1.8%
- Active inventory
- 68
- Price-to-rent
- 8.2×
Monthly cashflow live
- Estimated rent
- $1,462 high interval (Pro) →
- Mortgage (P&I)
- −$755
- Tax from tax record
- −$72 /mo · $868/yr
- Insurance
- −$60
- HOA
- −$0
- Vacancy / Maint / Mgmt
- −$307
- Net cashflow
- $268
Break-even live
UW: 25.0% down · 7.5% · 30yr · 1.5% tax · 5.0% vac · 8.0% maint · 8.0% mgmt
Financing live
Cash to close
- Down payment
- $36,000
- Closing costs
- $4,320
- Reserves months
- —
- Total cash needed
- —
Loan-product check · same deal, 3 products live
Conventional
25% down · 7.5% · 30yr
- Down + closing
- —
- Monthly P&I
- —
- Monthly cashflow
- —
- DSCR
- —
- Eligible?
- —
Personal DTI + credit; lowest rate.
DSCR
20% down · 8.5% · 30yr
- Down + closing
- —
- Monthly P&I
- —
- Monthly cashflow
- —
- DSCR
- —
- Eligible?
- —
No personal income docs; deal must DSCR.
Hard money
10% down · 12.0% · 12mo
- Down + closing
- —
- Monthly P&I
- —
- Monthly cashflow
- —
- DSCR
- —
- Eligible?
- —
Short-term bridge; refi at stabilization.
Rent comps 6 comps
| Address | Beds | Baths | Sqft | Rent | $/sqft | DOM | Units | Dist |
|---|---|---|---|---|---|---|---|---|
| 117 Ervin Ave Marcus Hook, PA | 3.0 | 1.5 | 720 | $1,595 | $2.22 | 20d | 1 | 0.27mi |
| 1006 Keystone Rd Chester, PA | 2.0 | 1.0 | 750 | $1,200 | $1.60 | 24d | 1 | 0.94mi |
| 1107-1115 Keystone Rd Chester, PA | 2.0 | 1.0 | 700 | $1,250 | $1.79 | 43d | 1 | 0.96mi |
| 908 Keystone Rd Chester, PA | 2.0 | 1.0 | 750 | $1,200 | $1.60 | 43d | 1 | 0.97mi |
| 2820 Chichester Ave Boothwyn, PA | 1.0 | 1.0 | 750 | $1,210 | $1.61 | 43d | 1 | 1.42mi |
| 2820 Chichester Ave Boothwyn, PA | 1.0 | 1.0 | 750 | $1,197 | $1.60 | 24d | 1 | 1.42mi |
Listing history 2 events
-
2026-06-18remarks 687-char remark
-
2026-06-18$144,000 Active 1 DOM
ⓘ Source: listings_history table (triggers on properties + properties_extension) + one-shot
backfill from property_details.listing_events for pre-trigger history.
Tax reassessment forecast PA · Partial reset (capped growth)
- Current annual tax
- $868 · $72/mo
- Projected year-2 tax
- $1,572 · $131/mo
- Expected delta
- +$704/yr (+$59/mo · 81.1%)
ⓘ Screening estimate from a state-policy table — verify with the county assessor before closing.
Climate risk First Street
- Flood 1/10 Low FEMA zone X (unshaded) · 0% chance over 30 yrs
- Wildfire 1/10 Low
- Heat 7/10 Severe 7 d/yr ≥104°F today · 15 d/yr by 30 yrs out
- Wind 6/10 Major 27% chance of damaging wind over 30 yrs
- Air quality 4/10 Moderate 4 unhealthy d/yr today · 7 by 30 yrs out
Nearby sold comps map
Loading sold comps map…
Walkable amenities ~0.75 mi
Loading nearby amenities…
Taxation est. · year 1
- Rental income
- $17,546
- − Mortgage interest
- −$8,066
- − Property taxes
- −$868
- − Insurance
- −$720
- − Repairs & maintenance
- −$1,404
- − Management
- −$1,404
- − Depreciation
- −$4,189
- Taxable income
- $896
- Est. tax owed @ 24.0%
- −$215
- After-tax cash flow
- $2,997/yr
For passive investors: Depreciation is non-cash, so a rental often shows a tax loss while cash-flowing — sheltering income. Rental losses are passive: they offset passive income freely, and up to $25,000/yr can offset ordinary (W-2) income if you actively participate and your MAGI is under $100k (phasing out to $0 by $150k); unused losses carry forward. On sale, claimed depreciation is recaptured at up to 25%, and gains may owe capital-gains tax (a 1031 exchange can defer both). Figures are a year-1 estimate at your 24.0% rate — not tax advice; consult a CPA.
Schools (NCES district)
- District
- Chichester SD
- NCES district ID
- 4205910
- Math proficiency
- 19% ▼ -12.00%
- Reading proficiency
- 41% ▼ -17.00%
- Median HH income
- $57,612
- Composite
- 26.84/100
- National rank
- #7110
- State rank
- #438 of 539 in PA
Livability — Linwood
- Score
- 79/100
- State rank
- #234
- US rank
- #2020
Category grades
Schools grade is shown separately in the Schools card above.
Census & demographics
- Census place
- Linwood, PA
- County
- Delaware County · 399,863 people
- City population
- 20,135
- Metro
- Philadelphia-Camden-Wilmington, PA-NJ-DE-MD
- Population (ZIP)
- 19,896
- Household income
- $82,005
- Rent vs Own
- Severe rent burden
- 612.0
Population outlook (Delaware County) Hauer SSP2
- Today (2025)
- 577,490 people
- By 2030
- 581,243 · +0.6%
- By 2040
- 584,700 · +1.2%
- By 2050
- 586,581 · +1.6%
- By 2075
- 598,706 · +3.7%
- By 2100
- 590,823 · +2.3%
Race, ethnicity, and origin ACS 2023
- Neighborhood character
- Predominantly White (74%)
- Race & ethnicity
- White 74% Black 11% Hispanic / Latino 5% Two or more races 5% Asian 4%
- Hispanic origin (detail)
- Mexican 1% Puerto Rican 2%
- Common ancestry
- Romanian 5% Subsaharan African 3% Polish 2%
- Foreign-born
- 8% · Canada, China, South Korea
- Languages at home
- 90% English-only · Spanish 3% Chinese 3% Other Indo-European 1%
Political lean MEDSL · Delaware
- 2024 margin
- Strong D (+23.7) · D 61.4% · R 37.6% · Other 1.0%
- 2008→2024 swing
- +2.3pp toward D · 2008: 21.4pp · 2024: 23.7pp
- All cycles
- 2024: D+23.7 2020: D+26.7 2016: D+22.0 2012: D+21.8 2008: D+21.4
Not yet ingested
- Civics
- —
Market trends
- HPI YoY
- ▼ -187.71%
- Current HPI
- 265.507
- Rent YoY
- ▲ 1.83%
- Metro
- Philadelphia-Camden-Wilmington, PA-NJ-DE-MD
- State GDP YoY
- ▲ 1.68%
- F500 in state
- 34
Industry mix (Fortune 500 HQ in PA)
| Industry | F500 HQs | Revenue |
|---|---|---|
| Healthcare | 2 | $309B |
|
||
| Insurance | 2 | $27B |
|
||
| Telecommunications / Media | 1 | $124B |
|
||
| Industrial Distribution | 1 | $22B |
|
||
| Financial Services | 1 | $20B |
|
||
| Chemicals / Materials | 1 | $18B |
|
||
Price history
+126.8% since first listed3 events — show timeline
- 2026-06-18 Listed $144,000 BRIGHT MLS
- 2026-06-18 Coming Soon $144,000 BRIGHT MLS
- 1993-06-24 Sold (Public Records) $63,500 Public Records
Property tax history
-7.2%/yrLatest (2026): $868 · -67.7% YoY. Source: county tax records.
Cash-flow waterfall
monthlySold comps — $/sqft
last 12 mo · ≤1 miLoading sold comps…