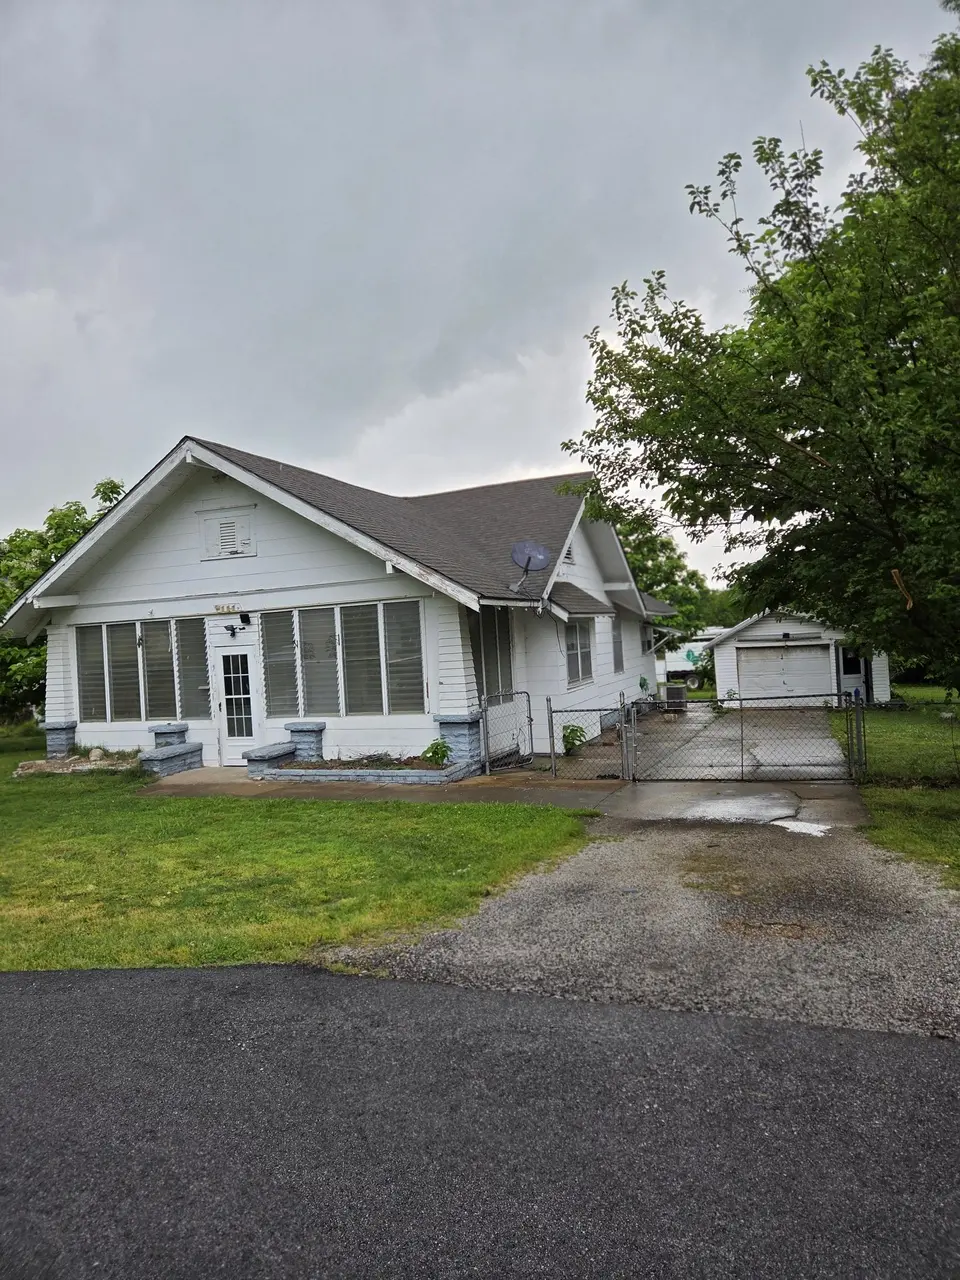
111 E Forest St · Bolivar, MO
Flood risk 1/10 · Minimal
- FEMA flood zone
- X (unshaded)
- Chance of flooding over 30 yrs
- 0.0%
- Est. flood insurance / yr
- $507 – $1,088
Fire risk 4/10 · Minor
- Est. fire insurance / yr
- $1,054 – $1,958
Heat risk 5/10 · Moderate
- Hot days now (above 107°F)
- 7 days/yr
- Hot days in 30 yrs
- 20 days/yr
Wind risk 2/10 · Minimal
- Chance of severe wind over 30 yrs
- 0.0%
Air-quality risk 1/10 · Minimal
- Unhealthy air days now
- 0 days/yr
- Unhealthy air days in 30 yrs
- 0 days/yr
Risk factors via First Street. Map © Google.
Why this score? — see what drove the B- grade
The composite is a weighted blend of 9 inputs, each scored 0–100. Each bar is that input's sub-score; the figure is the points it added to the 100-point composite (weight × sub-score).
- Cash flow +30.0/30.0
- DSCR +10.0/10.0
- 1% rule +8.0/10.0
- ARV discount +7.5/15.0
- Schools +3.8/10.0
- Livability +3.4/5.0
- Rent growth +2.5/5.0
- Condition / age +2.5/5.0
- Appreciation +0.0/10.0
$89,900
🖨 Deal sheet 📄 Offer letter ✓ Due diligence
Listing remarks
A UNIQUE HOME WITH LOTS OF CHARACTER. Large living and dining room with benches below the windows, wood floors, kitchen with stove and refrigerator, 2 bedrooms, one full bathroom and additional shower in utility room. 11x27 glassed in front porch and enclosed 7x14 back porch. Detached garage, fenced yard, convenient to hospital, Parkview and the park.
Key facts
- Enclosed back porch
- Wood floors
- Fenced yard
Tags
Property features AI
Exterior
- Parking: Private garage with 1 space
- Security: Storm door(s)
- Utilities: Public water; Public sewer
- Home design: Single-family residence; One story; Has a view; Located in Parkview Country subdivision
- Construction: Composition roof; Block foundation; Block basement
- Exterior features: Rain gutters; Chain link fencing; Enclosed, front and rear porches (glass enclosed)
Interior
- Kitchen: Electric oven; Free-standing electric oven; Refrigerator
- Flooring: Vinyl flooring; Wood flooring
- Bathrooms: One full bathroom; One half bathroom
- Heating & cooling: Central heating (electric, forced air); Central air conditioning; Ceiling fans
- Interior features: Laminate countertops; Window coverings, storm windows and blinds; Electric oven and refrigerator
- Laundry & utility: Laundry on main level; Unfinished partial basement with exterior entry (block foundation)
Neighborhood map
What this means for you Summary
Snapshot
- This is a 2-bed/2.5-bath other listed at $90k.
Deal economics
- At list price, monthly cash flow is $381 ($5k/yr) — positive.
- The deal already cash-flows at list — no discount required.
- Meets the 1% rule at list price ($1k rent vs $90k).
- Recommended offer: $87k (3.0% below list) — sets the bar for market timing.
- Cap rate 11.4% vs local median 3.0% in Bolivar — top-decile yield for the area; either an underpriced asset or a hidden risk that comps aren't pricing in. Stress-test before assuming the spread holds.
Location & tenants
- Location reads 67/100 on livability (#215 in MO) — a middle-class / working-renter tenant base. Strengths: cost of living A+, housing A+, crime A-; Watch: amenities F, commute F, employment D-.
- Bolivar R-I (town): math 42% / reading 48% proficiency, ranked #101 of 324 in MO (top 31%) — families likely to look elsewhere, expect single-tenant / working-renter base with shorter leases.
- Zoned schools: Bolivar Primary (589 students, 55% FRL); Bolivar Middle (math 37% / reading 44%, grade F, #180 of 391 statewide, top 47%, 601 students, 48% FRL); Bolivar High (math 42% / reading 63%, grade C-, #89 of 521 statewide, top 17%, 839 students, 42% FRL) — zoned schools at 48% FRL track the district average.
- Market conditions: 200 active listings in the ZIP; 5 comparable units currently listed for rent nearby; rentals lingering (median 44d on market — plan ~5-8 weeks vacancy on turnover, expect pricing pressure); 80% of comp listings sitting > 30 days — soft ceiling on asking rent; 188 units permitted in Polk County in 2024 (40 in 5+ unit buildings).
Forward outlook
- Local home prices are declining (-3.0%/yr); year-one equity from $622 of loan paydown is wiped out by about $3k of value loss. Plan a longer hold.
- At projected returns (-3.0% appreciation + 3.0% rent growth), your $25k cash investment doubles in ~7 years — after that, you're playing with house money.
Negotiation context
- It's been on market 31 days — a 3% lower offer ($87k) is reasonable based on typical stale-listing flexibility.
Risks & watch-outs
- Watch-outs: built in 1893 — expect roof / HVAC / electrical / plumbing capex.
- Climate carrying-cost: extreme-heat days projected 7→20/yr by 2055 (HVAC capex compounding) — expect insurance premiums to compound above CPI over the hold.
Questions for the listing agent
- It's been on market 31 days. Have you received any prior offers? Is the seller open to a 3% concession, seller financing, or rate buy-down credit?
- Built in 1893 — when were the roof, HVAC, electrical panel, plumbing, and water heater last replaced?
- Is there a deadline driving the sale (1031 exchange, divorce, estate, relocation)? That informs how much negotiation room exists.
- What's the average days-on-market for RENTAL listings here right now (not sales)? A rising rental-DOM trend means longer vacancies and softer asking-rent achievability than the comps imply.
- What's the recent tenant-quality profile in this submarket — average credit score on applications, eviction rate, late-payment / NSF rate, and stable-employment percentage? A property-management company in the area should have these aggregated.
- How much new for-sale + rental construction is in the pipeline within 1–3 miles? Heavy new supply typically softens prices + rents 12–24 months out; constrained supply supports both.
Investment metrics
- 1% rule
- 1.30% ✓
- Cap rate
- 11.38%
- Cash-on-cash
- 18.18%
- DSCR
- 1.81
- GRM
- 6.4
CMA / ARV
No comps found within radius.
Projected returns pro-forma
-3.0% appreciation · 3.0% rent growth · sell at horizon
- IRR
- 9.8%
- Equity multiple
- 1.38×
- Total profit
- $9,690
- Equity at exit
- $13,404
- IRR
- 18.9%
- Equity multiple
- 2.57×
- Total profit
- $39,582
- Equity at exit
- $7,773
Cash invested: $25,172 (down + closing). Projections, not guarantees.
Landlord ↔ Tenant lean methodology
- Overall (STATE)
- 81 Strongly Landlord-Friendly
- State Missouri
- 81 Strongly Landlord-Friendly · R+10
- County
- — inherits STATE
- City
- — inherits STATE
ZIP-level market 65613
- Home prices YoY
- -9.7%
- Active inventory
- 200
- Price-to-rent
- 6.4×
Monthly cashflow live
- Estimated rent
- $1,165 high interval (Pro) →
- Mortgage (P&I)
- −$471
- Tax from tax record
- −$30 /mo · $365/yr
- Insurance
- −$37
- HOA
- −$0
- Vacancy / Maint / Mgmt
- −$245
- Net cashflow
- $381
Break-even live
UW: 25.0% down · 7.5% · 30yr · 1.5% tax · 5.0% vac · 8.0% maint · 8.0% mgmt
Financing live
Cash to close
- Down payment
- $22,475
- Closing costs
- $2,697
- Reserves months
- —
- Total cash needed
- —
Loan-product check · same deal, 3 products live
Conventional
25% down · 7.5% · 30yr
- Down + closing
- —
- Monthly P&I
- —
- Monthly cashflow
- —
- DSCR
- —
- Eligible?
- —
Personal DTI + credit; lowest rate.
DSCR
20% down · 8.5% · 30yr
- Down + closing
- —
- Monthly P&I
- —
- Monthly cashflow
- —
- DSCR
- —
- Eligible?
- —
No personal income docs; deal must DSCR.
Hard money
10% down · 12.0% · 12mo
- Down + closing
- —
- Monthly P&I
- —
- Monthly cashflow
- —
- DSCR
- —
- Eligible?
- —
Short-term bridge; refi at stabilization.
Rent comps 5 comps
| Address | Beds | Baths | Sqft | Rent | $/sqft | DOM | Units | Dist |
|---|---|---|---|---|---|---|---|---|
| 521 E Summit St Bolivar, MO | 2.0 | 1.0 | 950 | $1,000 | $1.05 | 13d | 1 | 0.34mi |
| 725 E Vivian St Bolivar, MO | 3.0 | 2.0 | 1418 | $1,595 | $1.12 | 43d | 1 | 0.57mi |
| 715 E Vivian St Bolivar, MO | 3.0 | 2.0 | 1418 | $1,595 | $1.12 | 43d | 1 | 0.57mi |
| 740 E Forest St Bolivar, MO | 3.0 | 2.0 | 1418 | $1,795 | $1.27 | 43d | 1 | 0.86mi |
| 914 S Lillian Ave Unit 914 Bolivar, MO | 1.0 | 1.0 | 700 | $625 | $0.89 | 43d | 1 | 1.21mi |
Listing history 16 events
-
2026-06-18days on market $89,900 Active 31 DOM
-
2026-06-17days on market $89,900 Active 30 DOM
-
2026-06-16days on market $89,900 Active 29 DOM
-
2026-06-15days on market $89,900 Active 28 DOM
-
2026-06-14days on market $89,900 Active 26 DOM
-
2026-06-10days on market $89,900 Active 23 DOM
-
2026-06-09days on market $89,900 Active 22 DOM
-
2026-06-08days on market $89,900 Active 21 DOM
-
2026-06-07days on market $89,900 Active 20 DOM
-
2026-06-03days on market $89,900 Active 16 DOM
-
2026-06-02days on market $89,900 Active 15 DOM
-
2026-06-01days on market $89,900 Active 14 DOM
-
2026-05-31days on market $89,900 Active 13 DOM
-
2026-05-30days on market $89,900 Active 12 DOM
-
2026-05-18$89,900 Active
-
2024-10-15soldstatus
ⓘ Source: listings_history table (triggers on properties + properties_extension) + one-shot
backfill from property_details.listing_events for pre-trigger history.
Tax reassessment forecast MO · Resets to sale price
- Current annual tax
- $365 · $30/mo
- Projected year-2 tax
- $872 · $73/mo
- Expected delta
- +$507/yr (+$42/mo · 139.0%)
ⓘ Screening estimate from a state-policy table — verify with the county assessor before closing.
Climate risk First Street
- Flood 1/10 Low FEMA zone X (unshaded) · 0% chance over 30 yrs
- Wildfire 4/10 Moderate
- Heat 5/10 Major 7 d/yr ≥107°F today · 20 d/yr by 30 yrs out
- Wind 2/10 Low 0% chance of damaging wind over 30 yrs
- Air quality 1/10 Low 0 unhealthy d/yr today · 0 by 30 yrs out
Nearby sold comps map
Loading sold comps map…
Walkable amenities ~0.75 mi
Loading nearby amenities…
Taxation est. · year 1
- Rental income
- $13,985
- − Mortgage interest
- −$5,036
- − Property taxes
- −$365
- − Insurance
- −$450
- − Repairs & maintenance
- −$1,119
- − Management
- −$1,119
- − Depreciation
- −$2,615
- Taxable income
- $3,282
- Est. tax owed @ 24.0%
- −$788
- After-tax cash flow
- $3,789/yr
For passive investors: Depreciation is non-cash, so a rental often shows a tax loss while cash-flowing — sheltering income. Rental losses are passive: they offset passive income freely, and up to $25,000/yr can offset ordinary (W-2) income if you actively participate and your MAGI is under $100k (phasing out to $0 by $150k); unused losses carry forward. On sale, claimed depreciation is recaptured at up to 25%, and gains may owe capital-gains tax (a 1031 exchange can defer both). Figures are a year-1 estimate at your 24.0% rate — not tax advice; consult a CPA.
Schools (NCES district)
- District
- Bolivar R-I
- NCES district ID
- 2905370
- Math proficiency
- 42% ▼ -1.00%
- Reading proficiency
- 48% ▼ -2.00%
- Median HH income
- $40,332
- Composite
- 37.7/100
- National rank
- #4359
- State rank
- #101 of 324 in MO
Livability — Bolivar
- Score
- 67/100
- State rank
- #215
- US rank
- #10664
Category grades
Schools grade is shown separately in the Schools card above.
Census & demographics
- Census place
- Bolivar, MO
- County
- Polk County · 17,666 people
- City population
- 17,666
- Metro
- Springfield, MO
- Population (ZIP)
- 17,666
- Household income
- $59,172
- Rent vs Own
- Severe rent burden
- 328.0
Population outlook (Polk County) Hauer SSP2
- Today (2025)
- 31,229 people
- By 2030
- 31,227 · +-0.0%
- By 2040
- 31,104 · -0.4%
- By 2050
- 30,553 · -2.2%
- By 2075
- 29,332 · -6.1%
- By 2100
- 26,387 · -15.5%
Race, ethnicity, and origin ACS 2023
- Neighborhood character
- Predominantly White (92%)
- Race & ethnicity
- White 92% Two or more races 4% Hispanic / Latino 2% Black 1% Asian 1%
- Common ancestry
- Italian 3% Lithuanian 2% Slovak 2%
- Foreign-born
- 3% · Canada, China
- Languages at home
- 97% English-only · Spanish 1% German/W. Germanic 1% Chinese 1%
Political lean MEDSL · Polk
- 2024 margin
- Solid R (+61.6) · D 18.6% · R 80.2% · Other 1.1%
- 2008→2024 swing
- -29.5pp toward R · 2008: -32.1pp · 2024: -61.6pp
- All cycles
- 2024: R+61.6 2020: R+59.5 2016: R+56.9 2012: R+43.2 2008: R+32.1
Not yet ingested
- Civics
- —
Market trends
- HPI YoY
- ▼ -26.90%
- Current HPI
- 251.2475
- Rent YoY
- —
- Metro
- Springfield, MO
- State GDP YoY
- ▲ 1.84%
- F500 in state
- 20
Industry mix (Fortune 500 HQ in MO)
| Industry | F500 HQs | Revenue |
|---|---|---|
| Healthcare | 1 | $163B |
|
||
| Insurance | 1 | $21B |
|
||
| Industrial Technology | 1 | $17B |
|
||
| Retail | 1 | $16B |
|
||
| Industrial Distribution | 1 | $10B |
|
||
| Utilities | 1 | $9B |
|
||
Price history
2 events — show timeline
- 2026-05-18 Listed $89,900 SOMO
- 2024-10-15 Sold (Public Records) — Public Records
Property tax history
+1.7%/yrLatest (2025): $365 · +5.6% YoY. Source: county tax records.
Cash-flow waterfall
monthlySold comps — $/sqft
last 12 mo · ≤1 miLoading sold comps…