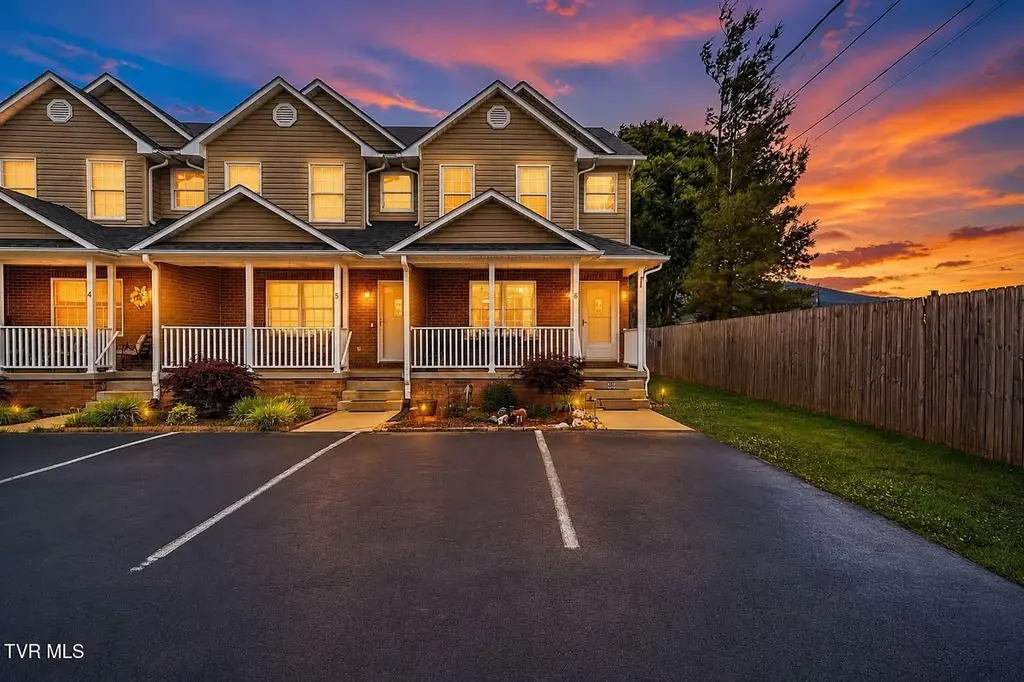
617 Highway 91 #6 · Hunter, TN
Flood risk 6/10 · Moderate
- FEMA flood zone
- X (unshaded)
- Chance of flooding over 30 yrs
- 0.73%
- Est. flood insurance / yr
- $507 – $1,088
Fire risk 3/10 · Minor
- Est. fire insurance / yr
- $949 – $1,763
Heat risk 4/10 · Minor
- Hot days now (above 98°F)
- 8 days/yr
- Hot days in 30 yrs
- 23 days/yr
Wind risk 2/10 · Minimal
- Chance of severe wind over 30 yrs
- —
Air-quality risk 2/10 · Minimal
- Unhealthy air days now
- 1 days/yr
- Unhealthy air days in 30 yrs
- 1 days/yr
Risk factors via First Street. Map © Google.
Why this score? — see what drove the C+ grade
The composite is a weighted blend of 9 inputs, each scored 0–100. Each bar is that input's sub-score; the figure is the points it added to the 100-point composite (weight × sub-score).
- Cash flow +29.2/30.0
- DSCR +10.0/10.0
- 1% rule +7.7/10.0
- ARV discount +7.5/15.0
- Livability +3.1/5.0
- Rent growth +2.5/5.0
- Condition / age +2.5/5.0
- Schools +1.6/10.0
- Appreciation +0.0/10.0
$219,900
🖨 Deal sheet 📄 Offer letter ✓ Due diligence
Listing remarks MLS
Get ready for turn-key living! This adorable townhome is nestled in Elizabethton across from the gorgeous waters of the Watauga River with a backdrop of East Tennessee mountains. Upon entering, you'll notice the large open living area, complete with a cozy fireplace. There is a half bath conveniently located on this first floor as well as a kitchen full of updated appliances. Upstairs you will find two large bedrooms with spacious closets, a full bathroom and the laundry room. Off the back of the home, you'll enjoy a peaceful, private, screened-in porch area as well as a second patio. With the landscaping and all exterior maintenance provided for you, your only job will be to relax!
Key facts
- New bosch dishwasher
- New roof
- Gas range
Tags
Property features AI
Finance
- Other: Subdivision: Carr Brothers
- HOA & community: Homeowners association with a $140 monthly fee
Exterior
- Utilities: Public water; Septic tank
- Home design: Townhouse; Condominium; Two levels; Updated/remodeled
- Construction: Aluminum siding, block, and brick construction
- Exterior features: Covered front and rear porches; Screened porch; Storm door(s); Back yard fencing; Shingle roof; Level topography; Has a view
Interior
- Kitchen: Dishwasher; Gas range; Microwave; Refrigerator
- Bedrooms: Total rooms: 5
- Flooring: Hardwood; Tile; Vinyl
- Bathrooms: 1 full bathroom; 1 half bathroom
- Heating & cooling: Heat pump for heating and cooling
- Interior features: Laminate counters; Pantry; Walk-in closet(s); Double pane windows; Gas-log fireplace in living room
- Laundry & utility: Washer hookup; Electric dryer hookup
Neighborhood map
What this means for you Summary
Snapshot
- This is a 2-bed/2.0-bath condo listed at $220k.
Deal economics
- At list price, monthly cash flow is $766 ($9k/yr) — positive.
- The deal already cash-flows at list — no discount required.
- Meets the 1% rule at list price ($3k rent vs $220k).
- Recommended offer: $217k (1.5% below list) — sets the bar for market timing.
- Cap rate 10.5% vs local median 3.1% in Hunter — top-decile yield for the area; either an underpriced asset or a hidden risk that comps aren't pricing in. Stress-test before assuming the spread holds.
Location & tenants
- Location reads 61/100 on livability (#258 in TN) — a middle-class / working-renter tenant base. Strengths: cost of living A+, housing A-, crime B+; Watch: amenities F, commute F, employment D-.
- Carter County (suburban): math 16% / reading 23% proficiency, ranked #119 of 139 in TN (top 86%) — low school quality limits family demand, transient renter base, plan for 1-2y turnover.
- Zoned schools: Hunter Elementary (math 15% / reading 21%, grade F, #697 of 952 statewide, top 74%, 433 students, 0% FRL); Unaka High School (math 12% / reading 32%, grade F, #163 of 332 statewide, top 51%, 315 students, 0% FRL) — zoned schools average 0% FRL vs 60% district-wide (60 pts lower); this property's tenant base skews higher-income than the district average.
- Market conditions: 173 active listings in the ZIP; 1 comparable units currently listed for rent nearby; 184 units permitted in Carter County in 2024 (0 in 5+ unit buildings).
Forward outlook
- Local home prices are declining (-3.0%/yr); year-one equity from $2k of loan paydown is wiped out by about $7k of value loss. Plan a longer hold.
- Carter County population projected at -21% by 2050 — secular population decline; favor cash flow + early exit over multi-decade hold.
- At projected returns (-3.0% appreciation + 3.0% rent growth), your $62k cash investment doubles in ~8 years — after that, you're playing with house money.
Negotiation context
- It's been on market 17 days — a 2% lower offer ($217k) is reasonable based on typical stale-listing flexibility.
- 4 sale attempts since 13y ago with the ask held roughly flat each time — persistent listings suggest the price (not the market) is what's stuck; bring a comps-based counter.
- Current owner paid $190k; 16% above their basis — modest negotiation headroom, anchor on the comps not their cost.
Risks & watch-outs
- Climate carrying-cost: major flood risk — expect insurance premiums to compound above CPI over the hold.
Questions for the listing agent
- What does the HOA fee cover, when was the last increase, and are there any pending special assessments or reserve-fund shortfalls?
- Any open or pending special assessments — roof, HVAC, plumbing, elevator, façade? What's the per-unit balance and payoff schedule, and is the seller paying it off at close or rolling it to the buyer?
- Is there a deadline driving the sale (1031 exchange, divorce, estate, relocation)? That informs how much negotiation room exists.
- Schools are F-rated, which usually means shorter tenancies and higher turnover. Who's the typical renter profile here, and what's been the actual vacancy rate?
- What's the average days-on-market for RENTAL listings here right now (not sales)? A rising rental-DOM trend means longer vacancies and softer asking-rent achievability than the comps imply.
- What's the recent tenant-quality profile in this submarket — average credit score on applications, eviction rate, late-payment / NSF rate, and stable-employment percentage? A property-management company in the area should have these aggregated.
- How much new apartment / multifamily construction is in the pipeline within 1–3 miles? Heavy new supply (>2% of stock underway) typically softens rents 12–24 months out; light construction supports rent growth.
Investment metrics
- 1% rule
- 1.27% ✓
- Cap rate
- 10.47%
- Cash-on-cash
- 14.93%
- DSCR
- 1.66
- GRM
- 6.5
CMA / ARV
No comps found within radius.
Projected returns pro-forma
-3.0% appreciation · 3.0% rent growth · sell at horizon
- IRR
- 5.5%
- Equity multiple
- 1.21×
- Total profit
- $13,163
- Equity at exit
- $32,788
- IRR
- 14.9%
- Equity multiple
- 2.21×
- Total profit
- $74,286
- Equity at exit
- $19,013
Cash invested: $61,572 (down + closing). Projections, not guarantees.
Landlord ↔ Tenant lean methodology
- Overall (STATE)
- 87 Strongly Landlord-Friendly
- State Tennessee
- 87 Strongly Landlord-Friendly · R+13
- County
- — inherits STATE
- City
- — inherits STATE
ZIP-level market 37643
- Home prices YoY
- -19.3%
- Active inventory
- 173
- Price-to-rent
- 6.5×
Monthly cashflow live
- Estimated rent
- $2,800 medium interval (Pro) →
- Mortgage (P&I)
- −$1,153
- Tax from tax record
- −$61 /mo · $732/yr
- Insurance
- −$92
- HOA
- −$140
- Vacancy / Maint / Mgmt
- −$588
- Net cashflow
- $766
Break-even live
UW: 25.0% down · 7.5% · 30yr · 1.5% tax · 5.0% vac · 8.0% maint · 8.0% mgmt
Financing live
Cash to close
- Down payment
- $54,975
- Closing costs
- $6,597
- Reserves months
- —
- Total cash needed
- —
Loan-product check · same deal, 3 products live
Conventional
25% down · 7.5% · 30yr
- Down + closing
- —
- Monthly P&I
- —
- Monthly cashflow
- —
- DSCR
- —
- Eligible?
- —
Personal DTI + credit; lowest rate.
DSCR
20% down · 8.5% · 30yr
- Down + closing
- —
- Monthly P&I
- —
- Monthly cashflow
- —
- DSCR
- —
- Eligible?
- —
No personal income docs; deal must DSCR.
Hard money
10% down · 12.0% · 12mo
- Down + closing
- —
- Monthly P&I
- —
- Monthly cashflow
- —
- DSCR
- —
- Eligible?
- —
Short-term bridge; refi at stabilization.
Rent comps 1 comps
| Address | Beds | Baths | Sqft | Rent | $/sqft | DOM | Units | Dist |
|---|---|---|---|---|---|---|---|---|
| 105 Bishop Hollow Rd Elizabethton, TN | 3.0 | 2.0 | 1760 | $2,800 | $1.59 | 13d | 1 | 1.25mi |
HOA detail condo
- Monthly dues
- $140 · $1,680/yr
- Likely covers
- waterlandscapingexterior maint.
- Assessments
- None detected in remarks — confirm with the listing agent.
Listing history 13 events
-
2026-06-19days on market $219,900 Active 17 DOM
-
2026-06-18days on market $219,900 Active 16 DOM
-
2026-06-17days on market $219,900 Active 15 DOM
-
2026-06-16days on market $219,900 Active 14 DOM
-
2026-06-15days on market $219,900 Active 13 DOM
-
2026-06-14days on market $219,900 Active 11 DOM
-
2026-06-13days on market $219,900 Active 10 DOM
-
2026-06-10pricedays on market $219,900 Active 8 DOM
-
2026-06-09days on market $224,900 Active 7 DOM
-
2026-06-08days on market $224,900 Active 6 DOM
-
2026-06-07days on market $224,900 Active 5 DOM
-
2026-06-03remarks 551-char remark
-
2026-06-03$224,900 Active 1 DOM
ⓘ Source: listings_history table (triggers on properties + properties_extension) + one-shot
backfill from property_details.listing_events for pre-trigger history.
Tax reassessment forecast TN · Resets to sale price
- Current annual tax
- $732 · $61/mo
- Projected year-2 tax
- $1,561 · $130/mo
- Expected delta
- +$829/yr (+$69/mo · 113.3%)
ⓘ Screening estimate from a state-policy table — verify with the county assessor before closing.
Climate risk First Street
- Flood 6/10 Major FEMA zone X (unshaded) · 73% chance over 30 yrs
- Wildfire 3/10 Moderate
- Heat 4/10 Moderate 8 d/yr ≥98°F today · 23 d/yr by 30 yrs out
- Wind 2/10 Low
- Air quality 2/10 Low 1 unhealthy d/yr today · 1 by 30 yrs out
Nearby sold comps map
Loading sold comps map…
Walkable amenities ~0.75 mi
Loading nearby amenities…
Taxation est. · year 1
- Rental income
- $33,600
- − Mortgage interest
- −$12,318
- − Property taxes
- −$732
- − Insurance
- −$1,100
- − Repairs & maintenance
- −$2,688
- − Management
- −$2,688
- − HOA
- −$1,680
- − Depreciation
- −$6,397
- Taxable income
- $5,998
- Est. tax owed @ 24.0%
- −$1,439
- After-tax cash flow
- $7,755/yr
For passive investors: Depreciation is non-cash, so a rental often shows a tax loss while cash-flowing — sheltering income. Rental losses are passive: they offset passive income freely, and up to $25,000/yr can offset ordinary (W-2) income if you actively participate and your MAGI is under $100k (phasing out to $0 by $150k); unused losses carry forward. On sale, claimed depreciation is recaptured at up to 25%, and gains may owe capital-gains tax (a 1031 exchange can defer both). Figures are a year-1 estimate at your 24.0% rate — not tax advice; consult a CPA.
Schools (NCES district)
- District
- Carter County
- NCES district ID
- 4700510
- Math proficiency
- 16% ▼ -19.00%
- Reading proficiency
- 23% ▼ -8.00%
- Median HH income
- $33,744
- Composite
- 15.92/100
- National rank
- #9253
- State rank
- #119 of 139 in TN
Livability — Hunter
- Score
- 61/100
- State rank
- #258
- US rank
- #18321
Category grades
Schools grade is shown separately in the Schools card above.
Census & demographics
- Census place
- Hunter, TN
- Population (ZIP)
- 33,690
Population outlook (Carter County) Hauer SSP2
- Today (2025)
- 54,493 people
- By 2030
- 52,639 · -3.4%
- By 2040
- 47,929 · -12.0%
- By 2050
- 42,877 · -21.3%
- By 2075
- 31,487 · -42.2%
- By 2100
- 21,979 · -59.7%
Race, ethnicity, and origin ACS 2023
- Neighborhood character
- Predominantly White (93%)
- Race & ethnicity
- White 93% Two or more races 3% Hispanic / Latino 3% Black 2%
- Common ancestry
- Serbian 3% Slovak 2% Italian 2%
- Foreign-born
- 2% · Canada
- Languages at home
- 98% English-only · Spanish 2%
Political lean MEDSL · Carter
- 2024 margin
- Solid R (+63.2) · D 17.9% · R 81.2%
- 2008→2024 swing
- -16.1pp toward R · 2008: -47.2pp · 2024: -63.2pp
- All cycles
- 2024: R+63.2 2020: R+61.5 2016: R+64.0 2012: R+52.0 2008: R+47.2
Not yet ingested
- Civics
- —
Market trends
- HPI YoY
- ▼ -77.08%
- Current HPI
- 321.4024
- Rent YoY
- —
- Metro
- —
- State GDP YoY
- ▲ 2.78%
- F500 in state
- 22
Industry mix (Fortune 500 HQ in TN)
| Industry | F500 HQs | Revenue |
|---|---|---|
| Healthcare | 3 | $91B |
|
||
| Retail | 3 | $72B |
|
||
| Transportation / Logistics | 1 | $88B |
|
||
| Paper / Packaging | 1 | $19B |
|
||
| Insurance | 1 | $13B |
|
||
| Energy | 1 | $12B |
|
||
Price history
+462.2% since first listed13 events — show timeline
- 2026-06-02 Listed $224,900 TVRMLS
- 2022-09-13 Sold (Public Records) $190,000 Public Records
- 2022-09-09 Sold (MLS) $190,000 TVRMLS
- 2022-07-23 Listed $186,000 TVRMLS
- 2020-08-26 Sold (Public Records) $126,500 Public Records
- 2020-08-26 Sold (MLS) $126,500 TVRMLS
- 2020-01-24 Listed $134,900 TVRMLS
- 2014-03-24 Sold (Public Records) $102,000 Public Records
- 2014-03-20 Sold (MLS) $102,000 TVRMLS
- 2013-10-02 Listed $109,900 TVRMLS
- 2006-03-31 Sold (Public Records) $87,000 Public Records
- 2004-04-13 Sold (Public Records) $85,000 Public Records
- 2003-05-19 Sold (Public Records) $40,000 Public Records
Property tax history
+0.9%/yrLatest (2025): $732 · +0.0% YoY. Source: county tax records.
Cash-flow waterfall
monthlySold comps — $/sqft
last 12 mo · ≤1 miLoading sold comps…