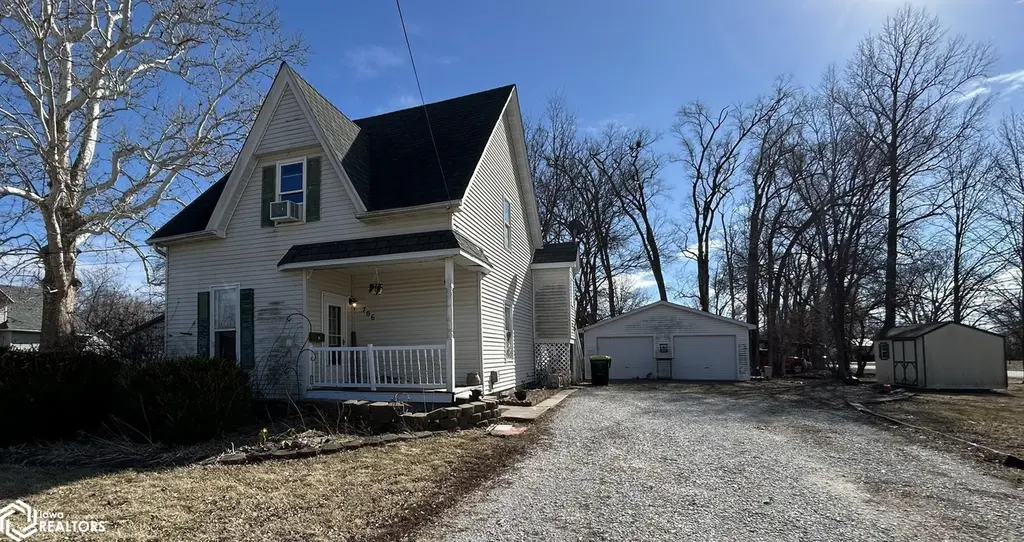
706 Augusta Rd · Carthage, IL
Flood risk 1/10 · Minimal
- FEMA flood zone
- X (unshaded)
- Chance of flooding over 30 yrs
- 0.0%
- Est. flood insurance / yr
- $473 – $860
Fire risk 1/10 · Minimal
- Est. fire insurance / yr
- $804 – $1,492
Heat risk 3/10 · Minor
- Hot days now (above 106°F)
- 7 days/yr
- Hot days in 30 yrs
- 17 days/yr
Wind risk 2/10 · Minimal
- Chance of severe wind over 30 yrs
- —
Air-quality risk 2/10 · Minimal
- Unhealthy air days now
- 0 days/yr
- Unhealthy air days in 30 yrs
- 1 days/yr
Risk factors via First Street. Map © Google.
Why this score? — see what drove the B+ grade
The composite is a weighted blend of 9 inputs, each scored 0–100. Each bar is that input's sub-score; the figure is the points it added to the 100-point composite (weight × sub-score).
- Cash flow +30.0/30.0
- ARV discount +15.0/15.0
- 1% rule +10.0/10.0
- DSCR +10.0/10.0
- Livability +3.6/5.0
- Rent growth +2.5/5.0
- Schools +2.5/10.0
- Condition / age +2.5/5.0
- Appreciation +0.0/10.0
$74,900
🖨 Deal sheet (PDF) 📄 Offer letter ✓ Due diligence
Listing remarks
An exceptional opportunity awaits with this 4 bedroom, 2 bath home situated in a desirable neighborhood. Offering remarkable potential, this property presents the perfect canvas for a refined renovation or investment property. The main level features two bedrooms, a full bath, and the convenience of main floor laundry. Upstairs, you will find two additional bedrooms and a second full bath, providing ample space for family living or rental flexibility. New roof in 2017 and new water heater in 2020.
Key facts
- Main floor laundry
- New water heater
- New roof
Tags
Property features AI
Exterior
- Parking: Detached 2-car garage
- Utilities: Public water; Public sewer
- Home design: Single-family residence; One and one-half stories
- Construction: Vinyl siding
- Exterior features: Gravel parking areas; Lot approximately 106.83 x 126 (units listed as acres)
Interior
- Bathrooms: 1 full bathroom; 1 three-quarter bathroom
- Heating & cooling: Central air conditioning; Forced air heating
- Interior features: Basement present
Neighborhood map
What this means for you Summary
Snapshot
- This is a 4-bed/2.0-bath single-family listed at $75k.
Deal economics
- At list price, monthly cash flow is $362 ($4k/yr) — positive.
- The deal already cash-flows at list — no discount required.
- Meets the 1% rule at list price ($1k rent vs $75k).
- Recommended offer: $70k (6.0% below list) — sets the bar for market timing.
Location & tenants
- Location reads 72/100 on livability (#306 in IL) — a middle-class / working-renter tenant base. Strengths: crime A+, cost of living A+, housing A+; Watch: health & safety C-, amenities F, commute F.
- Illini West H S District 307 (town): math 25% / reading 25% proficiency, ranked #611 of 919 in IL (top 66%) — low school quality limits family demand, transient renter base, plan for 1-2y turnover.
- Market conditions: 22 active listings in the ZIP.
Forward outlook
- Local home prices are declining (-3.0%/yr); year-one equity from $518 of loan paydown is wiped out by about $2k of value loss. Plan a longer hold.
- Hancock County population projected at -30% by 2050 — secular population decline; favor cash flow + early exit over multi-decade hold.
- At projected returns (-3.0% appreciation + 3.0% rent growth), your $21k cash investment doubles in ~6 years — after that, you're playing with house money.
Negotiation context
- It's been on market 74 days — a 6% lower offer ($70k) is reasonable based on typical stale-listing flexibility.
Risks & watch-outs
- Watch-outs: property tax is 2.8% of price; built in 1910 — expect roof / HVAC / electrical / plumbing capex.
Questions for the listing agent
- It's been on market 74 days. Have you received any prior offers? Is the seller open to a 6% concession, seller financing, or rate buy-down credit?
- Built in 1910 — when were the roof, HVAC, electrical panel, plumbing, and water heater last replaced?
- Property tax is high relative to price — has the assessment been appealed recently, and will the sale trigger a re-assessment?
- Why hasn't it sold? Are there any deal-killer items the seller is aware of (foundation, flood, title, zoning, code violations)?
- Is there a deadline driving the sale (1031 exchange, divorce, estate, relocation)? That informs how much negotiation room exists.
- What's the average days-on-market for RENTAL listings here right now (not sales)? A rising rental-DOM trend means longer vacancies and softer asking-rent achievability than the comps imply.
- What's the recent tenant-quality profile in this submarket — average credit score on applications, eviction rate, late-payment / NSF rate, and stable-employment percentage? A property-management company in the area should have these aggregated.
- How much new for-sale + rental construction is in the pipeline within 1–3 miles? Heavy new supply typically softens prices + rents 12–24 months out; constrained supply supports both.
Investment metrics
- 1% rule
- 1.62% ✓
- Cap rate
- 12.09%
- Cash-on-cash
- 20.72%
- DSCR
- 1.92
- GRM
- 5.1
CMA / ARV
- ARV (on-the-fly)
- $135,564
- Comps found
- 7
Show comp detail 7 sales within ~0.75 mi
| Address | Dist | Beds/Ba | Sqft | Sold | Price | $/sf | Match |
|---|---|---|---|---|---|---|---|
| 710 Country Ln | 0.13mi | 3/2.0 (-1) | 1,608 (-6%) | 1mo | $127,500 | $79 | 78 |
| 825 Augusta Rd | 0.17mi | 3/2.0 (-1) | 1,571 (-8%) | 6mo | $125,000 | $80 | 68 |
| 20 Randolph | 0.67mi | 3/2.0 (-1) | 1,784 (+4%) | 7mo | $185,000 | $104 | 52 |
| 228 Wabash Ave | 0.53mi | 3/1.5 (-1) | 1,863 (+9%) | 18mo | $62,000 | $33 | 39 |
| 260 S Marion | 0.32mi | 3/1.0 (-1) | 1,460 (-15%) | 22mo | $72,000 | $49 | 33 |
| 237 N Marion | 0.69mi | 4/1.5 | 1,960 (+14%) | 11mo | $147,900 | $75 | 32 |
| 200 Dallas Rd | 0.73mi | 3/1.5 (-1) | 1,522 (-11%) | 12mo | $148,000 | $97 | 30 |
Match score weights: distance 35% · size 25% · config 20% · recency 20%. Top-matched comps best support the ARV.
Projected returns pro-forma
-3.0% appreciation · 3.0% rent growth · sell at horizon
- IRR
- 13.1%
- Equity multiple
- 1.52×
- Total profit
- $10,990
- Equity at exit
- $11,168
- IRR
- 22.0%
- Equity multiple
- 2.89×
- Total profit
- $39,535
- Equity at exit
- $6,476
Cash invested: $20,972 (down + closing). Projections, not guarantees.
Landlord ↔ Tenant lean methodology
- Overall (STATE)
- 43 Moderately Tenant-Leaning
- State Illinois
- 43 Moderately Tenant-Leaning · D+7
- County
- — inherits STATE
- City
- — inherits STATE
ZIP-level market 62321
- Home prices YoY
- -17.9%
- Active inventory
- 22
- Price-to-rent
- 5.1×
Monthly cashflow live
- Estimated rent
- $1,214 medium interval (Pro) →
- Mortgage (P&I)
- −$393
- Tax from tax record
- −$173 /mo · $2,074/yr
- Insurance
- −$31
- HOA
- −$0
- Vacancy / Maint / Mgmt
- −$255
- Net cashflow
- $362
Break-even live
Sensitivity live
| Price | -10% $404 | -5% $383 | +0% $362 | +5% $341 | +10% $320 |
|---|---|---|---|---|---|
| Rent | -10% $266 | -5% $314 | +0% $362 | +5% $410 | +10% $458 |
| Rate | -1.0pp $400 | -0.5pp $381 | base $362 | +0.5pp $343 | +1.0pp $323 |
UW: 25.0% down · 7.5% · 30yr · 1.5% tax · 5.0% vac · 8.0% maint · 8.0% mgmt
Financing live
Cash to close
- Down payment
- $18,725
- Closing costs
- $2,247
- Reserves months
- —
- Total cash needed
- —
Loan-product check · same deal, 3 products live
Conventional
25% down · 7.5% · 30yr
- Down + closing
- —
- Monthly P&I
- —
- Monthly cashflow
- —
- DSCR
- —
- Eligible?
- —
Personal DTI + credit; lowest rate.
DSCR
20% down · 8.5% · 30yr
- Down + closing
- —
- Monthly P&I
- —
- Monthly cashflow
- —
- DSCR
- —
- Eligible?
- —
No personal income docs; deal must DSCR.
Hard money
10% down · 12.0% · 12mo
- Down + closing
- —
- Monthly P&I
- —
- Monthly cashflow
- —
- DSCR
- —
- Eligible?
- —
Short-term bridge; refi at stabilization.
Listing history 20 events
-
2026-06-19days on market $74,900 Active 74 DOM
-
2026-06-18days on market $74,900 Active 73 DOM
-
2026-06-17days on market $74,900 Active 72 DOM
-
2026-06-16days on market $74,900 Active 71 DOM
-
2026-06-15days on market $74,900 Active 70 DOM
-
2026-06-14days on market $74,900 Active 68 DOM
-
2026-06-12days on market $74,900 Active 67 DOM
-
2026-06-09days on market $74,900 Active 64 DOM
-
2026-06-08days on market $74,900 Active 63 DOM
-
2026-06-07days on market $74,900 Active 62 DOM
-
2026-06-07days on market $74,900 Active 61 DOM
-
2026-06-03days on market $74,900 Active 58 DOM
-
2026-06-02days on market $74,900 Active 57 DOM
-
2026-06-01days on market $74,900 Active 56 DOM
-
2026-05-31days on market $74,900 Active 55 DOM
-
2026-05-30days on market $74,900 Active 54 DOM
-
2026-04-07$74,900 Active
-
2022-09-27historical
-
2017-05-25soldstatus $75,900
-
2011-07-02historical
ⓘ Source: listings_history table (triggers on properties + properties_extension) + one-shot
backfill from property_details.listing_events for pre-trigger history.
Tax reassessment forecast IL · Partial reset (capped growth)
- Current annual tax
- $2,074 · $173/mo
- Projected year-2 tax
- $2,074 · $173/mo
- Expected delta
- $0/yr ($0/mo · 0.0%)
ⓘ Screening estimate from a state-policy table — verify with the county assessor before closing.
Climate risk First Street
- Flood 1/10 Low FEMA zone X (unshaded) · 0% chance over 30 yrs
- Wildfire 1/10 Low
- Heat 3/10 Moderate 7 d/yr ≥106°F today · 17 d/yr by 30 yrs out
- Wind 2/10 Low
- Air quality 2/10 Low 0 unhealthy d/yr today · 1 by 30 yrs out
Nearby sold comps map
Loading sold comps map…
Walkable amenities ~0.75 mi
Loading nearby amenities…
Taxation est. · year 1
- Rental income
- $14,565
- − Mortgage interest
- −$4,196
- − Property taxes
- −$2,074
- − Insurance
- −$374
- − Repairs & maintenance
- −$1,165
- − Management
- −$1,165
- − Depreciation
- −$2,179
- Taxable income
- $3,412
- Est. tax owed @ 24.0%
- −$819
- After-tax cash flow
- $3,526/yr
For passive investors: Depreciation is non-cash, so a rental often shows a tax loss while cash-flowing — sheltering income. Rental losses are passive: they offset passive income freely, and up to $25,000/yr can offset ordinary (W-2) income if you actively participate and your MAGI is under $100k (phasing out to $0 by $150k); unused losses carry forward. On sale, claimed depreciation is recaptured at up to 25%, and gains may owe capital-gains tax (a 1031 exchange can defer both). Figures are a year-1 estimate at your 24.0% rate — not tax advice; consult a CPA.
Schools (NCES district)
- District
- Illini West H S District 307
- NCES district ID
- 1701384
- Math proficiency
- 25% ▲ 5.00%
- Reading proficiency
- 25% ▲ 5.00%
- Median HH income
- $47,745
- Composite
- 24.88/100
- National rank
- #12997
- State rank
- #611 of 919 in IL
Livability — Carthage
- Score
- 72/100
- State rank
- #306
- US rank
- #6009
Category grades
Schools grade is shown separately in the Schools card above.
Census & demographics
- Census place
- Carthage, IL
- Population (ZIP)
- 3,682
Population outlook (Hancock County) Hauer SSP2
- Today (2025)
- 17,042 people
- By 2030
- 16,056 · -5.8%
- By 2040
- 13,912 · -18.4%
- By 2050
- 11,879 · -30.3%
- By 2075
- 8,302 · -51.3%
- By 2100
- 5,846 · -65.7%
Race, ethnicity, and origin ACS 2023
- Neighborhood character
- Predominantly White (92%)
- Race & ethnicity
- White 92% Hispanic / Latino 4% Two or more races 4%
- Common ancestry
- Lithuanian 2% Portuguese 2% Slovak 1%
- Foreign-born
- 4% · Canada
- Languages at home
- 95% English-only · Spanish 4%
Political lean MEDSL · Hancock
- 2024 margin
- Solid R (+50.0) · D 24.1% · R 74.1% · Other 1.8%
- 2008→2024 swing
- -39.2pp toward R · 2008: -10.8pp · 2024: -50.0pp
- All cycles
- 2024: R+50.0 2020: R+48.9 2016: R+50.8 2012: R+19.0 2008: R+10.8
Not yet ingested
- Civics
- —
Market trends
- HPI YoY
- ▼ -28.17%
- Current HPI
- 129.3847
- Rent YoY
- —
- Metro
- —
- State GDP YoY
- ▲ 1.59%
- F500 in state
- 60
Industry mix (Fortune 500 HQ in IL)
| Industry | F500 HQs | Revenue |
|---|---|---|
| Insurance | 4 | $201B |
|
||
| Consumer Goods | 4 | $87B |
|
||
| Industrial Machinery | 3 | $64B |
|
||
| Healthcare | 2 | $55B |
|
||
| Retail / Pharmacy | 1 | $148B |
|
||
| Agriculture / Food | 1 | $86B |
|
||
Price history
-1.3% since first listed4 events — show timeline
- 2026-04-07 Listed $74,900 IAR
- 2022-09-27 Listing Removed — RMLSA as Distributed by MLS Grid
- 2017-05-25 Sold (Public Records) $75,900 Public Records
- 2011-07-02 Listing Removed — MRED as Distributed by MLS Grid
Property tax history
-0.3%/yrLatest (2024): $2,074 · +10.6% YoY. Source: county tax records.
Cash-flow waterfall
monthlySold comps — $/sqft
last 12 mo · ≤1 miLoading sold comps…