 🏗️ New Construction
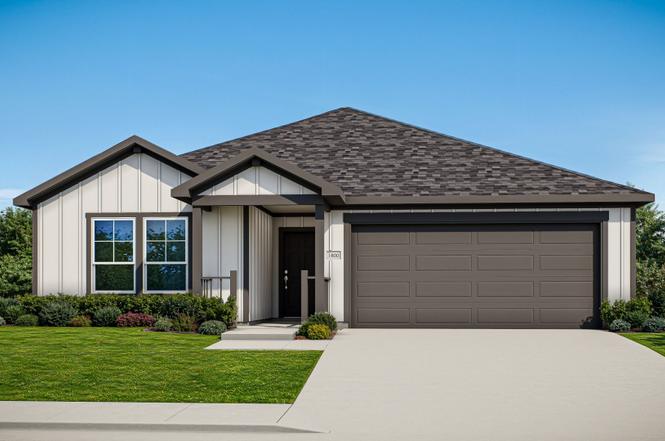
Driskill Plan · Josephine, TX
Flood risk 1/10 · Minimal
- FEMA flood zone
- X (unshaded)
- Chance of flooding over 30 yrs
- 0.0%
- Est. flood insurance / yr
- $507 – $1,088
Fire risk 3/10 · Minor
- Est. fire insurance / yr
- $1,222 – $2,270
Heat risk 8/10 · Major
- Hot days now (above 110°F)
- 7 days/yr
- Hot days in 30 yrs
- 23 days/yr
Wind risk 6/10 · Moderate
- Chance of severe wind over 30 yrs
- 27.0%
Air-quality risk 2/10 · Minimal
- Unhealthy air days now
- 1 days/yr
- Unhealthy air days in 30 yrs
- 1 days/yr
Risk factors via First Street. Map © Google.
Why this score? — see what drove the D- grade
The composite is a weighted blend of 9 inputs, each scored 0–100. Each bar is that input's sub-score; the figure is the points it added to the 100-point composite (weight × sub-score).
- Appreciation +10.0/10.0
- ARV discount +7.5/15.0
- Cash flow +6.9/30.0
- Condition / age +4.0/5.0
- Schools +3.2/10.0
- Livability +3.0/5.0
- Rent growth +2.5/5.0
- 1% rule +1.8/10.0
- DSCR +1.1/10.0
$274,990
🖨 Deal sheet 📄 Offer letter ✓ Due diligence
Listing remarks
Spacious and thoughtfully designed, the Driskill offers single-story ease with room for everyone to feel right at home. From the moment you step inside, you'll notice the natural flow of the open-concept layout, where the kitchen, dining area, and great room come together in one beautifully cohesive space. Whether you're enjoying quiet evenings or entertaining friends and family, this central hub of the home makes everyday living feel effortless. A central flex room enhances the home's versatility and can be optioned as a private study or a fourth bedroom - allowing you to tailor the space to your lifestyle. The private primary suite is tucked at the rear of the home, offering a quiet retre
Key facts
- Central flex room
- Covered patio
- Open-concept layout
Tags
Neighborhood map
What this means for you Summary
Snapshot
- This is a 3-bed/2.0-bath single-family listed at $275k. Condition is rated good.
Deal economics
- At list price, monthly cash flow is $-513 ($-6k/yr) — negative.
- To cash-flow at today's rent, offer at most $261k (5.0% below list).
- To meet the 1% rule (rent ≥ 1% of price), the offer needs to be $228k (16.9% below list).
- Recommended offer: $228k (16.9% below list) — sets the bar for 1% rule.
Location & tenants
- Location reads 60/100 on livability (#1,076 in TX) — a middle-class / working-renter tenant base. Strengths: cost of living A+, housing A+, crime A-; Watch: schools F, amenities F, commute F.
- Community ISD (rural): math 30% / reading 38% proficiency, ranked #479 of 826 in TX (top 58%) — families likely to look elsewhere, expect single-tenant / working-renter base with shorter leases.
- Market conditions: 421 active listings in the ZIP; 21 comparable units currently listed for rent nearby; rentals leasing fast (median 10d on market — plan ~1-2 weeks tenant-placement turnaround); 19,194 units permitted in Collin County in 2024 (3,988 in 5+ unit buildings).
Forward outlook
- In year one you build about $36k of equity ($2k loan paydown + $34k appreciation (10.0% local appreciation)).
- Collin County population projected at +60% by 2050 — long-run rental-demand tailwind backs the buy-and-hold thesis.
- By year 2, paydown + projected appreciation supports a ~$58k cash-out refi (75% LTV) — recoverable capital for the next deal without selling this one.
Negotiation context
- Only 4 days on market — expect competitive offers; lowballing is unlikely to land.
Risks & watch-outs
- Climate carrying-cost: major wind risk, 27% chance of damaging wind over 30y; extreme-heat days projected 7→23/yr by 2055 (HVAC capex compounding) — expect insurance premiums to compound above CPI over the hold.
Questions for the listing agent
- What do current leases actually rent for vs. the listed asking? Can we see a recent rent roll and the last 12 months of T-12 income?
- Is there a deadline driving the sale (1031 exchange, divorce, estate, relocation)? That informs how much negotiation room exists.
- Schools are F-rated, which usually means shorter tenancies and higher turnover. Who's the typical renter profile here, and what's been the actual vacancy rate?
- The area grade is low — what's the realistic commute time and amenity access for the typical tenant pool here? Any planned neighborhood developments (good or bad) we should know about?
- What's the average days-on-market for RENTAL listings here right now (not sales)? A rising rental-DOM trend means longer vacancies and softer asking-rent achievability than the comps imply.
- What's the recent tenant-quality profile in this submarket — average credit score on applications, eviction rate, late-payment / NSF rate, and stable-employment percentage? A property-management company in the area should have these aggregated.
- How much new for-sale + rental construction is in the pipeline within 1–3 miles? Heavy new supply typically softens prices + rents 12–24 months out; constrained supply supports both.
Investment metrics
- 1% rule
- 0.68% ✗
- Cap rate
- 4.46%
- Cash-on-cash
- -6.55%
- DSCR
- 0.71
- GRM
- 12.2
CMA / ARV
- ARV (median comp)
- $335,382
- List price
- $274,990
- Delta
- -18.01%
- Verdict
- UNDERPRICED
- Comps
- 20 within 1.0 mi
Show comp detail 5 sales within ~0.75 mi
| Address | Dist | Beds/Ba | Sqft | Sold | Price | $/sf | Match |
|---|---|---|---|---|---|---|---|
| 201 East St | 0.61mi | 4/2.0 (+1) | 1,860 (+3%) | 11mo | $374,999 | $202 | 52 |
| 104 Milton St | 0.51mi | 4/2.0 (+1) | 1,604 (-11%) | 7mo | $247,500 | $154 | 47 |
| 104 Swallowtail | 0.65mi | 4/2.0 (+1) | 1,800 (0%) | 23mo | $378,500 | $210 | 45 |
| 101 Monarch | 0.56mi | 4/2.0 (+1) | 1,876 (+4%) | 21mo | $372,700 | $199 | 44 |
| 204 Swallowtail Ln | 0.68mi | 4/2.0 (+1) | 1,750 (-3%) | 18mo | $325,000 | $186 | 43 |
Match score weights: distance 35% · size 25% · config 20% · recency 20%. Top-matched comps best support the ARV.
Projected returns pro-forma
10.0% appreciation · 3.0% rent growth · sell at horizon
- IRR
- 19.7%
- Equity multiple
- 2.60×
- Total profit
- $150,038
- Equity at exit
- $302,139
- IRR
- 18.0%
- Equity multiple
- 5.98×
- Total profit
- $467,585
- Equity at exit
- $651,574
Cash invested: $93,907 (down + closing). Projections, not guarantees.
Landlord ↔ Tenant lean methodology
- Overall (STATE)
- 87 Strongly Landlord-Friendly
- State Texas
- 87 Strongly Landlord-Friendly · R+5
- County
- — inherits STATE
- City
- — inherits STATE
ZIP-level market 75173
- Home prices YoY
- 3.1%
- Active inventory
- 421
- Price-to-rent
- 10.0×
Monthly cashflow live
- Estimated rent
- $2,285 high interval (Pro) →
- Mortgage (P&I)
- −$1,759
- Tax est. 1.5%
- −$419 /mo · $5,031/yr
- Insurance
- −$140
- HOA
- −$0
- Vacancy / Maint / Mgmt
- −$480
- Net cashflow
- $-513
Break-even live
UW: 25.0% down · 7.5% · 30yr · 1.5% tax · 5.0% vac · 8.0% maint · 8.0% mgmt
Financing live
Cash to close
- Down payment
- $83,846
- Closing costs
- $10,061
- Reserves months
- —
- Total cash needed
- —
Loan-product check · same deal, 3 products live
Conventional
25% down · 7.5% · 30yr
- Down + closing
- —
- Monthly P&I
- —
- Monthly cashflow
- —
- DSCR
- —
- Eligible?
- —
Personal DTI + credit; lowest rate.
DSCR
20% down · 8.5% · 30yr
- Down + closing
- —
- Monthly P&I
- —
- Monthly cashflow
- —
- DSCR
- —
- Eligible?
- —
No personal income docs; deal must DSCR.
Hard money
10% down · 12.0% · 12mo
- Down + closing
- —
- Monthly P&I
- —
- Monthly cashflow
- —
- DSCR
- —
- Eligible?
- —
Short-term bridge; refi at stabilization.
Rent comps 21 comps
| Address | Beds | Baths | Sqft | Rent | $/sqft | DOM | Units | Dist |
|---|---|---|---|---|---|---|---|---|
| 464 N Greenville St Farmersville, TX | 3.0 | 2.0 | 2000 | $3,000 | $1.50 | 1d | 1 | 0.22mi |
| 6135 FM 547 Farmersville, TX | 4.0 | 2.5 | 1771 | $2,295 | $1.30 | 24d | 1 | 0.74mi |
| 306 E Cook St Josephine, TX | 3.0 | 2.0 | 1817 | $2,100 | $1.16 | 1d | 1 | 0.91mi |
| 319 Plum Dr Nevada, TX | 4.0 | 2.0 | 1587 | $1,899 | $1.20 | 10d | 1 | 1.12mi |
| 315 Pine Hollow Way Josephine, TX | 4.0 | 3.0 | 2212 | $2,300 | $1.04 | 7d | 1 | 1.13mi |
| 1413 Brook Ln Caddo Mills, TX | 4.0 | 2.0 | 1572 | $1,925 | $1.22 | 12d | 1 | 1.19mi |
| 1413 Brook Ln Caddo Mills, TX | 4.0 | 2.0 | 1572 | $1,925 | $1.22 | 10d | 1 | 1.19mi |
| 802 Turnbuckle Ct Royse City, TX | 4.0 | 2.0 | 1577 | $1,849 | $1.17 | 43d | 1 | 1.25mi |
| 722 Windmill St Josephine, TX | 4.0 | 2.0 | 1568 | $2,190 | $1.40 | 1d | 1 | 1.28mi |
| 1141 Northfield Dr Caddo Mills, TX | 3.0 | 2.0 | 1280 | $1,725 | $1.35 | 43d | 1 | 1.29mi |
| 800 Windmill St Josephine, TX | 4.0 | 2.0 | 1843 | $2,100 | $1.14 | 7d | 1 | 1.31mi |
| 801 Meadow Creek Ln Josephine, TX | 4.0 | 2.0 | 1757 | $2,500 | $1.42 | 4d | 1 | 1.31mi |
| 1165 Northfield Dr Caddo Mills, TX | 3.0 | 2.0 | 1280 | $1,595 | $1.25 | 10d | 1 | 1.33mi |
| 601 Barlow Dr Caddo Mills, TX | 4.0 | 3.0 | 2090 | $2,075 | $0.99 | 43d | 1 | 1.34mi |
| 717 Cottonwood WAY Josephine, TX | 4.0 | 3.0 | 2073 | $2,125 | $1.03 | 1d | 1 | 1.36mi |
| 813 Cottonwood Way Royse City, TX | 4.0 | 3.0 | 2347 | $2,350 | $1.00 | 12d | 1 | 1.43mi |
| 311 Milo Way Royse City, TX | 4.0 | 2.0 | 2074 | $2,200 | $1.06 | 6d | 1 | 1.43mi |
| 304 Red Stream Way Caddo Mills, TX | 3.0 | 2.0 | 1476 | $1,800 | $1.22 | 18d | 1 | 1.44mi |
| 1208 Riverbrook Ln Caddo Mills, TX | 4.0 | 3.0 | 2088 | $2,095 | $1.00 | 43d | 1 | 1.45mi |
| 305 Silo Cir Royse City, TX | 4.0 | 2.0 | 2074 | $2,100 | $1.01 | 24d | 1 | 1.48mi |
| 1216 Riverbrook Ln Caddo Mills, TX | 3.0 | 2.0 | 1617 | $2,000 | $1.24 | 1d | 1 | 1.48mi |
Listing history 2 events
-
2026-06-18statusdays on market $274,990 Active 4 DOM
-
2026-05-15$274,990 Active 1298-char remark
ⓘ Source: listings_history table (triggers on properties + properties_extension) + one-shot
backfill from property_details.listing_events for pre-trigger history.
Climate risk First Street
- Flood 1/10 Low FEMA zone X (unshaded) · 0% chance over 30 yrs
- Wildfire 3/10 Moderate
- Heat 8/10 Severe 7 d/yr ≥110°F today · 23 d/yr by 30 yrs out
- Wind 6/10 Major 27% chance of damaging wind over 30 yrs
- Air quality 2/10 Low 1 unhealthy d/yr today · 1 by 30 yrs out
Nearby sold comps map
Loading sold comps map…
Walkable amenities ~0.75 mi
Loading nearby amenities…
Taxation est. · year 1
- Rental income
- $27,418
- − Mortgage interest
- −$18,787
- − Property taxes
- −$5,031
- − Insurance
- −$1,677
- − Repairs & maintenance
- −$2,193
- − Management
- −$2,193
- − Depreciation
- −$9,757
- Taxable loss
- −$12,219
- Est. tax savings @ 24.0%
- +$2,933
- After-tax cash flow
- $-3,220/yr
For passive investors: Depreciation is non-cash, so a rental often shows a tax loss while cash-flowing — sheltering income. Rental losses are passive: they offset passive income freely, and up to $25,000/yr can offset ordinary (W-2) income if you actively participate and your MAGI is under $100k (phasing out to $0 by $150k); unused losses carry forward. On sale, claimed depreciation is recaptured at up to 25%, and gains may owe capital-gains tax (a 1031 exchange can defer both). Figures are a year-1 estimate at your 24.0% rate — not tax advice; consult a CPA.
Condition & rehab AI · 3 photos
This single-story home is in excellent condition with no visible repairs needed. It offers a spacious and well-designed layout, making it an attractive option for both buyers and renters.
Value-add opportunities
- Both Painting exterior and interior walls — Fresh paint enhances curb appeal and interior aesthetics
- Both Landscaping improvements — Enhances curb appeal and adds value
- Both Kitchen and bathroom updates — Modernizing these spaces can attract more buyers/renters
Renovation cost estimate screening
Value-add ROI direction
- Both Painting exterior and interior walls — Fresh paint enhances curb appeal and interior aesthetics ↑
- Both Landscaping improvements — Enhances curb appeal and adds value ↑
- Both Kitchen and bathroom updates — Modernizing these spaces can attract more buyers/renters ↑
ⓘ Cost ranges are severity-bucket heuristics (US national rule-of-thumb). Get contractor quotes + a written scope before underwriting a rehab budget.
Schools (NCES district)
- District
- Community ISD
- NCES district ID
- 4814850
- Math proficiency
- 30% ▼ -23.00%
- Reading proficiency
- 38% ▼ -11.00%
- Median HH income
- $71,841
- Composite
- 31.58/100
- National rank
- #5951
- State rank
- #479 of 826 in TX
Livability — Josephine
- Score
- 60/100
- State rank
- #1076
- US rank
- #19105
Category grades
Schools grade is shown separately in the Schools card above.
Census & demographics
- Census place
- Josephine, TX
- Population (ZIP)
- 9,284
Population outlook (Collin County) Hauer SSP2
- Today (2025)
- 1,210,074 people
- By 2030
- 1,358,201 · +12.2%
- By 2040
- 1,654,061 · +36.7%
- By 2050
- 1,937,359 · +60.1%
- By 2075
- 2,567,039 · +112.1%
- By 2100
- 2,952,048 · +144.0%
Race, ethnicity, and origin ACS 2023
- Neighborhood character
- Majority White (65%)
- Race & ethnicity
- White 65% Hispanic / Latino 28% Two or more races 15% Black 2% Native American 1%
- Hispanic origin (detail)
- Mexican 26%
- Common ancestry
- Slovak 2% Serbian 1% Iranian 1%
- Foreign-born
- 17% · Canada, Jamaica
- Languages at home
- 74% English-only · Spanish 24% Arabic 1%
Political lean MEDSL · Collin
- 2024 margin
- R (+11.1) · D 43.1% · R 54.3% · Other 2.6%
- 2008→2024 swing
- +14.4pp toward D · 2008: -25.6pp · 2024: -11.1pp
- All cycles
- 2024: R+11.1 2020: R+4.3 2016: R+17.0 2012: R+31.6 2008: R+25.6
Not yet ingested
- Civics
- —
Market trends
- HPI YoY
- ▲ 10.09%
- Current HPI
- 331.12
- Rent YoY
- —
- Metro
- —
- State GDP YoY
- ▲ 3.95%
- F500 in state
- 110
Industry mix (Fortune 500 HQ in TX)
| Industry | F500 HQs | Revenue |
|---|---|---|
| Energy | 16 | $1,198B |
|
||
| Technology | 5 | $198B |
|
||
| Engineering / Construction | 4 | $72B |
|
||
| Energy Services | 3 | $60B |
|
||
| Utilities | 3 | $41B |
|
||
| Healthcare | 2 | $330B |
|
||
Cash-flow waterfall
monthlySold comps — $/sqft
last 12 mo · ≤1 miLoading sold comps…