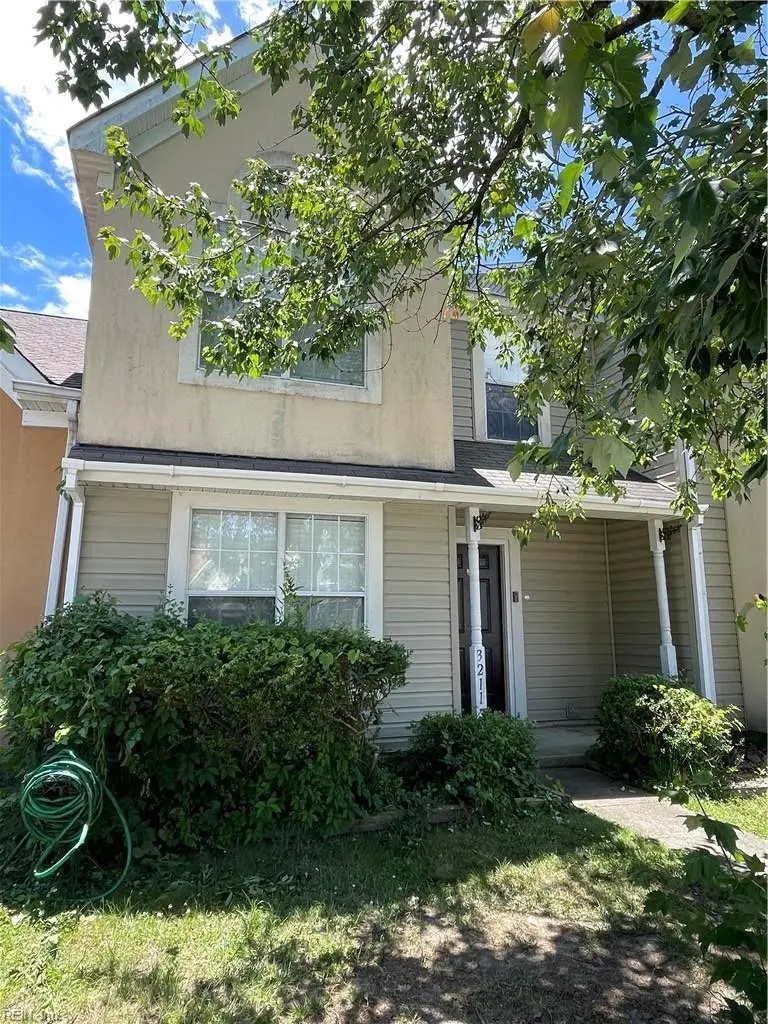
3211 Spruce Pine Rd · Virginia Beach, VA
Flood risk 2/10 · Minimal
- FEMA flood zone
- X (unshaded)
- Chance of flooding over 30 yrs
- 0.05%
- Est. flood insurance / yr
- $507 – $1,088
Fire risk 3/10 · Minor
- Est. fire insurance / yr
- $666 – $1,236
Heat risk 9/10 · Severe
- Hot days now (above 105°F)
- 7 days/yr
- Hot days in 30 yrs
- 17 days/yr
Wind risk 8/10 · Major
- Chance of severe wind over 30 yrs
- 98.0%
Air-quality risk 3/10 · Minor
- Unhealthy air days now
- 2 days/yr
- Unhealthy air days in 30 yrs
- 4 days/yr
Risk factors via First Street. Map © Google.
Why this score? — see what drove the D grade
The composite is a weighted blend of 9 inputs, each scored 0–100. Each bar is that input's sub-score; the figure is the points it added to the 100-point composite (weight × sub-score).
- Cash flow +12.2/30.0
- ARV discount +7.1/15.0
- Schools +6.4/10.0
- Livability +4.2/5.0
- DSCR +3.6/10.0
- Rent growth +3.4/5.0
- 1% rule +2.8/10.0
- Condition / age +2.5/5.0
- Appreciation +0.0/10.0
$299,000
🖨 Deal sheet (PDF) 📄 Offer letter ✓ Due diligence
Listing remarks
Beautifully maintained by the current Tenant- Highly desirable Virginia Beach School districts, spacious kitchen, lots of cabinet for storage, built -in entertainment shelves for books and decorations in the living room. Very well maintained home.
Key facts
- Spacious kitchen
- 2 parking spots
- Built 1995
Tags
Property features AI
Finance
- Other: Neighborhood: AMBERWOOD
- HOA & community: No association fees listed
Exterior
- Parking: Assigned/reserved parking (2 spaces); Driveway parking
- Utilities: City/County water; City/County sewer; Gas water heater; Electric service compatible with heat pump
- Home design: Attached townhouse; Two stories with 2 living levels; Slab foundation
- Construction: Vinyl and EIFS siding; Asphalt shingle roof
- Exterior features: Located on a cul-de-sac; Patio; Back yard fenced
Interior
- Kitchen: Electric range; Microwave; Dishwasher; Refrigerator; Breakfast area
- Bedrooms: Master bedroom (ensuite); Additional bedroom on 2nd floor
- Flooring: Carpet; Ceramic; Wood
- Bathrooms: Two full bathrooms; One half bathroom
- Heating & cooling: Heat pump (heating and cooling); Gas water heater
- Interior features: Cathedral ceiling; Gas fireplace; Ceiling fan; Pull-down attic stairs; Walk-in closet; Attic; Foyer; Pantry; Porch; Utility closet
- Laundry & utility: Washer hookup; Dryer hookup; Utility room
Neighborhood map
What this means for you Summary
Snapshot
- This is a 3-bed/2.5-bath townhouse listed at $299k.
Deal economics
- At list price, monthly cash flow is $-60 ($-725/yr) — negative.
- To cash-flow at today's rent, offer at most $288k (3.6% below list).
- To meet the 1% rule (rent ≥ 1% of price), the offer needs to be $232k (22.5% below list).
- Recommended offer: $232k (22.5% below list) — sets the bar for 1% rule.
- Cap rate 6.1% vs local median 3.5% in Virginia Beach — top-decile yield for the area; either an underpriced asset or a hidden risk that comps aren't pricing in. Stress-test before assuming the spread holds.
Location & tenants
- Location reads 83/100 on livability (#38 in VA, #880 nationally) — a professional / high-income tenant draw. Strengths: amenities A+, employment A+, housing A+; Watch: cost of living C-, commute F.
- Va Beach City Public School District (urban): math 69% / reading 78% proficiency, ranked #10 of 131 in VA (top 8%) — strong family-tenant draw, lease renewals of 3-5y typical.
- Zoned schools: Holland Elementary (math 57% / reading 67%, grade B, #480 of 1,108 statewide, top 46%, 460 students, 95% FRL); Corporate Landing Middle (math 66% / reading 77%, grade A, #72 of 342 statewide, top 22%, 1,054 students, 46% FRL); Landstown High (math 67% / reading 86%, grade A-, #99 of 319 statewide, top 31%, 2,226 students, 38% FRL) — zoned schools average 60% FRL vs 28% district-wide (32 pts higher); higher-poverty schools than district average — tighter screening recommended.
- Market conditions: Rents rising (+3.8%/yr); 367 active listings in the ZIP; 22 comparable units currently listed for rent nearby; rentals at typical pace (median 26d on market — plan ~3-4 weeks tenant-placement turnaround); high-income renter base; 666 units permitted in Virginia Beach city in 2024 (347 in 5+ unit buildings).
Forward outlook
- Local home prices are declining (-3.0%/yr); year-one equity from $2k of loan paydown is wiped out by about $9k of value loss. Plan a longer hold.
- Virginia Beach County population projected at +6% by 2050 — modest demand growth; plan on rents tracking national, not racing it.
Negotiation context
- Only 4 days on market — expect competitive offers; lowballing is unlikely to land.
- Current owner paid $88k; list at $299k implies a 240% gain — meaningful room to come down on a strong offer.
Risks & watch-outs
- Climate carrying-cost: severe wind risk, 98% chance of damaging wind over 30y; extreme-heat days projected 7→17/yr by 2055 (HVAC capex compounding) — expect insurance premiums to compound above CPI over the hold.
Questions for the listing agent
- What do current leases actually rent for vs. the listed asking? Can we see a recent rent roll and the last 12 months of T-12 income?
- Is there a deadline driving the sale (1031 exchange, divorce, estate, relocation)? That informs how much negotiation room exists.
- Schools are A-rated — typically a magnet for longer-tenancy family renters. What's the average tenant stay here, and is there a school-zone premium baked into asking?
- The area grade is low — what's the realistic commute time and amenity access for the typical tenant pool here? Any planned neighborhood developments (good or bad) we should know about?
- What's the average days-on-market for RENTAL listings here right now (not sales)? A rising rental-DOM trend means longer vacancies and softer asking-rent achievability than the comps imply.
- What's the recent tenant-quality profile in this submarket — average credit score on applications, eviction rate, late-payment / NSF rate, and stable-employment percentage? A property-management company in the area should have these aggregated.
- How much new for-sale + rental construction is in the pipeline within 1–3 miles? Heavy new supply typically softens prices + rents 12–24 months out; constrained supply supports both.
Investment metrics
- 1% rule
- 0.78% ✗
- Cap rate
- 6.05%
- Cash-on-cash
- -0.87%
- DSCR
- 0.96
- GRM
- 10.8
CMA / ARV
- ARV (on-the-fly)
- $296,112
- Comps found
- 12
Show comp detail 12 sales within ~0.75 mi
| Address | Dist | Beds/Ba | Sqft | Sold | Price | $/sf | Match |
|---|---|---|---|---|---|---|---|
| 891 Old Clubhouse Rd | 0.06mi | 3/2.0 | 1,500 (+1%) | 1mo | $300,000 | $200 | 93 |
| 867 Old Clubhouse Rd | 0.10mi | 3/2.5 | 1,511 (+2%) | 3mo | $287,000 | $190 | 90 |
| 3244 Yorkborough Way | 0.25mi | 3/2.5 | 1,386 (-7%) | 0mo | $300,000 | $216 | 77 |
| 2932 Old Glory Rd | 0.48mi | 3/1.5 | 1,514 (+2%) | 4mo | $285,000 | $188 | 67 |
| 1324 Ruddy Oak Ct | 0.42mi | 3/1.5 | 1,546 (+4%) | 3mo | $268,000 | $173 | 67 |
| 2913 Old Glory Rd | 0.55mi | 4/2.5 (+1) | 1,511 (+2%) | 2mo | $300,000 | $199 | 65 |
| 3320 Waterman Rd | 0.46mi | 3/2.0 | 1,386 (-7%) | 3mo | $329,500 | $238 | 62 |
| 3300 Waterman Rd | 0.46mi | 3/2.0 | 1,368 (-8%) | 2mo | $340,000 | $249 | 62 |
| 3070 Breslaw Ct | 0.57mi | 4/2.5 (+1) | 1,408 (-5%) | 2mo | $243,000 | $173 | 58 |
| 3152 Ashaway Rd | 0.61mi | 3/2.0 | 1,356 (-9%) | 2mo | $342,000 | $252 | 53 |
| 965 Clubhouse Rd S | 0.52mi | 3/1.5 | 1,320 (-11%) | 2mo | $250,000 | $189 | 51 |
| 959 S Club House Rd | 0.53mi | 3/1.5 | 1,276 (-14%) | 2mo | $244,000 | $191 | 46 |
Match score weights: distance 35% · size 25% · config 20% · recency 20%. Top-matched comps best support the ARV.
Projected returns pro-forma
-3.0% appreciation · 3.78% rent growth · sell at horizon
- IRR
- -17.0%
- Equity multiple
- 0.40×
- Total profit
- $-50,537
- Equity at exit
- $44,582
- IRR
- -7.6%
- Equity multiple
- 0.50×
- Total profit
- $-41,614
- Equity at exit
- $25,852
Cash invested: $83,720 (down + closing). Projections, not guarantees.
Landlord ↔ Tenant lean methodology
- Overall (STATE)
- 55 Moderately Landlord-Leaning
- State Virginia
- 55 Moderately Landlord-Leaning · D+2
- County
- — inherits STATE
- City
- — inherits STATE
ZIP-level market 23456
- Rents YoY
- 3.8%
- Active inventory
- 367
- Price-to-rent
- 10.8×
Monthly cashflow live
- Estimated rent
- $2,317 high interval (Pro) →
- Mortgage (P&I)
- −$1,568
- Tax from tax record
- −$198 /mo · $2,381/yr
- Insurance
- −$125
- HOA
- −$0
- Vacancy / Maint / Mgmt
- −$487
- Net cashflow
- $-60
Break-even live
Sensitivity live
| Price | -10% $109 | -5% $24 | +0% $-60 | +5% $-145 | +10% $-230 |
|---|---|---|---|---|---|
| Rent | -10% $-243 | -5% $-152 | +0% $-60 | +5% $31 | +10% $123 |
| Rate | -1.0pp $90 | -0.5pp $16 | base $-60 | +0.5pp $-138 | +1.0pp $-217 |
UW: 25.0% down · 7.5% · 30yr · 1.5% tax · 5.0% vac · 8.0% maint · 8.0% mgmt
Financing live
Cash to close
- Down payment
- $74,750
- Closing costs
- $8,970
- Reserves months
- —
- Total cash needed
- —
Loan-product check · same deal, 3 products live
Conventional
25% down · 7.5% · 30yr
- Down + closing
- —
- Monthly P&I
- —
- Monthly cashflow
- —
- DSCR
- —
- Eligible?
- —
Personal DTI + credit; lowest rate.
DSCR
20% down · 8.5% · 30yr
- Down + closing
- —
- Monthly P&I
- —
- Monthly cashflow
- —
- DSCR
- —
- Eligible?
- —
No personal income docs; deal must DSCR.
Hard money
10% down · 12.0% · 12mo
- Down + closing
- —
- Monthly P&I
- —
- Monthly cashflow
- —
- DSCR
- —
- Eligible?
- —
Short-term bridge; refi at stabilization.
Rent comps 22 comps
| Address | Beds | Baths | Sqft | Rent | $/sqft | DOM | Units | Dist |
|---|---|---|---|---|---|---|---|---|
| 1232 White Birch Ln Virginia Beach, VA | 3.0 | 2.0 | 1254 | $2,095 | $1.67 | 25d | 1 | 0.35mi |
| 1240 White Birch Ln Virginia Beach, VA | 3.0 | 1.5 | 1254 | $1,950 | $1.56 | 19d | 1 | 0.36mi |
| 3304 Weeping Willow Ln Virginia Beach, VA | 3.0 | 1.5 | 1254 | $1,750 | $1.40 | 25d | 1 | 0.41mi |
| 1257 Green Cedar Ln Virginia Beach, VA | 2.0 | 1.5 | 950 | $1,725 | $1.82 | 9d | 1 | 0.47mi |
| 932 Gossman Dr Virginia Beach, VA | 3.0 | 1.5 | 1430 | $2,300 | $1.61 | 23d | 1 | 0.53mi |
| 1301 Pine Cone Cir Virginia Beach, VA | 1.0–3.0 | 1.0–2.0 | 827 | $2,170 | $2.62 | 3d | 13 | 0.66mi |
| 3500 Green Garden Cir Virginia Beach, VA | 2.0 | 1.0 | 980 | $1,685 | $1.72 | 25d | 1 | 0.73mi |
| 2925 Theodorus Ct Virginia Beach, VA | 3.0 | 1.5 | 1120 | $2,000 | $1.79 | 6d | 1 | 0.75mi |
| 2908 Peppercorn Ct Virginia Beach, VA | 4.0 | 1.5 | 1381 | $2,295 | $1.66 | 25d | 1 | 0.79mi |
| 3517 Plum Cres Virginia Beach, VA | 3.0 | 2.0 | 1450 | $2,200 | $1.52 | 14d | 1 | 0.83mi |
| 1434 Peony Arch Virginia Beach, VA | 3.0 | 2.0 | 1407 | $2,600 | $1.85 | 25d | 1 | 0.99mi |
| 3745 Edenberry Ct Virginia Beach, VA | 2.0 | 2.0 | 1044 | $1,899 | $1.82 | 6d | 1 | 1.03mi |
| 3504 Shawn Ct Virginia Beach, VA | 4.0 | 2.5 | 1669 | $2,650 | $1.59 | 25d | 1 | 1.03mi |
| 3521 Sierra Arch Virginia Beach, VA | 3.0 | 1.5 | 1420 | $1,650 | $1.16 | 25d | 1 | 1.09mi |
| 3416 Hollygreen Dr Virginia Beach, VA | 2.0 | 1.0 | 960 | $1,754 | $1.83 | 25d | 5 | 1.19mi |
| 713 Willow Lake Cir Virginia Beach, VA | 1.0–2.0 | 1.0–2.0 | 1041 | $2,475 | $2.38 | 25d | 1 | 1.22mi |
| 1404 Wendfield Dr Virginia Beach, VA | 3.0 | 1.5 | 1344 | $2,000 | $1.49 | 6d | 1 | 1.22mi |
| 1404 Wendfield Dr #102 Virginia Beach, VA | 3.0 | 1.5 | 1344 | $2,000 | $1.49 | 25d | 1 | 1.23mi |
| 1404 Wendfield Dr #102 Virginia Beach, VA | 3.0 | 1.5 | 1344 | $2,000 | $1.49 | 6d | 1 | 1.23mi |
| 1401 Wendfield Dr #103 Virginia Beach, VA | 3.0 | 1.5 | 1344 | $1,850 | $1.38 | 22d | 1 | 1.28mi |
| 3638 Windmill Dr Virginia Beach, VA | 2.0 | 1.0 | 934 | $1,695 | $1.81 | 12d | 1 | 1.43mi |
| 3560 Windmill Dr Virginia Beach, VA | 3.0 | 1.5 | 1080 | $2,100 | $1.94 | 25d | 1 | 1.46mi |
Listing history 4 events
-
2026-06-07statusdays on market $299,000 Under Contract 4 DOM
-
2026-06-03days on market $299,000 Active 2 DOM
-
2026-06-02remarks 247-char remark
-
2026-06-02$299,000 Active 1 DOM
ⓘ Source: listings_history table (triggers on properties + properties_extension) + one-shot
backfill from property_details.listing_events for pre-trigger history.
Tax reassessment forecast VA · Resets to sale price
- Current annual tax
- $2,381 · $198/mo
- Projected year-2 tax
- $2,452 · $204/mo
- Expected delta
- +$70/yr (+$6/mo · 3.0%)
ⓘ Screening estimate from a state-policy table — verify with the county assessor before closing.
Climate risk First Street
- Flood 2/10 Low FEMA zone X (unshaded) · 5% chance over 30 yrs
- Wildfire 3/10 Moderate
- Heat 9/10 Extreme 7 d/yr ≥105°F today · 17 d/yr by 30 yrs out
- Wind 8/10 Severe 98% chance of damaging wind over 30 yrs
- Air quality 3/10 Moderate 2 unhealthy d/yr today · 4 by 30 yrs out
Nearby sold comps map
Loading sold comps map…
Walkable amenities ~0.75 mi
Loading nearby amenities…
Taxation est. · year 1
- Rental income
- $27,807
- − Mortgage interest
- −$16,749
- − Property taxes
- −$2,381
- − Insurance
- −$1,495
- − Repairs & maintenance
- −$2,225
- − Management
- −$2,225
- − Depreciation
- −$8,698
- Taxable loss
- −$5,965
- Est. tax savings @ 24.0%
- +$1,432
- After-tax cash flow
- $707/yr
For passive investors: Depreciation is non-cash, so a rental often shows a tax loss while cash-flowing — sheltering income. Rental losses are passive: they offset passive income freely, and up to $25,000/yr can offset ordinary (W-2) income if you actively participate and your MAGI is under $100k (phasing out to $0 by $150k); unused losses carry forward. On sale, claimed depreciation is recaptured at up to 25%, and gains may owe capital-gains tax (a 1031 exchange can defer both). Figures are a year-1 estimate at your 24.0% rate — not tax advice; consult a CPA.
Schools (NCES district)
- District
- Va Beach City Public School District
- NCES district ID
- 5103840
- Math proficiency
- 69% ▼ -19.00%
- Reading proficiency
- 78% ▼ -7.00%
- Median HH income
- $66,452
- Composite
- 63.81/100
- National rank
- #594
- State rank
- #10 of 131 in VA
Livability — Virginia Beach
- Score
- 83/100
- State rank
- #38
- US rank
- #880
Category grades
Schools grade is shown separately in the Schools card above.
Census & demographics
- Census place
- Virginia Beach, VA
- County
- Virginia Beach City · 448,227 people
- City population
- 448,227
- Metro
- Virginia Beach-Norfolk-Newport News, VA-NC
- Population (ZIP)
- 61,911
- Household income
- $130,533
- Rent vs Own
- Severe rent burden
- 390.0
Population outlook (Virginia Beach County) Hauer SSP2
- Today (2025)
- 480,401 people
- By 2030
- 491,221 · +2.3%
- By 2040
- 504,882 · +5.1%
- By 2050
- 508,847 · +5.9%
- By 2075
- 504,831 · +5.1%
- By 2100
- 465,867 · -3.0%
Race, ethnicity, and origin ACS 2023
- Neighborhood character
- Diverse neighborhood (Simpson 0.60)
- Race & ethnicity
- White 60% Black 13% Asian 12% Two or more races 10% Hispanic / Latino 9%
- Hispanic origin (detail)
- Mexican 3% Puerto Rican 2%
- Common ancestry
- Romanian 2% Slovak 2% Lithuanian 2%
- Foreign-born
- 12% · Canada, China, Vietnam
- Languages at home
- 85% English-only · Tagalog/Filipino 4% Spanish 4% Other Indo-European 2%
Political lean MEDSL · Virginia Beach
- 2024 margin
- Toss-up / Even · D 50.7% · R 48.0% · Other 1.3%
- 2008→2024 swing
- +3.4pp toward D · 2008: -0.7pp · 2024: 2.6pp
- All cycles
- 2024: D+2.6 2020: D+5.4 2016: R+4.5 2012: R+2.5 2008: R+0.7
Not yet ingested
- Civics
- —
Market trends
- HPI YoY
- ▼ -328.17%
- Current HPI
- 318.3094
- Rent YoY
- ▲ 3.78%
- Metro
- Virginia Beach-Norfolk-Newport News, VA-NC
- State GDP YoY
- ▲ 2.40%
- F500 in state
- 50
Industry mix (Fortune 500 HQ in VA)
| Industry | F500 HQs | Revenue |
|---|---|---|
| Aerospace / Defense | 4 | $236B |
|
||
| Technology / Defense | 3 | $32B |
|
||
| Financial Services | 2 | $176B |
|
||
| Utilities | 2 | $27B |
|
||
| Insurance | 2 | $25B |
|
||
| Technology | 2 | $15B |
|
||
Price history
+239.8% since first listed3 events — show timeline
- 2026-06-01 Listed $299,000 REINMLS
- 2022-12-10 Rental Removed — RENT.
- 2001-07-18 Sold (Public Records) $88,000 Public Records
Property tax history
+4.5%/yrLatest (2025): $2,381 · +2.0% YoY. Source: county tax records.
Cash-flow waterfall
monthlySold comps — $/sqft
last 12 mo · ≤1 miLoading sold comps…