 20-Plex
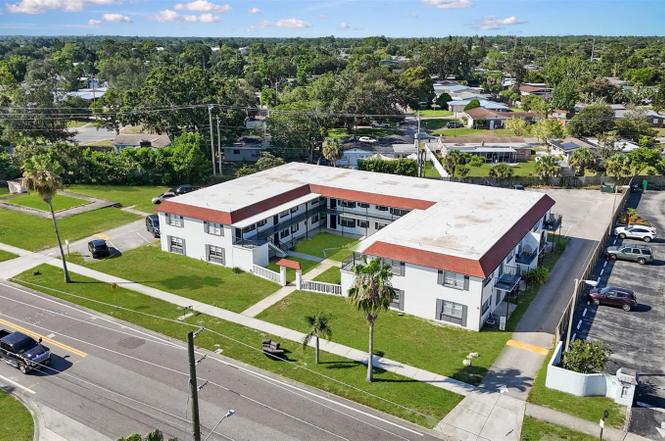
955 Knox Mcrae Dr · Titusville, FL
Flood risk 1/10 · Minimal
- FEMA flood zone
- X (unshaded)
- Chance of flooding over 30 yrs
- 0.0%
- Est. flood insurance / yr
- $507 – $1,088
Fire risk 4/10 · Minor
- Est. fire insurance / yr
- $947 – $1,759
Heat risk 10/10 · Severe
- Hot days now (above 108°F)
- 7 days/yr
- Hot days in 30 yrs
- 22 days/yr
Wind risk 10/10 · Severe
- Chance of severe wind over 30 yrs
- 99.0%
Air-quality risk 1/10 · Minimal
- Unhealthy air days now
- 0 days/yr
- Unhealthy air days in 30 yrs
- 0 days/yr
Risk factors via First Street. Map © Google.
Why this score? — see what drove the B grade
The composite is a weighted blend of 9 inputs, each scored 0–100. Each bar is that input's sub-score; the figure is the points it added to the 100-point composite (weight × sub-score).
- Cash flow +30.0/30.0
- 1% rule +10.0/10.0
- DSCR +10.0/10.0
- ARV discount +7.5/15.0
- Schools +4.7/10.0
- Livability +4.2/5.0
- Rent growth +2.8/5.0
- Condition / age +2.5/5.0
- Appreciation +0.0/10.0
$2,399,000
🖨 Deal sheet 📄 Offer letter ✓ Due diligence
Multi-family units
County records classify this as Multi-Family (5+ Unit). Listing-text estimate: 20 units. confirmed
5+ unit building — per-unit beds/baths from public records are typically unavailable; the breakdown below (if shown) is an estimate from the listing text.
Listing remarks
Coquina Court Apartments is a 20-unit multifamily community located in Titusville, Florida. The property features a single concrete block building constructed in 1969 and offers a mix of 12 two-bedroom/one-bath units and 8 one-bedroom/one-bath units. Recent ownership improvements include $30,000 in roof work. Tenants pay their own electric, while the owner covers water, resulting in a simplified utility structure for investors. Titusville, in Brevard County, is known as “Space City, USA” due to its strong ties to the aerospace industry. The city is experiencing significant economic growth, with a new aerospace company bringing 1,347 jobs over the next four years, plus an estimat
Key facts
- Roof work
- 0.91 acre lot
- Built 1969
Tags
Property features AI
Finance
- Other: Property classified as multi-family 20-unit property (12 two-bedrooms, 8 one-bedrooms); Unit breakdown: twelve 2-bedroom units (~800 heated area), eight 1-bedroom units (~655 heated area); Pro forma rents listed for unit types (example pro forma values reported)
- Financial info: Gross income reported: $282,189; Annual net income reported: $184,885; Annual expenses reported: $97,304; Tenants pay electricity
- HOA & community: No HOA
Exterior
- Parking: No parking details provided
- Security: No security features provided
- Utilities: Public water; Public sewer; Electricity connected; Sewer connected; Water connected
- Home design: Residential income property; Multi-family (5+ units); One building on the property; Zoned R3; Lot approximately 0.91 acres
- Construction: Concrete construction; Other-style roof; Slab foundation; Built area approximately 15,488 square feet
- Exterior features: Balconies on the building; Asphalt road access
Interior
- Kitchen: No specific kitchen appliance details provided
- Bedrooms: Total of 32 bedrooms across the property (mix of 2-bedroom and 1-bedroom units)
- Flooring: No flooring details provided
- Bathrooms: One bathroom in each unit type
- Heating & cooling: Central heating; Electric heating; Central air conditioning
- Interior features: No notable interior features listed
- Laundry & utility: Shared common-area laundry
Neighborhood map
What this means for you Summary
Snapshot
- This is a 20 × 32-bed/20.0-bath units multifamily listed at $2.40M.
Deal economics
- At list price, monthly cash flow is $15k ($174k/yr) — positive. Per door: $727/mo.
- The deal already cash-flows at list — no discount required.
- Meets the 1% rule at list price ($39k rent vs $2.40M).
- Recommended offer: $2.11M (12.0% below list) — sets the bar for market timing.
Location & tenants
- Location reads 84/100 on livability (#42 in FL, #668 nationally) — a professional / high-income tenant draw. Strengths: commute A+, cost of living A+, housing A+; Watch: schools C-, crime D, employment D.
- Brevard (suburban): math 53% / reading 57% proficiency, ranked #19 of 73 in FL (top 26%) — acceptable for families but not a draw, mixed tenant base, ~2y average lease.
- Market conditions: Rents rising (+1.3%/yr); 462 active listings in the ZIP; 4,602 units permitted in Brevard County in 2024 (702 in 5+ unit buildings).
- At $38,640/mo this rent would consume 685% of the median local household income ($68k/yr) (locally 1141% of renters already pay >50% of income on rent) — very limited rent-growth headroom before tenants either downsize or default.
Forward outlook
- Local home prices are declining (-3.0%/yr); year-one equity from $17k of loan paydown is wiped out by about $72k of value loss. Plan a longer hold.
- Brevard County population projected at +15% by 2050 — modest demand growth; plan on rents tracking national, not racing it.
- At projected returns (-3.0% appreciation + 1.3% rent growth), your $672k cash investment doubles in ~6 years — after that, you're playing with house money.
Negotiation context
- It's been on market 217 days — a 12% lower offer ($2.11M) is reasonable based on typical stale-listing flexibility.
- 9 sale attempts since 10y ago with the ask held roughly flat each time — persistent listings suggest the price (not the market) is what's stuck; bring a comps-based counter.
- Current owner paid $1.25M; list at $2.40M implies a 92% gain — meaningful room to come down on a strong offer.
Risks & watch-outs
- Climate carrying-cost: severe wind risk, 99% chance of damaging wind over 30y; extreme-heat days projected 7→22/yr by 2055 (HVAC capex compounding) — expect insurance premiums to compound above CPI over the hold.
Questions for the listing agent
- It's been on market 217 days. Have you received any prior offers? Is the seller open to a 12% concession, seller financing, or rate buy-down credit?
- Can we see the unit-by-unit rent roll, current vacancy, and any below-market leases? What's the average tenancy length?
- What capital expenditures (roof, boiler, parking lot, exteriors) have been made in the last 5 years, and what's planned in the next 2?
- Built in 1969 — when were the roof, HVAC, electrical panel, plumbing, and water heater last replaced?
- Why hasn't it sold? Are there any deal-killer items the seller is aware of (foundation, flood, title, zoning, code violations)?
- Is there a deadline driving the sale (1031 exchange, divorce, estate, relocation)? That informs how much negotiation room exists.
- Crime grade is D in this area — have there been break-ins, vandalism, or insurance claims at this property in the last 3 years? What carrier currently insures it and at what premium?
- What's the average days-on-market for RENTAL listings here right now (not sales)? A rising rental-DOM trend means longer vacancies and softer asking-rent achievability than the comps imply.
- What's the recent tenant-quality profile in this submarket — average credit score on applications, eviction rate, late-payment / NSF rate, and stable-employment percentage? A property-management company in the area should have these aggregated.
- How much new apartment / multifamily construction is in the pipeline within 1–3 miles? Heavy new supply (>2% of stock underway) typically softens rents 12–24 months out; light construction supports rent growth.
Investment metrics
- 1% rule
- 1.61% ✓
- Cap rate
- 13.56%
- Cash-on-cash
- 25.96%
- DSCR
- 2.16
- GRM
- 5.2
CMA / ARV
No comps found within radius.
Projected returns pro-forma
-3.0% appreciation · 1.29% rent growth · sell at horizon
- IRR
- 17.7%
- Equity multiple
- 1.70×
- Total profit
- $471,693
- Equity at exit
- $357,699
- IRR
- 25.0%
- Equity multiple
- 3.00×
- Total profit
- $1,344,303
- Equity at exit
- $207,422
Cash invested: $671,720 (down + closing). Projections, not guarantees.
Landlord ↔ Tenant lean methodology
- Overall (STATE)
- 87 Strongly Landlord-Friendly
- State Florida
- 87 Strongly Landlord-Friendly · R+3
- County
- — inherits STATE
- City
- — inherits STATE
ZIP-level market 32780
- Rents YoY
- 1.3%
- Active inventory
- 462
- Price-to-rent
- 103.5×
Monthly cashflow live
- Estimated rent
- $38,640 medium interval (Pro) →
- Mortgage (P&I)
- −$12,581
- Tax from tax record
- −$2,413 /mo · $28,955/yr
- Insurance
- −$1,000
- HOA
- −$0
- Vacancy / Maint / Mgmt
- −$8,114
- Net cashflow
- $14,533
Break-even live
20-unit breakdown (identical units grouped — click to expand)
| Units | Beds | Baths | Est. rent |
|---|---|---|---|
| 20× units | 32 | 20 | $38,640 |
| #1 | 32 | 20 | $1,932 |
| #2 | 32 | 20 | $1,932 |
| #3 | 32 | 20 | $1,932 |
| #4 | 32 | 20 | $1,932 |
| #5 | 32 | 20 | $1,932 |
| #6 | 32 | 20 | $1,932 |
| #7 | 32 | 20 | $1,932 |
| #8 | 32 | 20 | $1,932 |
| #9 | 32 | 20 | $1,932 |
| #10 | 32 | 20 | $1,932 |
| #11 | 32 | 20 | $1,932 |
| #12 | 32 | 20 | $1,932 |
| #13 | 32 | 20 | $1,932 |
| #14 | 32 | 20 | $1,932 |
| #15 | 32 | 20 | $1,932 |
| #16 | 32 | 20 | $1,932 |
| #17 | 32 | 20 | $1,932 |
| #18 | 32 | 20 | $1,932 |
| #19 | 32 | 20 | $1,932 |
| #20 | 32 | 20 | $1,932 |
| Total (20 units) | $38,640 | ||
UW: 25.0% down · 7.5% · 30yr · 1.5% tax · 5.0% vac · 8.0% maint · 8.0% mgmt
Financing live
Cash to close
- Down payment
- $599,750
- Closing costs
- $71,970
- Reserves months
- —
- Total cash needed
- —
Loan-product check · same deal, 3 products live
Conventional
25% down · 7.5% · 30yr
- Down + closing
- —
- Monthly P&I
- —
- Monthly cashflow
- —
- DSCR
- —
- Eligible?
- —
Personal DTI + credit; lowest rate.
DSCR
20% down · 8.5% · 30yr
- Down + closing
- —
- Monthly P&I
- —
- Monthly cashflow
- —
- DSCR
- —
- Eligible?
- —
No personal income docs; deal must DSCR.
Hard money
10% down · 12.0% · 12mo
- Down + closing
- —
- Monthly P&I
- —
- Monthly cashflow
- —
- DSCR
- —
- Eligible?
- —
Short-term bridge; refi at stabilization.
Listing history 36 events
-
2026-06-18days on market $2,399,000 Active 217 DOM
-
2026-06-17days on market $2,399,000 Active 216 DOM
-
2026-06-16days on market $2,399,000 Active 215 DOM
-
2026-06-15days on market $2,399,000 Active 214 DOM
-
2026-06-14days on market $2,399,000 Active 212 DOM
-
2026-06-10days on market $2,399,000 Active 209 DOM
-
2026-06-08days on market $2,399,000 Active 207 DOM
-
2026-06-07days on market $2,399,000 Active 206 DOM
-
2026-06-05days on market $2,399,000 Active 203 DOM
-
2026-06-03days on market $2,399,000 Active 202 DOM
-
2026-06-02days on market $2,399,000 Active 201 DOM
-
2026-06-01days on market $2,399,000 Active 200 DOM
-
2026-05-31days on market $2,399,000 Active 199 DOM
-
2026-05-31days on market $2,399,000 Active 198 DOM
-
2026-04-14price $2,399,000
-
2026-03-16status Active
-
2025-12-29status Pending
-
2025-08-28$2,500,000 Active
-
2024-05-26historical $1,195
-
2024-05-15$1,195
-
2024-05-15historical $1,195
-
2024-04-23$1,195
-
2024-03-14historical $1,050
-
2024-02-02$1,050
-
2024-01-02historical $1,050
-
2024-01-02$1,050
-
2023-12-29historical $1,050
-
2023-12-23$1,050
-
2023-11-30historical $1,095
-
2023-11-30$1,095
-
2018-09-12soldstatus $1,250,000
-
2016-07-01historical
-
2016-06-06$850,000
-
2015-01-30soldstatus $615,000
-
2000-11-22soldstatus $450,000
-
1985-01-01soldstatus $575,000
ⓘ Source: listings_history table (triggers on properties + properties_extension) + one-shot
backfill from property_details.listing_events for pre-trigger history.
Tax reassessment forecast FL · Resets to sale price
- Current annual tax
- $28,955 · $2,413/mo
- Projected year-2 tax
- $28,955 · $2,413/mo
- Expected delta
- $0/yr ($0/mo · 0.0%)
ⓘ Screening estimate from a state-policy table — verify with the county assessor before closing.
Climate risk First Street
- Flood 1/10 Low FEMA zone X (unshaded) · 0% chance over 30 yrs
- Wildfire 4/10 Moderate
- Heat 10/10 Extreme 7 d/yr ≥108°F today · 22 d/yr by 30 yrs out
- Wind 10/10 Extreme 99% chance of damaging wind over 30 yrs
- Air quality 1/10 Low 0 unhealthy d/yr today · 0 by 30 yrs out
Nearby sold comps map
Loading sold comps map…
Walkable amenities ~0.75 mi
Loading nearby amenities…
Taxation est. · year 1
- Rental income
- $463,680
- − Mortgage interest
- −$134,381
- − Property taxes
- −$28,955
- − Insurance
- −$11,995
- − Repairs & maintenance
- −$37,094
- − Management
- −$37,094
- − Depreciation
- −$69,789
- Taxable income
- $144,371
- Est. tax owed @ 24.0%
- −$34,649
- After-tax cash flow
- $139,741/yr
For passive investors: Depreciation is non-cash, so a rental often shows a tax loss while cash-flowing — sheltering income. Rental losses are passive: they offset passive income freely, and up to $25,000/yr can offset ordinary (W-2) income if you actively participate and your MAGI is under $100k (phasing out to $0 by $150k); unused losses carry forward. On sale, claimed depreciation is recaptured at up to 25%, and gains may owe capital-gains tax (a 1031 exchange can defer both). Figures are a year-1 estimate at your 24.0% rate — not tax advice; consult a CPA.
Schools (NCES district)
- District
- Brevard
- NCES district ID
- 1200150
- Math proficiency
- 53% ▼ -9.00%
- Reading proficiency
- 57% ▼ -4.00%
- Median HH income
- $49,426
- Composite
- 46.86/100
- National rank
- #2370
- State rank
- #19 of 73 in FL
Livability — Titusville
- Score
- 84/100
- State rank
- #42
- US rank
- #668
Category grades
Schools grade is shown separately in the Schools card above.
Census & demographics
- Census place
- Titusville, FL
- County
- Brevard County · 602,871 people
- City population
- 60,286
- Metro
- Palm Bay-Melbourne-Titusville, FL
- Population (ZIP)
- 40,064
- Household income
- $67,690
- Rent vs Own
- Severe rent burden
- 1141.0
Population outlook (Brevard County) Hauer SSP2
- Today (2025)
- 623,254 people
- By 2030
- 648,420 · +4.0%
- By 2040
- 690,009 · +10.7%
- By 2050
- 715,669 · +14.8%
- By 2075
- 775,744 · +24.5%
- By 2100
- 776,687 · +24.6%
Race, ethnicity, and origin ACS 2023
- Neighborhood character
- Predominantly White (70%)
- Race & ethnicity
- White 70% Black 13% Hispanic / Latino 8% Two or more races 8% Asian 3%
- Hispanic origin (detail)
- Mexican 1% Puerto Rican 4% Cuban 1%
- Common ancestry
- Romanian 2% Slovak 2% Lithuanian 2%
- Foreign-born
- 8% · Canada, China
- Languages at home
- 89% English-only · Spanish 6% Other Indo-European 1% German/W. Germanic 1%
Political lean MEDSL · Brevard
- 2024 margin
- Strong R (+20.8) · D 39.1% · R 59.9% · Other 1.0%
- 2008→2024 swing
- -10.4pp toward R · 2008: -10.4pp · 2024: -20.8pp
- All cycles
- 2024: R+20.8 2020: R+16.4 2016: R+19.8 2012: R+12.7 2008: R+10.4
Not yet ingested
- Civics
- —
Market trends
- HPI YoY
- ▼ -162.54%
- Current HPI
- 297.151
- Rent YoY
- ▲ 1.29%
- Metro
- Palm Bay-Melbourne-Titusville, FL
- State GDP YoY
- ▲ 3.28%
- F500 in state
- 36
Industry mix (Fortune 500 HQ in FL)
| Industry | F500 HQs | Revenue |
|---|---|---|
| Industrial Technology | 2 | $29B |
|
||
| Insurance | 2 | $17B |
|
||
| Retail | 1 | $60B |
|
||
| Technology Distribution | 1 | $58B |
|
||
| Homebuilding | 1 | $35B |
|
||
| Technology Manufacturing | 1 | $35B |
|
||
Price history
+317.2% since first listed22 events — show timeline
- 2026-04-14 Price Changed $2,399,000 Stellar MLS as Distributed by MLS Grid
- 2026-03-16 Relisted — Stellar MLS as Distributed by MLS Grid
- 2025-12-29 Pending — Stellar MLS as Distributed by MLS Grid
- 2025-08-28 Listed $2,500,000 Stellar MLS as Distributed by MLS Grid
- 2024-05-26 Rental Removed $1,195 APPFOLIO
- 2024-05-15 Listed for Rent $1,195 APPFOLIO
- 2024-05-15 Rental Removed $1,195 APPFOLIO
- 2024-04-23 Listed for Rent $1,195 APPFOLIO
- 2024-03-14 Rental Removed $1,050 APPFOLIO
- 2024-02-02 Listed for Rent $1,050 APPFOLIO
- 2024-01-02 Rental Removed $1,050 APPFOLIO
- 2024-01-02 Listed for Rent $1,050 APPFOLIO
- 2023-12-29 Rental Removed $1,050 APPFOLIO
- 2023-12-23 Listed for Rent $1,050 APPFOLIO
- 2023-11-30 Rental Removed $1,095 APPFOLIO
- 2023-11-30 Listed for Rent $1,095 APPFOLIO
- 2018-09-12 Sold (Public Records) $1,250,000 Public Records
- 2016-07-01 Listing Removed — Stellar MLS as Distributed by MLS Grid
- 2016-06-06 Listed $850,000 Stellar MLS as Distributed by MLS Grid
- 2015-01-30 Sold (Public Records) $615,000 Public Records
- 2000-11-22 Sold (Public Records) $450,000 Public Records
- 1985-01-01 Sold (Public Records) $575,000 Public Records
Property tax history
+14.3%/yrLatest (2025): $28,955 · +4.8% YoY. Source: county tax records.
Cash-flow waterfall
monthlySold comps — $/sqft
last 12 mo · ≤1 miLoading sold comps…