 Multi-family
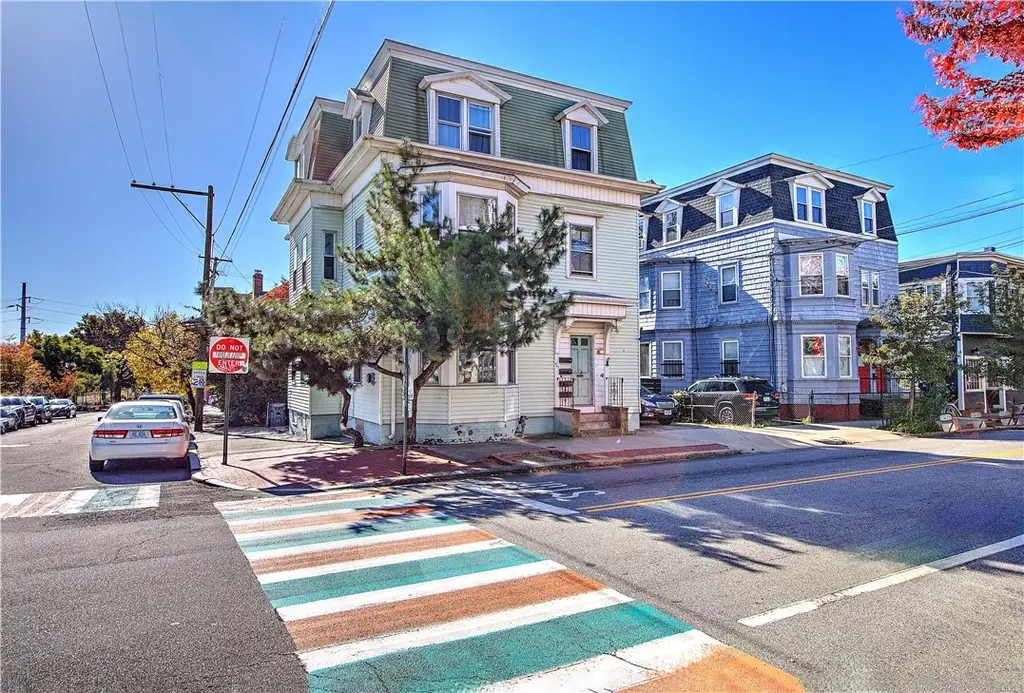
427 Wickenden St · Providence, RI
Flood risk 1/10 · Minimal
- FEMA flood zone
- X (unshaded)
- Chance of flooding over 30 yrs
- 0.0%
- Est. flood insurance / yr
- $473 – $860
Fire risk 1/10 · Minimal
- Est. fire insurance / yr
- $835 – $1,551
Heat risk 6/10 · Moderate
- Hot days now (above 97°F)
- 7 days/yr
- Hot days in 30 yrs
- 15 days/yr
Wind risk 6/10 · Moderate
- Chance of severe wind over 30 yrs
- 74.0%
Air-quality risk 2/10 · Minimal
- Unhealthy air days now
- 1 days/yr
- Unhealthy air days in 30 yrs
- 2 days/yr
Risk factors via First Street. Map © Google.
Why this score? — see what drove the C- grade
The composite is a weighted blend of 9 inputs, each scored 0–100. Each bar is that input's sub-score; the figure is the points it added to the 100-point composite (weight × sub-score).
- Cash flow +24.8/30.0
- DSCR +8.0/10.0
- 1% rule +6.1/10.0
- Appreciation +4.5/10.0
- Livability +4.2/5.0
- Rent growth +3.7/5.0
- Condition / age +2.5/5.0
- Schools +1.0/10.0
- ARV discount +0.0/15.0
$895,000
🖨 Deal sheet 📄 Offer letter ✓ Due diligence
Multi-family units
County records classify this as Multi-Family (2-4 Unit). Listing-text estimate: 1 unit. estimate disagrees with records
Listing remarks MLS
Exceptional investment opportunity in the heart of Fox Point! Ideally situated on sought-after Wickenden Street, just steps from Hope Street, this four-unit property combines strong rental income with fantastic location appeal. Each unit offers desirable layouts, from a studio, 1 bedroom and two 2-bedroom units, that attract consistent tenant demand, with plenty of potential to elevate rents through thoughtful updates over time. Adding to its value, the property includes off-street parking - a rare and highly coveted amenity in this vibrant neighborhood. Just steps from Fox Point's cafes, restaurants, boutiques, and India Point Park, this property places tenants and owners alike in the center of Providence's most dynamic community. Whether you're expanding your portfolio or seeking a stable, high-performing asset, this opportunity delivers both immediate returns and long-term upside.
Key facts
- Steps from cafes
- Vibrant neighborhood
- Off-street parking
Tags
Neighborhood map
What this means for you Summary
Snapshot
- This is a 6-bed/3.0-bath multifamily listed at $895k.
Deal economics
- At list price, monthly cash flow is $2k ($23k/yr) — positive.
- The deal already cash-flows at list — no discount required.
- Meets the 1% rule at list price ($10k rent vs $895k).
- Recommended offer: $788k (12.0% below list) — sets the bar for market timing.
- Cap rate 8.8% vs local median 4.2% in Providence — top-decile yield for the area; either an underpriced asset or a hidden risk that comps aren't pricing in. Stress-test before assuming the spread holds.
Location & tenants
- Location reads 84/100 on livability (#2 in RI, #794 nationally) — a professional / high-income tenant draw. Strengths: amenities A+, commute A+, housing A+; Watch: employment C-, schools F.
- Providence (urban): math 8% / reading 16% proficiency, ranked #34 of 39 in RI (top 87%) — low school quality limits family demand, transient renter base, plan for 1-2y turnover; 79% free/reduced lunch — lower-income household profile, screen leases tightly.
- Market conditions: Rents rising fast (+4.7%/yr); 55 active listings in the ZIP; 776 units permitted in Providence County in 2024 (229 in 5+ unit buildings).
- At $9,964/mo this rent would consume 185% of the median local household income ($64k/yr) (locally 1009% of renters already pay >50% of income on rent) — very limited rent-growth headroom before tenants either downsize or default.
Forward outlook
- Local home prices are declining (-1.1%/yr); year-one equity from $6k of loan paydown is wiped out by about $10k of value loss. Plan a longer hold.
- Providence County population projected at +5% by 2050 — modest demand growth; plan on rents tracking national, not racing it.
- At projected returns (-1.1% appreciation + 4.7% rent growth), your $251k cash investment doubles in ~8 years — after that, you're playing with house money.
Negotiation context
- It's been on market 223 days — a 12% lower offer ($788k) is reasonable based on typical stale-listing flexibility.
- 3 sale attempts since 14y ago; this cycle's ask has dropped $80k (8%) from the opening price — seller is motivated, your offer sets the floor, not the list.
- Current owner paid $325k; list at $895k implies a 175% gain — meaningful room to come down on a strong offer.
Risks & watch-outs
- Watch-outs: built in 1930 — expect roof / HVAC / electrical / plumbing capex.
- Climate carrying-cost: major wind risk, 74% chance of damaging wind over 30y; extreme-heat days projected 7→15/yr by 2055 (HVAC capex compounding) — expect insurance premiums to compound above CPI over the hold.
Questions for the listing agent
- It's been on market 223 days. Have you received any prior offers? Is the seller open to a 12% concession, seller financing, or rate buy-down credit?
- Built in 1930 — when were the roof, HVAC, electrical panel, plumbing, and water heater last replaced?
- Why hasn't it sold? Are there any deal-killer items the seller is aware of (foundation, flood, title, zoning, code violations)?
- Is there a deadline driving the sale (1031 exchange, divorce, estate, relocation)? That informs how much negotiation room exists.
- Schools are F-rated, which usually means shorter tenancies and higher turnover. Who's the typical renter profile here, and what's been the actual vacancy rate?
- What's the average days-on-market for RENTAL listings here right now (not sales)? A rising rental-DOM trend means longer vacancies and softer asking-rent achievability than the comps imply.
- What's the recent tenant-quality profile in this submarket — average credit score on applications, eviction rate, late-payment / NSF rate, and stable-employment percentage? A property-management company in the area should have these aggregated.
- How much new apartment / multifamily construction is in the pipeline within 1–3 miles? Heavy new supply (>2% of stock underway) typically softens rents 12–24 months out; light construction supports rent growth.
Investment metrics
- 1% rule
- 1.11% ✓
- Cap rate
- 8.84%
- Cash-on-cash
- 9.09%
- DSCR
- 1.40
- GRM
- 7.5
CMA / ARV
- ARV (median comp)
- $664,363
- List price
- $895,000
- Delta
- 34.72%
- Verdict
- OVERPRICED
- Comps
- 14 within 1.0 mi
Show comp detail 1 sale within ~0.75 mi
| Address | Dist | Beds/Ba | Sqft | Sold | Price | $/sf | Match |
|---|---|---|---|---|---|---|---|
| 61 Fort St | 0.75mi | 6/3.0 | 3,624 (+13%) | 20mo | $600,000 | $166 | 27 |
Match score weights: distance 35% · size 25% · config 20% · recency 20%. Top-matched comps best support the ARV.
Projected returns pro-forma
-1.08% appreciation · 4.73% rent growth · sell at horizon
- IRR
- 6.0%
- Equity multiple
- 1.27×
- Total profit
- $67,784
- Equity at exit
- $212,403
- IRR
- 13.8%
- Equity multiple
- 2.43×
- Total profit
- $359,213
- Equity at exit
- $219,953
Cash invested: $250,600 (down + closing). Projections, not guarantees.
Landlord ↔ Tenant lean methodology
- Overall (STATE)
- 31 Tenant-Leaning
- State Rhode Island
- 31 Tenant-Leaning · D+8
- County
- — inherits STATE
- City
- — inherits STATE
ZIP-level market 02903
- Home prices YoY
- -0.5%
- Rents YoY
- 4.7%
- Active inventory
- 55
- Price-to-rent
- 33.1×
Monthly cashflow live
- Estimated rent
- $9,964 high interval (Pro) →
- Mortgage (P&I)
- −$4,693
- Tax from tax record
- −$906 /mo · $10,877/yr
- Insurance
- −$373
- HOA
- −$0
- Vacancy / Maint / Mgmt
- −$2,092
- Net cashflow
- $1,899
Break-even live
4-unit breakdown (identical units grouped — click to expand)
| Units | Beds | Baths | Est. rent |
|---|---|---|---|
| 2× units | 1 | 1 | $4,512 |
| #1 | 1 | 1 | $2,256 |
| #2 | 1 | 1 | $2,256 |
| 2× units | 2 | 1 | $5,452 |
| #3 | 2 | 1 | $2,726 |
| #4 | 2 | 1 | $2,726 |
| Total (4 units) | $9,964 | ||
UW: 25.0% down · 7.5% · 30yr · 1.5% tax · 5.0% vac · 8.0% maint · 8.0% mgmt
Financing live
Cash to close
- Down payment
- $223,750
- Closing costs
- $26,850
- Reserves months
- —
- Total cash needed
- —
Loan-product check · same deal, 3 products live
Conventional
25% down · 7.5% · 30yr
- Down + closing
- —
- Monthly P&I
- —
- Monthly cashflow
- —
- DSCR
- —
- Eligible?
- —
Personal DTI + credit; lowest rate.
DSCR
20% down · 8.5% · 30yr
- Down + closing
- —
- Monthly P&I
- —
- Monthly cashflow
- —
- DSCR
- —
- Eligible?
- —
No personal income docs; deal must DSCR.
Hard money
10% down · 12.0% · 12mo
- Down + closing
- —
- Monthly P&I
- —
- Monthly cashflow
- —
- DSCR
- —
- Eligible?
- —
Short-term bridge; refi at stabilization.
Listing history 14 events
-
2026-06-05status $895,000 Pending 223 DOM
-
2026-06-03days on market $895,000 Active Under Contract 223 DOM
-
2026-06-02days on market $895,000 Active Under Contract 222 DOM
-
2026-06-01days on market $895,000 Active Under Contract 221 DOM
-
2026-05-31days on market $895,000 Active Under Contract 220 DOM
-
2026-05-17historical Active Under Contract 896-char remark
Show marketing remark (896 chars)
Exceptional investment opportunity in the heart of Fox Point! Ideally situated on sought-after Wickenden Street, just steps from Hope Street, this four-unit property combines strong rental income with fantastic location appeal. Each unit offers desirable layouts, from a studio, 1 bedroom and two 2-bedroom units, that attract consistent tenant demand, with plenty of potential to elevate rents through thoughtful updates over time. Adding to its value, the property includes off-street parking - a rare and highly coveted amenity in this vibrant neighborhood. Just steps from Fox Point's cafes, restaurants, boutiques, and India Point Park, this property places tenants and owners alike in the center of Providence's most dynamic community. Whether you're expanding your portfolio or seeking a stable, high-performing asset, this opportunity delivers both immediate returns and long-term upside.
-
2026-04-13price $895,000 896-char remark
Show marketing remark (896 chars)
Exceptional investment opportunity in the heart of Fox Point! Ideally situated on sought-after Wickenden Street, just steps from Hope Street, this four-unit property combines strong rental income with fantastic location appeal. Each unit offers desirable layouts, from a studio, 1 bedroom and two 2-bedroom units, that attract consistent tenant demand, with plenty of potential to elevate rents through thoughtful updates over time. Adding to its value, the property includes off-street parking - a rare and highly coveted amenity in this vibrant neighborhood. Just steps from Fox Point's cafes, restaurants, boutiques, and India Point Park, this property places tenants and owners alike in the center of Providence's most dynamic community. Whether you're expanding your portfolio or seeking a stable, high-performing asset, this opportunity delivers both immediate returns and long-term upside.
-
2025-10-23$975,000 Active 896-char remark
Show marketing remark (896 chars)
Exceptional investment opportunity in the heart of Fox Point! Ideally situated on sought-after Wickenden Street, just steps from Hope Street, this four-unit property combines strong rental income with fantastic location appeal. Each unit offers desirable layouts, from a studio, 1 bedroom and two 2-bedroom units, that attract consistent tenant demand, with plenty of potential to elevate rents through thoughtful updates over time. Adding to its value, the property includes off-street parking - a rare and highly coveted amenity in this vibrant neighborhood. Just steps from Fox Point's cafes, restaurants, boutiques, and India Point Park, this property places tenants and owners alike in the center of Providence's most dynamic community. Whether you're expanding your portfolio or seeking a stable, high-performing asset, this opportunity delivers both immediate returns and long-term upside.
-
2025-03-06historical $1,425
-
2025-03-03$1,425
-
2022-05-19price $1,500
-
2016-03-29soldstatus $325,000
-
2012-12-15historical
-
2012-06-15$389,900
ⓘ Source: listings_history table (triggers on properties + properties_extension) + one-shot
backfill from property_details.listing_events for pre-trigger history.
Tax reassessment forecast RI · Partial reset (capped growth)
- Current annual tax
- $10,877 · $906/mo
- Projected year-2 tax
- $12,733 · $1,061/mo
- Expected delta
- +$1,856/yr (+$155/mo · 17.1%)
ⓘ Screening estimate from a state-policy table — verify with the county assessor before closing.
Climate risk First Street
- Flood 1/10 Low FEMA zone X (unshaded) · 0% chance over 30 yrs
- Wildfire 1/10 Low
- Heat 6/10 Major 7 d/yr ≥97°F today · 15 d/yr by 30 yrs out
- Wind 6/10 Major 74% chance of damaging wind over 30 yrs
- Air quality 2/10 Low 1 unhealthy d/yr today · 2 by 30 yrs out
Nearby sold comps map
Loading sold comps map…
Walkable amenities ~0.75 mi
Loading nearby amenities…
Taxation est. · year 1
- Rental income
- $119,568
- − Mortgage interest
- −$50,134
- − Property taxes
- −$10,877
- − Insurance
- −$4,475
- − Repairs & maintenance
- −$9,565
- − Management
- −$9,565
- − Depreciation
- −$26,036
- Taxable income
- $8,915
- Est. tax owed @ 24.0%
- −$2,140
- After-tax cash flow
- $20,645/yr
For passive investors: Depreciation is non-cash, so a rental often shows a tax loss while cash-flowing — sheltering income. Rental losses are passive: they offset passive income freely, and up to $25,000/yr can offset ordinary (W-2) income if you actively participate and your MAGI is under $100k (phasing out to $0 by $150k); unused losses carry forward. On sale, claimed depreciation is recaptured at up to 25%, and gains may owe capital-gains tax (a 1031 exchange can defer both). Figures are a year-1 estimate at your 24.0% rate — not tax advice; consult a CPA.
Schools (NCES district)
- District
- Providence
- NCES district ID
- 4400900
- Math proficiency
- 8% ▼ -4.00%
- Reading proficiency
- 16% ▼ -2.00%
- Median HH income
- $38,197
- Composite
- 10.12/100
- National rank
- #9803
- State rank
- #34 of 39 in RI
Livability — Providence
- Score
- 84/100
- State rank
- #2
- US rank
- #794
Category grades
Schools grade is shown separately in the Schools card above.
Census & demographics
- Census place
- Providence, RI
- County
- Providence County · 548,917 people
- City population
- 212,734
- Metro
- Providence-Warwick, RI-MA
- Population (ZIP)
- 11,836
- Household income
- $64,476
- Rent vs Own
- Severe rent burden
- 1009.0
Population outlook (Providence County) Hauer SSP2
- Today (2025)
- 653,469 people
- By 2030
- 660,819 · +1.1%
- By 2040
- 672,747 · +3.0%
- By 2050
- 683,741 · +4.6%
- By 2075
- 720,435 · +10.2%
- By 2100
- 741,582 · +13.5%
Race, ethnicity, and origin ACS 2023
- Neighborhood character
- Diverse neighborhood (Simpson 0.57)
- Race & ethnicity
- White 63% Hispanic / Latino 14% Asian 13% Black 8% Two or more races 6%
- Hispanic origin (detail)
- Mexican 1% Puerto Rican 3% Dominican 3%
- Common ancestry
- Lithuanian 6% Russian 3% Romanian 3%
- Foreign-born
- 21% · Canada, China, Jamaica
- Languages at home
- 70% English-only · Spanish 12% Other Indo-European 8% Chinese 6%
Political lean MEDSL · Providence
- 2024 margin
- D (+14.4) · D 56.1% · R 41.7% · Other 2.2%
- 2008→2024 swing
- -20.0pp toward R · 2008: 34.4pp · 2024: 14.4pp
- All cycles
- 2024: D+14.4 2020: D+22.9 2016: D+21.2 2012: D+34.9 2008: D+34.4
Not yet ingested
- Civics
- —
Market trends
- HPI YoY
- ▼ -1.08%
- Current HPI
- 241.4152
- Rent YoY
- ▲ 4.73%
- Metro
- Providence-Warwick, RI-MA
- State GDP YoY
- ▲ 2.25%
- F500 in state
- 10
Industry mix (Fortune 500 HQ in RI)
| Industry | F500 HQs | Revenue |
|---|---|---|
| Healthcare | 1 | $373B |
|
||
| Food Distribution | 1 | $31B |
|
||
| Aerospace / Defense | 1 | $14B |
|
||
| Financial Services | 1 | $8B |
|
||
| Consumer Goods | 1 | $4B |
|
||
Price history
+129.5% since first listed9 events — show timeline
- 2026-05-17 Contingent — RIS
- 2026-04-13 Price Changed $895,000 RIS
- 2025-10-23 Listed $975,000 RIS
- 2025-03-06 Rental Removed $1,425 RENTALBEAST
- 2025-03-03 Listed for Rent $1,425 RENTALBEAST
- 2022-05-19 Price Changed $1,500 RENT.
- 2016-03-29 Sold (Public Records) $325,000 Public Records
- 2012-12-15 Listing Removed — RIS
- 2012-06-15 Listed $389,900 RIS
Property tax history
-0.9%/yrLatest (2025): $10,877 · +10.6% YoY. Source: county tax records.
Cash-flow waterfall
monthlySold comps — $/sqft
last 12 mo · ≤1 miLoading sold comps…