 Multi-family
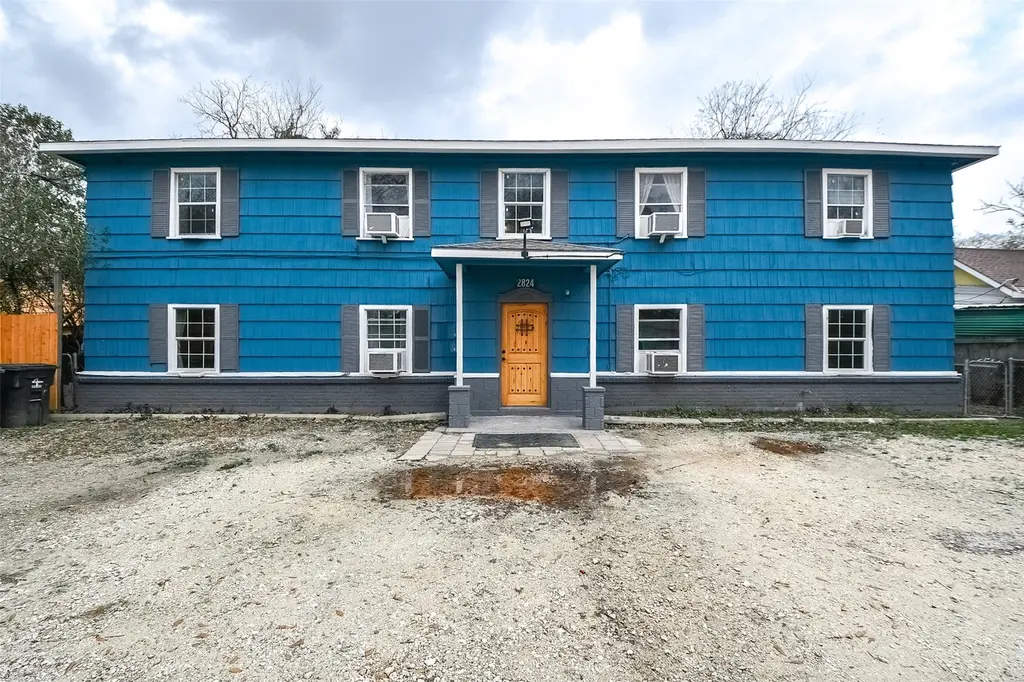
2824 Dalton St · Houston, TX
Flood risk 1/10 · Minimal
- FEMA flood zone
- X (unshaded)
- Chance of flooding over 30 yrs
- 0.0%
- Est. flood insurance / yr
- $507 – $1,088
Fire risk 1/10 · Minimal
- Est. fire insurance / yr
- $1,222 – $2,270
Heat risk 9/10 · Severe
- Hot days now (above 109°F)
- 7 days/yr
- Hot days in 30 yrs
- 24 days/yr
Wind risk 9/10 · Severe
- Chance of severe wind over 30 yrs
- 99.0%
Air-quality risk 2/10 · Minimal
- Unhealthy air days now
- 2 days/yr
- Unhealthy air days in 30 yrs
- 2 days/yr
Risk factors via First Street. Map © Google.
Why this score? — see what drove the D+ grade
The composite is a weighted blend of 9 inputs, each scored 0–100. Each bar is that input's sub-score; the figure is the points it added to the 100-point composite (weight × sub-score).
- Cash flow +18.3/30.0
- ARV discount +9.2/15.0
- DSCR +5.8/10.0
- 1% rule +4.5/10.0
- Livability +3.7/5.0
- Rent growth +2.7/5.0
- Schools +2.7/10.0
- Condition / age +2.5/5.0
- Appreciation +0.0/10.0
$410,000
🖨 Deal sheet (PDF) 📄 Offer letter ✓ Due diligence
Multi-family units
County records classify this as Multi-Family (2-4 Unit). Listing-text estimate: 1 unit. estimate disagrees with records
Listing remarks
Location, Location, Location! Incredible opportunity to own a fully occupied, income-generating 4plex near Hobby Airport! Each of the four 2-bed, 1-bath units has been updated with granite countertops, modern cabinetry, stylish flooring (wood, tile & LVP), and fresh paint. Unit 1 was completely remodeled. Property updates include new appliances in select units, all A/C window units, city-to-building plumbing, water heaters (all within 3 years), and updated fan fixtures. Passed recent habitability inspection. Located across from a police officer’s residence in a stable B-/C+ neighborhood. Private entries, shared laundry access, and no HOA. Flood Zone X – No flood insurance
Key facts
- Completely remodeled
- Modern cabinetry
- Income generating
Tags
Property features AI
Exterior
- Utilities: Cable available; Electricity available; Natural gas available
- Home design: Residential income property; Built in 1955
- Construction: Vinyl siding; Composition roof; Originally built in 1955
- Exterior features: Private entrance; Cleared lot; Located in a subdivision
Interior
- Kitchen: Granite counters (kitchen surfaces)
- Bedrooms: Four 2-bedroom units (unit breakdown: 1 unit with 2 beds, 2 units with 2 beds, 3 units with 2 beds, 4 units with 2 beds) — total of 4 units
- Flooring: Plank; Tile; Vinyl; Wood / Hardwood
- Bathrooms: One full bathroom (per unit listing indicates 1 full bathroom present)
- Heating & cooling: Window-unit heating; Window-unit cooling
- Interior features: Granite counters; Window treatments / coverings; Ceiling fan(s)
- Laundry & utility: Common area laundry
Neighborhood map
What this means for you Summary
Snapshot
- This is a 4-bed/4.0-bath multifamily listed at $410k.
Deal economics
- At list price, monthly cash flow is $377 ($5k/yr) — positive.
- The deal already cash-flows at list — no discount required.
- To meet the 1% rule (rent ≥ 1% of price), the offer needs to be $391k (4.7% below list).
- Recommended offer: $391k (4.7% below list) — sets the bar for 1% rule.
- Cap rate 7.4% vs local median 3.1% in Houston — top-decile yield for the area; either an underpriced asset or a hidden risk that comps aren't pricing in. Stress-test before assuming the spread holds.
Location & tenants
- Location reads 74/100 on livability (#184 in TX, #4,771 nationally) — a middle-class / working-renter tenant base. Strengths: amenities A+, cost of living A+, housing A+; Watch: crime F.
- Houston ISD (urban): math 27% / reading 35% proficiency, ranked #593 of 826 in TX (top 72%) — families likely to look elsewhere, expect single-tenant / working-renter base with shorter leases; 71% free/reduced lunch — lower-income household profile, screen leases tightly.
- Zoned schools: Deady Middle (math 8% / reading 21%, grade F, #1,583 of 1,662 statewide, top 96%, 588 students, 96% FRL); Chavez H S (math 26% / reading 26%, grade F, #1,234 of 1,632 statewide, top 76%, 2,272 students, 93% FRL) — zoned schools average 94% FRL vs 71% district-wide (23 pts higher); higher-poverty schools than district average — tighter screening recommended.
- Market conditions: Rents flat; 88 active listings in the ZIP; 29,883 units permitted in Harris County in 2024 (8,621 in 5+ unit buildings).
- At $3,909/mo this rent would consume 92% of the median local household income ($51k/yr) (locally 1601% of renters already pay >50% of income on rent) — very limited rent-growth headroom before tenants either downsize or default.
Forward outlook
- Local home prices are declining (-3.0%/yr); year-one equity from $3k of loan paydown is wiped out by about $12k of value loss. Plan a longer hold.
- Harris County population projected at +47% by 2050 — long-run rental-demand tailwind backs the buy-and-hold thesis.
Negotiation context
- It's been on market 49 days — a 3% lower offer ($398k) is reasonable based on typical stale-listing flexibility.
- 10 sale attempts since 6y ago with the ask held roughly flat each time — persistent listings suggest the price (not the market) is what's stuck; bring a comps-based counter.
Risks & watch-outs
- Watch-outs: built in 1955 — expect roof / HVAC / electrical / plumbing capex.
- Climate carrying-cost: severe wind risk, 99% chance of damaging wind over 30y; extreme-heat days projected 7→24/yr by 2055 (HVAC capex compounding) — expect insurance premiums to compound above CPI over the hold.
Questions for the listing agent
- It's been on market 49 days. Have you received any prior offers? Is the seller open to a 5% concession, seller financing, or rate buy-down credit?
- Built in 1955 — when were the roof, HVAC, electrical panel, plumbing, and water heater last replaced?
- Is there a deadline driving the sale (1031 exchange, divorce, estate, relocation)? That informs how much negotiation room exists.
- Schools are D-rated, which usually means shorter tenancies and higher turnover. Who's the typical renter profile here, and what's been the actual vacancy rate?
- Crime grade is F in this area — have there been break-ins, vandalism, or insurance claims at this property in the last 3 years? What carrier currently insures it and at what premium?
- The area grade is low — what's the realistic commute time and amenity access for the typical tenant pool here? Any planned neighborhood developments (good or bad) we should know about?
- What's the average days-on-market for RENTAL listings here right now (not sales)? A rising rental-DOM trend means longer vacancies and softer asking-rent achievability than the comps imply.
- What's the recent tenant-quality profile in this submarket — average credit score on applications, eviction rate, late-payment / NSF rate, and stable-employment percentage? A property-management company in the area should have these aggregated.
- How much new apartment / multifamily construction is in the pipeline within 1–3 miles? Heavy new supply (>2% of stock underway) typically softens rents 12–24 months out; light construction supports rent growth.
Investment metrics
- 1% rule
- 0.95% ✗
- Cap rate
- 7.40%
- Cash-on-cash
- 3.95%
- DSCR
- 1.18
- GRM
- 8.7
CMA / ARV
- ARV (median comp)
- $426,171
- List price
- $410,000
- Delta
- -3.79%
- Verdict
- FAIR
- Comps
- 5 within 1.0 mi
Projected returns pro-forma
-3.0% appreciation · 0.88% rent growth · sell at horizon
- IRR
- -12.4%
- Equity multiple
- 0.56×
- Total profit
- $-50,577
- Equity at exit
- $61,132
- IRR
- -6.8%
- Equity multiple
- 0.61×
- Total profit
- $-45,263
- Equity at exit
- $35,449
Cash invested: $114,800 (down + closing). Projections, not guarantees.
Landlord ↔ Tenant lean methodology
- Overall (STATE)
- 87 Strongly Landlord-Friendly
- State Texas
- 87 Strongly Landlord-Friendly · R+5
- County
- — inherits STATE
- City
- — inherits STATE
ZIP-level market 77017
- Home prices YoY
- -21.7%
- Rents YoY
- 0.9%
- Active inventory
- 88
- Price-to-rent
- 35.0×
Monthly cashflow live
- Estimated rent
- $3,909 high interval (Pro) →
- Mortgage (P&I)
- −$2,150
- Tax from tax record
- −$390 /mo · $4,676/yr
- Insurance
- −$171
- HOA
- −$0
- Vacancy / Maint / Mgmt
- −$821
- Net cashflow
- $377
Break-even live
Sensitivity live
| Price | -10% $610 | -5% $494 | +0% $377 | +5% $261 | +10% $145 |
|---|---|---|---|---|---|
| Rent | -10% $69 | -5% $223 | +0% $377 | +5% $532 | +10% $686 |
| Rate | -1.0pp $584 | -0.5pp $482 | base $377 | +0.5pp $271 | +1.0pp $163 |
4-unit breakdown (identical units grouped — click to expand)
| Units | Beds | Baths | Est. rent |
|---|---|---|---|
| 4× units | 2 | 1 | $3,908 |
| #1 | 2 | 1 | $977 |
| #2 | 2 | 1 | $977 |
| #3 | 2 | 1 | $977 |
| #4 | 2 | 1 | $977 |
| Total (4 units) | $3,909 | ||
UW: 25.0% down · 7.5% · 30yr · 1.5% tax · 5.0% vac · 8.0% maint · 8.0% mgmt
Financing live
Cash to close
- Down payment
- $102,500
- Closing costs
- $12,300
- Reserves months
- —
- Total cash needed
- —
Loan-product check · same deal, 3 products live
Conventional
25% down · 7.5% · 30yr
- Down + closing
- —
- Monthly P&I
- —
- Monthly cashflow
- —
- DSCR
- —
- Eligible?
- —
Personal DTI + credit; lowest rate.
DSCR
20% down · 8.5% · 30yr
- Down + closing
- —
- Monthly P&I
- —
- Monthly cashflow
- —
- DSCR
- —
- Eligible?
- —
No personal income docs; deal must DSCR.
Hard money
10% down · 12.0% · 12mo
- Down + closing
- —
- Monthly P&I
- —
- Monthly cashflow
- —
- DSCR
- —
- Eligible?
- —
Short-term bridge; refi at stabilization.
Listing history 39 events
-
2026-06-18days on market $410,000 Active 49 DOM
-
2026-06-17days on market $410,000 Active 48 DOM
-
2026-06-16days on market $410,000 Active 47 DOM
-
2026-06-15days on market $410,000 Active 46 DOM
-
2026-06-13days on market $410,000 Active 44 DOM
-
2026-06-10days on market $410,000 Active 40 DOM
-
2026-06-08days on market $410,000 Active 39 DOM
-
2026-06-07days on market $410,000 Active 38 DOM
-
2026-06-04days on market $410,000 Active 35 DOM
-
2026-06-01days on market $410,000 Active 32 DOM
-
2026-05-31days on market $410,000 Active 31 DOM
-
2026-04-30historical
-
2026-04-30$410,000 Active 788-char remark
-
2026-04-14$410,000 Active
-
2026-04-14historical
-
2026-02-11$410,000 Active
-
2025-10-17historical
-
2025-08-18$445,000 Active
-
2025-08-18historical
-
2025-06-10$445,000 Active
-
2025-06-10historical
-
2025-05-06$450,000 Active
-
2025-05-04historical
-
2024-09-21historical
-
2024-06-27status Active
-
2024-06-16status Option Pending
-
2024-04-11$450,000 Active
-
2021-08-21historical
-
2021-06-18$525,000 Active
-
2020-12-11soldstatus
-
2020-10-20soldstatus
-
2020-10-19soldstatus Sold
-
2020-10-01status Pending
-
2020-09-17price $349,900
-
2020-09-11$374,900 Active
-
2020-08-20soldstatus
-
2020-08-17soldstatus
-
2019-01-03soldstatus
-
1999-03-23soldstatus
ⓘ Source: listings_history table (triggers on properties + properties_extension) + one-shot
backfill from property_details.listing_events for pre-trigger history.
Tax reassessment forecast TX · Resets to sale price
- Current annual tax
- $4,676 · $390/mo
- Projected year-2 tax
- $7,503 · $625/mo
- Expected delta
- +$2,827/yr (+$236/mo · 60.4%)
ⓘ Screening estimate from a state-policy table — verify with the county assessor before closing.
Climate risk First Street
- Flood 1/10 Low FEMA zone X (unshaded) · 0% chance over 30 yrs
- Wildfire 1/10 Low
- Heat 9/10 Extreme 7 d/yr ≥109°F today · 24 d/yr by 30 yrs out
- Wind 9/10 Extreme 99% chance of damaging wind over 30 yrs
- Air quality 2/10 Low 2 unhealthy d/yr today · 2 by 30 yrs out
Nearby sold comps map
Loading sold comps map…
Walkable amenities ~0.75 mi
Loading nearby amenities…
Taxation est. · year 1
- Rental income
- $46,908
- − Mortgage interest
- −$22,966
- − Property taxes
- −$4,676
- − Insurance
- −$2,050
- − Repairs & maintenance
- −$3,753
- − Management
- −$3,753
- − Depreciation
- −$11,927
- Taxable loss
- −$2,217
- Est. tax savings @ 24.0%
- +$532
- After-tax cash flow
- $5,062/yr
For passive investors: Depreciation is non-cash, so a rental often shows a tax loss while cash-flowing — sheltering income. Rental losses are passive: they offset passive income freely, and up to $25,000/yr can offset ordinary (W-2) income if you actively participate and your MAGI is under $100k (phasing out to $0 by $150k); unused losses carry forward. On sale, claimed depreciation is recaptured at up to 25%, and gains may owe capital-gains tax (a 1031 exchange can defer both). Figures are a year-1 estimate at your 24.0% rate — not tax advice; consult a CPA.
Schools (NCES district)
- District
- Houston ISD
- NCES district ID
- 4823640
- Math proficiency
- 27% ▼ -18.00%
- Reading proficiency
- 35% ▼ -6.00%
- Median HH income
- $46,054
- Composite
- 26.63/100
- National rank
- #7173
- State rank
- #593 of 826 in TX
Livability — Houston
- Score
- 74/100
- State rank
- #184
- US rank
- #4771
Category grades
Schools grade is shown separately in the Schools card above.
Census & demographics
- Census place
- Houston, TX
- County
- Harris County · 4,702,590 people
- City population
- 3,226,434
- Metro
- Houston-The Woodlands-Sugar Land, TX
- Population (ZIP)
- 29,640
- Household income
- $51,079
- Rent vs Own
- Severe rent burden
- 1601.0
Population outlook (Harris County) Hauer SSP2
- Today (2025)
- 5,571,493 people
- By 2030
- 6,089,821 · +9.3%
- By 2040
- 7,142,806 · +28.2%
- By 2050
- 8,185,864 · +46.9%
- By 2075
- 10,574,329 · +89.8%
- By 2100
- 12,109,958 · +117.4%
Race, ethnicity, and origin ACS 2023
- Neighborhood character
- Predominantly Hispanic (81%)
- Race & ethnicity
- Hispanic / Latino 81% Two or more races 38% White 7% Black 6% Asian 4%
- Hispanic origin (detail)
- Mexican 65%
- Common ancestry
- Lithuanian 1%
- Foreign-born
- 39% · Canada, Vietnam
- Languages at home
- 32% English-only · Spanish 63% Vietnamese 4%
Political lean MEDSL · Harris
- 2024 margin
- Lean D (+5.5) · D 52.0% · R 46.4% · Other 1.6%
- 2008→2024 swing
- +3.9pp toward D · 2008: 1.6pp · 2024: 5.5pp
- All cycles
- 2024: D+5.5 2020: D+13.3 2016: D+12.4 2012: D+0.1 2008: D+1.6
Not yet ingested
- Civics
- —
Market trends
- HPI YoY
- ▼ -76.86%
- Current HPI
- 277.3656
- Rent YoY
- ▲ 0.88%
- Metro
- Houston-The Woodlands-Sugar Land, TX
- State GDP YoY
- ▲ 3.95%
- F500 in state
- 110
Industry mix (Fortune 500 HQ in TX)
| Industry | F500 HQs | Revenue |
|---|---|---|
| Energy | 16 | $1,198B |
|
||
| Technology | 5 | $198B |
|
||
| Engineering / Construction | 4 | $72B |
|
||
| Energy Services | 3 | $60B |
|
||
| Utilities | 3 | $41B |
|
||
| Healthcare | 2 | $330B |
|
||
Price history
+9.4% since first listed28 events — show timeline
- 2026-04-30 Listed $410,000 HARMLS
- 2026-04-30 Listing Removed — HARMLS
- 2026-04-14 Listing Removed — HARMLS
- 2026-04-14 Listed $410,000 HARMLS
- 2026-02-11 Listed $410,000 HARMLS
- 2025-10-17 Listing Removed — HARMLS
- 2025-08-18 Listing Removed — HARMLS
- 2025-08-18 Listed $445,000 HARMLS
- 2025-06-10 Listing Removed — HARMLS
- 2025-06-10 Listed $445,000 HARMLS
- 2025-05-06 Listed $450,000 HARMLS
- 2025-05-04 Coming Soon — HARMLS
- 2024-09-21 Listing Removed — HARMLS
- 2024-06-27 Relisted — HARMLS
- 2024-06-16 Pending — HARMLS
- 2024-04-11 Listed $450,000 HARMLS
- 2021-08-21 Listing Removed — HARMLS
- 2021-06-18 Listed $525,000 HARMLS
- 2020-12-11 Sold (Public Records) — Public Records
- 2020-10-20 Sold (Public Records) — Public Records
- 2020-10-19 Sold (MLS) — HARMLS
- 2020-10-01 Pending — HARMLS
- 2020-09-17 Price Changed $349,900 HARMLS
- 2020-09-11 Listed $374,900 HARMLS
- 2020-08-20 Sold (Public Records) — Public Records
- 2020-08-17 Sold (Public Records) — Public Records
- 2019-01-03 Sold (Public Records) — Public Records
- 1999-03-23 Sold (Public Records) — Public Records
Property tax history
+0.8%/yrLatest (2024): $4,676 · -23.1% YoY. Source: county tax records.
Cash-flow waterfall
monthlySold comps — $/sqft
last 12 mo · ≤1 miLoading sold comps…