 Duplex
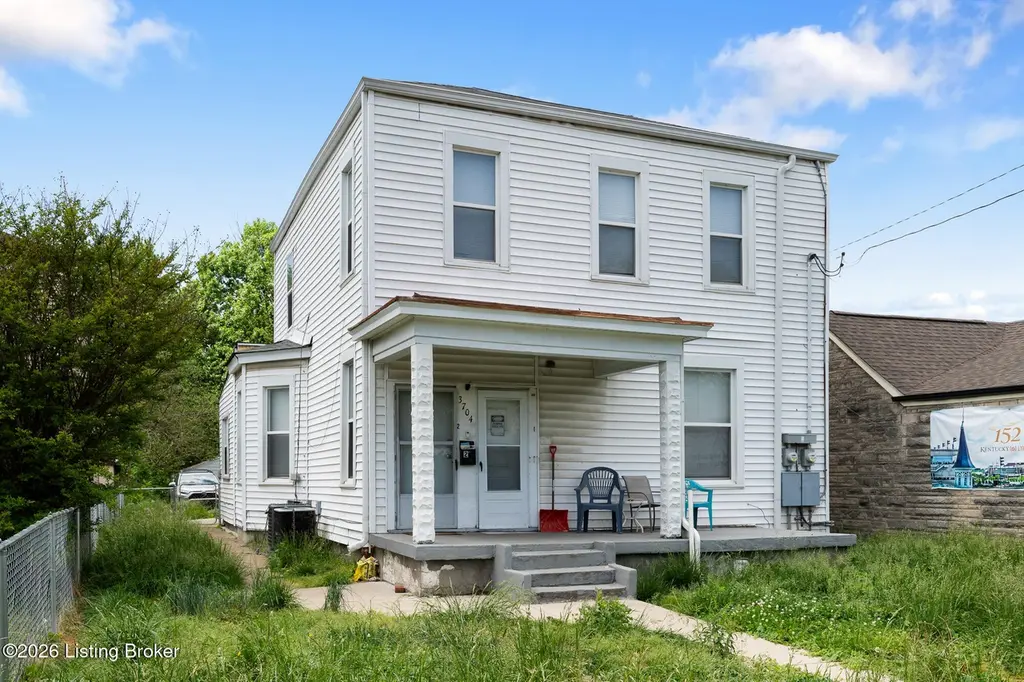
3704 Taylor Blvd · Louisville, KY
Flood risk 1/10 · Minimal
- FEMA flood zone
- X (unshaded)
- Chance of flooding over 30 yrs
- 0.0%
- Est. flood insurance / yr
- $507 – $1,088
Fire risk 1/10 · Minimal
- Est. fire insurance / yr
- $839 – $1,559
Heat risk 5/10 · Moderate
- Hot days now (above 105°F)
- 7 days/yr
- Hot days in 30 yrs
- 19 days/yr
Wind risk 2/10 · Minimal
- Chance of severe wind over 30 yrs
- 1.0%
Air-quality risk 2/10 · Minimal
- Unhealthy air days now
- 1 days/yr
- Unhealthy air days in 30 yrs
- 3 days/yr
Risk factors via First Street. Map © Google.
Why this score? — see what drove the C+ grade
The composite is a weighted blend of 9 inputs, each scored 0–100. Each bar is that input's sub-score; the figure is the points it added to the 100-point composite (weight × sub-score).
- Cash flow +26.3/30.0
- DSCR +8.9/10.0
- ARV discount +7.5/15.0
- 1% rule +5.8/10.0
- Rent growth +3.8/5.0
- Livability +3.2/5.0
- Condition / age +2.5/5.0
- Schools +2.3/10.0
- Appreciation +0.0/10.0
$219,900
🖨 Deal sheet 📄 Offer letter ✓ Due diligence
Multi-family units
County records classify this as Multi-Family (2-4 Unit). Listing-text estimate: 2 units. confirmed
Listing remarks
Come check out this great, income producing duplex with a park view. This property would be a fantastic house hack, renting one unit to pay the mortgage and living in the other. Property had several updates in 2021. LGE billed separately, water is split between the units. Seller is an LLC and members of the LLC are or have been licensed realtors in Ky.
Key facts
- Park view
- Several updates
- 7,000 sq ft lot
Tags
Property features AI
Finance
- Other: Building area reported as 2,418 (source: Other); Lot dimensions approximately 40 x 145 (0.16 acre)
- Financial info: First-level unit rent listed at $1,100; Second-level unit rent listed at $900
- HOA & community: No association fee
Exterior
- Parking: 4 parking spaces (parking area not covered); Parking access from alley (park in back off alley)
- Utilities: Electricity connected; Natural gas available; Owner pays water and sewer; Tenants pay electric and gas
- Home design: Duplex; Two levels; Built in 1900; Shingle roof; Vinyl siding
- Construction: Vinyl siding construction; Shingle roof; Built in 1900
- Exterior features: Sidewalk; No additional exterior features listed
Interior
- Kitchen: Kitchen on the first level; Kitchen on the second level; Range provided on both levels; Refrigerator provided on both levels
- Bedrooms: 4 bedrooms total (2 bedrooms on the first level, 2 bedrooms on the second level)
- Bathrooms: 2 full bathrooms (1 on the first level, 1 on the second level)
- Heating & cooling: Forced air heating (natural gas); Two furnaces; Central air conditioning; Two HVAC units
- Interior features: Traditional architectural style; No basement
- Laundry & utility: Laundry area on the first level; Additional storage available; Separate meters
Neighborhood map
What this means for you Summary
Snapshot
- This is a 2 × 2-bed/1.0-bath units multifamily listed at $220k.
Deal economics
- At list price, monthly cash flow is $564 ($7k/yr) — positive. Per door: $282/mo.
- The deal already cash-flows at list — no discount required.
- Meets the 1% rule at list price ($2k rent vs $220k).
- Recommended offer: $213k (3.0% below list) — sets the bar for market timing.
- Cap rate 9.4% vs local median 5.0% in Louisville — top-decile yield for the area; either an underpriced asset or a hidden risk that comps aren't pricing in. Stress-test before assuming the spread holds.
Location & tenants
- Location reads 63/100 on livability (#333 in KY) — a middle-class / working-renter tenant base. Strengths: cost of living A+, housing A+; Watch: employment C-, health & safety D+, schools D-.
- Jefferson County (urban): math 19% / reading 35% proficiency, ranked #121 of 165 in KY (top 73%) — low school quality limits family demand, transient renter base, plan for 1-2y turnover.
- Market conditions: Rents rising fast (+5.2%/yr); 121 active listings in the ZIP; 6 comparable units currently listed for rent nearby; rentals at typical pace (median 24d on market — plan ~3-4 weeks tenant-placement turnaround); lower-income renter base — watch delinquency; 2,836 units permitted in Jefferson County in 2024 (1,558 in 5+ unit buildings).
- At $2,370/mo this rent would consume 65% of the median local household income ($44k/yr) (locally 997% of renters already pay >50% of income on rent) — very limited rent-growth headroom before tenants either downsize or default.
Forward outlook
- Local home prices are declining (-3.0%/yr); year-one equity from $2k of loan paydown is wiped out by about $7k of value loss. Plan a longer hold.
- Jefferson County population projected at +13% by 2050 — modest demand growth; plan on rents tracking national, not racing it.
- At projected returns (-3.0% appreciation + 5.2% rent growth), your $62k cash investment doubles in ~9 years — after that, you're playing with house money.
Negotiation context
- It's been on market 43 days — a 3% lower offer ($213k) is reasonable based on typical stale-listing flexibility.
- 5 sale attempts since 16y ago; this cycle's ask has dropped $20k (8%) from the opening price — seller is motivated, your offer sets the floor, not the list.
- Current owner paid $60k; list at $220k implies a 266% gain — meaningful room to come down on a strong offer.
Risks & watch-outs
- Watch-outs: built in 1900 — expect roof / HVAC / electrical / plumbing capex.
- Climate carrying-cost: extreme-heat days projected 7→19/yr by 2055 (HVAC capex compounding) — expect insurance premiums to compound above CPI over the hold.
Questions for the listing agent
- It's been on market 43 days. Have you received any prior offers? Is the seller open to a 3% concession, seller financing, or rate buy-down credit?
- Can we see the unit-by-unit rent roll, current vacancy, and any below-market leases? What's the average tenancy length?
- What capital expenditures (roof, boiler, parking lot, exteriors) have been made in the last 5 years, and what's planned in the next 2?
- Built in 1900 — when were the roof, HVAC, electrical panel, plumbing, and water heater last replaced?
- Is there a deadline driving the sale (1031 exchange, divorce, estate, relocation)? That informs how much negotiation room exists.
- Schools are D-rated, which usually means shorter tenancies and higher turnover. Who's the typical renter profile here, and what's been the actual vacancy rate?
- Crime grade is F in this area — have there been break-ins, vandalism, or insurance claims at this property in the last 3 years? What carrier currently insures it and at what premium?
- What's the average days-on-market for RENTAL listings here right now (not sales)? A rising rental-DOM trend means longer vacancies and softer asking-rent achievability than the comps imply.
- What's the recent tenant-quality profile in this submarket — average credit score on applications, eviction rate, late-payment / NSF rate, and stable-employment percentage? A property-management company in the area should have these aggregated.
- How much new apartment / multifamily construction is in the pipeline within 1–3 miles? Heavy new supply (>2% of stock underway) typically softens rents 12–24 months out; light construction supports rent growth.
Investment metrics
- 1% rule
- 1.08% ✓
- Cap rate
- 9.37%
- Cash-on-cash
- 11.00%
- DSCR
- 1.49
- GRM
- 7.7
CMA / ARV
No comps found within radius.
Projected returns pro-forma
-3.0% appreciation · 5.16% rent growth · sell at horizon
- IRR
- 2.3%
- Equity multiple
- 1.09×
- Total profit
- $5,487
- Equity at exit
- $32,788
- IRR
- 13.7%
- Equity multiple
- 2.19×
- Total profit
- $73,256
- Equity at exit
- $19,013
Cash invested: $61,572 (down + closing). Projections, not guarantees.
Landlord ↔ Tenant lean methodology
- Overall (STATE)
- 83 Strongly Landlord-Friendly
- State Kentucky
- 83 Strongly Landlord-Friendly · R+16
- County
- — inherits STATE
- City
- — inherits STATE
ZIP-level market 40215
- Home prices YoY
- -34.4%
- Rents YoY
- 5.2%
- Active inventory
- 121
- Price-to-rent
- 15.5×
Monthly cashflow live
- Estimated rent
- $2,370 high interval (Pro) →
- Mortgage (P&I)
- −$1,153
- Tax from tax record
- −$63 /mo · $756/yr
- Insurance
- −$92
- HOA
- −$0
- Vacancy / Maint / Mgmt
- −$498
- Net cashflow
- $564
Break-even live
2-unit breakdown (identical units grouped — click to expand)
| Units | Beds | Baths | Est. rent |
|---|---|---|---|
| 2× units | 2 | 1 | $2,370 |
| #1 | 2 | 1 | $1,185 |
| #2 | 2 | 1 | $1,185 |
| Total (2 units) | $2,370 | ||
UW: 25.0% down · 7.5% · 30yr · 1.5% tax · 5.0% vac · 8.0% maint · 8.0% mgmt
Financing live
Cash to close
- Down payment
- $54,975
- Closing costs
- $6,597
- Reserves months
- —
- Total cash needed
- —
Loan-product check · same deal, 3 products live
Conventional
25% down · 7.5% · 30yr
- Down + closing
- —
- Monthly P&I
- —
- Monthly cashflow
- —
- DSCR
- —
- Eligible?
- —
Personal DTI + credit; lowest rate.
DSCR
20% down · 8.5% · 30yr
- Down + closing
- —
- Monthly P&I
- —
- Monthly cashflow
- —
- DSCR
- —
- Eligible?
- —
No personal income docs; deal must DSCR.
Hard money
10% down · 12.0% · 12mo
- Down + closing
- —
- Monthly P&I
- —
- Monthly cashflow
- —
- DSCR
- —
- Eligible?
- —
Short-term bridge; refi at stabilization.
Rent comps 6 comps
| Address | Beds | Baths | Sqft | Rent | $/sqft | DOM | Units | Dist |
|---|---|---|---|---|---|---|---|---|
| 4010 Taylor Blvd Louisville, KY | 4.0 | 2.0 | 1612 | $3,000 | $1.86 | 16d | 1 | 0.36mi |
| 4513 S 6th St Louisville, KY | 3.0 | 2.0 | 1581 | $2,650 | $1.68 | 24d | 1 | 0.81mi |
| 3830 Southern Pkwy Louisville, KY | 4.0 | 2.5 | 3332 | $2,100 | $0.63 | 16d | 1 | 1.11mi |
| 519 Forum Ave Louisville, KY | 3.0 | 1.5 | 1693 | $1,600 | $0.95 | 24d | 1 | 1.37mi |
| 3102 Grant Ave Louisville, KY | 4.0 | 2.0 | 1603 | $1,595 | $1.00 | 24d | 1 | 1.38mi |
| 1505 Homeview Dr Louisville, KY | 5.0 | 2.0 | 1949 | $1,850 | $0.95 | 16d | 1 | 1.47mi |
Listing history 26 events
-
2026-06-18days on market $219,900 Active 43 DOM
-
2026-06-17days on market $219,900 Active 42 DOM
-
2026-06-16days on market $219,900 Active 41 DOM
-
2026-06-15days on market $219,900 Active 40 DOM
-
2026-06-13days on market $219,900 Active 38 DOM
-
2026-06-10days on market $219,900 Active 35 DOM
-
2026-06-09days on market $219,900 Active 34 DOM
-
2026-06-08days on market $219,900 Active 33 DOM
-
2026-06-07days on market $219,900 Active 32 DOM
-
2026-06-03days on market $219,900 Active 28 DOM
-
2026-06-02days on market $219,900 Active 27 DOM
-
2026-06-01days on market $219,900 Active 26 DOM
-
2026-05-31days on market $219,900 Active 25 DOM
-
2026-05-16price $219,900
-
2026-05-06$240,000 Active
-
2021-06-14soldstatus $60,000
-
2018-03-27historical
-
2017-09-27$74,900 Active
-
2017-09-23historical
-
2017-03-28$88,900 Active
-
2017-03-28price $79,900
-
2010-09-13historical
-
2010-09-12historical
-
2010-03-12$99,900
-
2010-03-12$99,900
-
2003-12-30soldstatus $83,200
ⓘ Source: listings_history table (triggers on properties + properties_extension) + one-shot
backfill from property_details.listing_events for pre-trigger history.
Tax reassessment forecast KY · Resets to sale price
- Current annual tax
- $756 · $63/mo
- Projected year-2 tax
- $1,891 · $158/mo
- Expected delta
- +$1,135/yr (+$95/mo · 150.2%)
ⓘ Screening estimate from a state-policy table — verify with the county assessor before closing.
Climate risk First Street
- Flood 1/10 Low FEMA zone X (unshaded) · 0% chance over 30 yrs
- Wildfire 1/10 Low
- Heat 5/10 Major 7 d/yr ≥105°F today · 19 d/yr by 30 yrs out
- Wind 2/10 Low 100% chance of damaging wind over 30 yrs
- Air quality 2/10 Low 1 unhealthy d/yr today · 3 by 30 yrs out
Nearby sold comps map
Loading sold comps map…
Walkable amenities ~0.75 mi
Loading nearby amenities…
Taxation est. · year 1
- Rental income
- $28,440
- − Mortgage interest
- −$12,318
- − Property taxes
- −$756
- − Insurance
- −$1,100
- − Repairs & maintenance
- −$2,275
- − Management
- −$2,275
- − Depreciation
- −$6,397
- Taxable income
- $3,319
- Est. tax owed @ 24.0%
- −$797
- After-tax cash flow
- $5,977/yr
For passive investors: Depreciation is non-cash, so a rental often shows a tax loss while cash-flowing — sheltering income. Rental losses are passive: they offset passive income freely, and up to $25,000/yr can offset ordinary (W-2) income if you actively participate and your MAGI is under $100k (phasing out to $0 by $150k); unused losses carry forward. On sale, claimed depreciation is recaptured at up to 25%, and gains may owe capital-gains tax (a 1031 exchange can defer both). Figures are a year-1 estimate at your 24.0% rate — not tax advice; consult a CPA.
Schools (NCES district)
- District
- Jefferson County
- NCES district ID
- 2102990
- Math proficiency
- 19% ▼ -17.00%
- Reading proficiency
- 35% ▼ -11.00%
- Median HH income
- $47,885
- Composite
- 23.45/100
- National rank
- #7884
- State rank
- #121 of 165 in KY
Livability — Louisville
- Score
- 63/100
- State rank
- #333
- US rank
- #15887
Category grades
Schools grade is shown separately in the Schools card above.
Census & demographics
- Census place
- Louisville, KY
- County
- Jefferson County · 790,184 people
- City population
- 769,292
- Metro
- Louisville/Jefferson County, KY-IN
- Population (ZIP)
- 20,532
- Household income
- $43,725
- Rent vs Own
- Severe rent burden
- 997.0
Population outlook (Jefferson County) Hauer SSP2
- Today (2025)
- 823,112 people
- By 2030
- 849,343 · +3.2%
- By 2040
- 895,696 · +8.8%
- By 2050
- 933,630 · +13.4%
- By 2075
- 1,028,262 · +24.9%
- By 2100
- 1,072,675 · +30.3%
Race, ethnicity, and origin ACS 2023
- Neighborhood character
- Diverse neighborhood (Simpson 0.63)
- Race & ethnicity
- White 51% Black 33% Two or more races 11% Hispanic / Latino 6% Asian 2%
- Hispanic origin (detail)
- Mexican 2% Cuban 3%
- Common ancestry
- Slovak 1% Romanian 1% Serbian 1%
- Foreign-born
- 9% · Canada, Vietnam
- Languages at home
- 88% English-only · Spanish 5% Other Indo-European 2% Arabic 1%
Political lean MEDSL · Jefferson
- 2024 margin
- D (+16.6) · D 57.4% · R 40.9% · Other 1.7%
- 2008→2024 swing
- +4.5pp toward D · 2008: 12.0pp · 2024: 16.6pp
- All cycles
- 2024: D+16.6 2020: D+20.1 2016: D+13.3 2012: D+11.1 2008: D+12.0
Not yet ingested
- Civics
- —
Market trends
- HPI YoY
- ▼ -119.35%
- Current HPI
- 227.8248
- Rent YoY
- ▲ 5.16%
- Metro
- Louisville/Jefferson County, KY-IN
- State GDP YoY
- ▲ 1.81%
- F500 in state
- 4
Industry mix (Fortune 500 HQ in KY)
| Industry | F500 HQs | Revenue |
|---|---|---|
| Healthcare | 1 | $118B |
|
||
| Food / Beverage | 1 | $7B |
|
||
Price history
+164.3% since first listed13 events — show timeline
- 2026-05-16 Price Changed $219,900 Metro Search MLS
- 2026-05-06 Listed $240,000 Metro Search MLS
- 2021-06-14 Sold (Public Records) $60,000 Public Records
- 2018-03-27 Listing Removed — Metro Search MLS
- 2017-09-27 Listed $74,900 Metro Search MLS
- 2017-09-23 Listing Removed — Metro Search MLS
- 2017-03-28 Listed $88,900 Metro Search MLS
- 2017-03-28 Price Changed $79,900 Metro Search MLS
- 2010-09-13 Listing Removed — Metro Search MLS
- 2010-09-12 Listing Removed — Metro Search MLS
- 2010-03-12 Listed $99,900 Metro Search MLS
- 2010-03-12 Listed $99,900 Metro Search MLS
- 2003-12-30 Sold (Public Records) $83,200 Public Records
Property tax history
-4.4%/yrLatest (2025): $756 · -1.9% YoY. Source: county tax records.
Cash-flow waterfall
monthlySold comps — $/sqft
last 12 mo · ≤1 miLoading sold comps…