 5-Plex
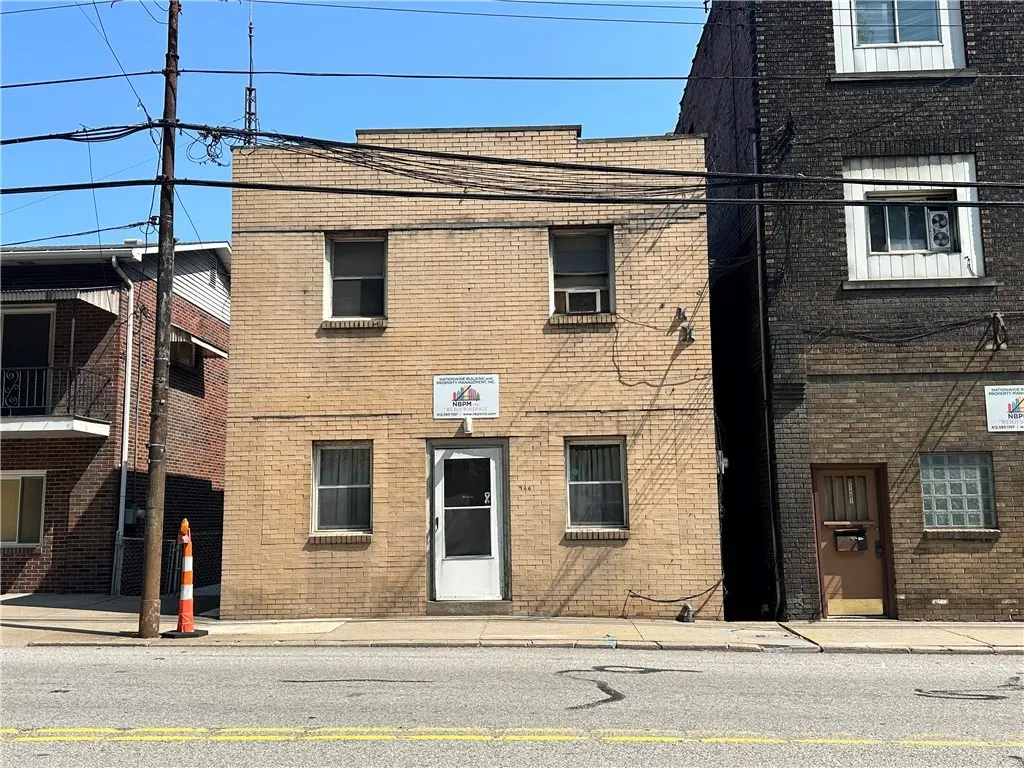
926 Island Ave · McKees Rocks, PA
Flood risk 5/10 · Moderate
- FEMA flood zone
- X (unshaded)
- Chance of flooding over 30 yrs
- 0.24%
- Est. flood insurance / yr
- $473 – $860
Fire risk 1/10 · Minimal
- Est. fire insurance / yr
- $511 – $949
Heat risk 4/10 · Minor
- Hot days now (above 98°F)
- 7 days/yr
- Hot days in 30 yrs
- 18 days/yr
Wind risk 2/10 · Minimal
- Chance of severe wind over 30 yrs
- —
Air-quality risk 3/10 · Minor
- Unhealthy air days now
- 3 days/yr
- Unhealthy air days in 30 yrs
- 3 days/yr
Risk factors via First Street. Map © Google.
Why this score? — see what drove the B- grade
The composite is a weighted blend of 9 inputs, each scored 0–100. Each bar is that input's sub-score; the figure is the points it added to the 100-point composite (weight × sub-score).
- Cash flow +30.0/30.0
- 1% rule +10.0/10.0
- DSCR +10.0/10.0
- ARV discount +7.5/15.0
- Rent growth +5.0/5.0
- Livability +4.1/5.0
- Condition / age +2.5/5.0
- Schools +0.9/10.0
- Appreciation +0.0/10.0
$239,900
🖨 Deal sheet 📄 Offer letter ✓ Due diligence
Multi-family units
County records classify this as Multi-Family (2-4 Unit). Listing-text estimate: 5 units. estimate disagrees with records
Listing remarks MLS
Fantastic brick 5-unit property, fully rented and generating strong cash flow. This well-maintained building features solid mechanicals and is in overall good condition, making it a turnkey investment. The owner currently covers gas, water, sewer, and some electric, offering opportunities for future expense optimization. With its brick construction, stable tenancy, and consistent income, this property is an ideal addition for a savvy investor looking for a reliable, low-maintenance asset with immediate returns and long-term upside.
Key facts
- Consistent income
- Stable tenancy
- Turnkey investment
Tags
Neighborhood map
What this means for you Summary
Snapshot
- This is a 5 × 6-bed/1.0-bath units multifamily listed at $240k.
Deal economics
- At list price, monthly cash flow is $4k ($46k/yr) — positive. Per door: $770/mo.
- The deal already cash-flows at list — no discount required.
- Meets the 1% rule at list price ($7k rent vs $240k).
- Recommended offer: $226k (6.0% below list) — sets the bar for market timing.
- Cap rate 25.6% vs local median 11.7% in McKees Rocks — top-decile yield for the area; either an underpriced asset or a hidden risk that comps aren't pricing in. Stress-test before assuming the spread holds.
Location & tenants
- Location reads 82/100 on livability (#143 in PA, #1,154 nationally) — a professional / high-income tenant draw. Strengths: amenities A+, commute A+, cost of living A+; Watch: schools F, employment F.
- Sto-Rox SD (suburban): math 4% / reading 18% proficiency, ranked #532 of 539 in PA (top 99%) — low school quality limits family demand, transient renter base, plan for 1-2y turnover; 77% free/reduced lunch — lower-income household profile, screen leases tightly.
- Market conditions: Rents rising fast (+13.1%/yr); 125 active listings in the ZIP; 16 comparable units currently listed for rent nearby; rentals at typical pace (median 24d on market — plan ~3-4 weeks tenant-placement turnaround); 2,996 units permitted in Allegheny County in 2024 (1,588 in 5+ unit buildings).
- At $6,972/mo this rent would consume 121% of the median local household income ($69k/yr) (locally 768% of renters already pay >50% of income on rent) — very limited rent-growth headroom before tenants either downsize or default.
Forward outlook
- Local home prices are declining (-3.0%/yr); year-one equity from $2k of loan paydown is wiped out by about $7k of value loss. Plan a longer hold.
- At projected returns (-3.0% appreciation + 8.0% rent growth), your $67k cash investment doubles in ~2 years — after that, you're playing with house money.
Negotiation context
- It's been on market 61 days — a 6% lower offer ($226k) is reasonable based on typical stale-listing flexibility.
- 3 sale attempts since 23y ago with the ask held roughly flat each time — persistent listings suggest the price (not the market) is what's stuck; bring a comps-based counter.
Risks & watch-outs
- Watch-outs: built in 1935 — expect roof / HVAC / electrical / plumbing capex.
- Climate carrying-cost: moderate flood risk — expect insurance premiums to compound above CPI over the hold.
Questions for the listing agent
- It's been on market 61 days. Have you received any prior offers? Is the seller open to a 6% concession, seller financing, or rate buy-down credit?
- Can we see the unit-by-unit rent roll, current vacancy, and any below-market leases? What's the average tenancy length?
- What capital expenditures (roof, boiler, parking lot, exteriors) have been made in the last 5 years, and what's planned in the next 2?
- Built in 1935 — when were the roof, HVAC, electrical panel, plumbing, and water heater last replaced?
- Why hasn't it sold? Are there any deal-killer items the seller is aware of (foundation, flood, title, zoning, code violations)?
- Is there a deadline driving the sale (1031 exchange, divorce, estate, relocation)? That informs how much negotiation room exists.
- Schools are F-rated, which usually means shorter tenancies and higher turnover. Who's the typical renter profile here, and what's been the actual vacancy rate?
- What's the average days-on-market for RENTAL listings here right now (not sales)? A rising rental-DOM trend means longer vacancies and softer asking-rent achievability than the comps imply.
- What's the recent tenant-quality profile in this submarket — average credit score on applications, eviction rate, late-payment / NSF rate, and stable-employment percentage? A property-management company in the area should have these aggregated.
- How much new apartment / multifamily construction is in the pipeline within 1–3 miles? Heavy new supply (>2% of stock underway) typically softens rents 12–24 months out; light construction supports rent growth.
Investment metrics
- 1% rule
- 2.91% ✓
- Cap rate
- 25.55%
- Cash-on-cash
- 68.78%
- DSCR
- 4.06
- GRM
- 2.9
CMA / ARV
- ARV (median comp)
- $48,932
- List price
- $239,900
- Delta
- 390.27%
- Verdict
- OVERPRICED
- Comps
- 4 within 1.0 mi
Projected returns pro-forma
-3.0% appreciation · 8.0% rent growth · sell at horizon
- IRR
- 73.8%
- Equity multiple
- 4.62×
- Total profit
- $243,284
- Equity at exit
- $35,770
- IRR
- 79.1%
- Equity multiple
- 11.36×
- Total profit
- $695,717
- Equity at exit
- $20,742
Cash invested: $67,172 (down + closing). Projections, not guarantees.
Landlord ↔ Tenant lean methodology
- Overall (STATE)
- 62 Landlord-Friendly
- State Pennsylvania
- 62 Landlord-Friendly · EVEN
- County
- — inherits STATE
- City
- — inherits STATE
ZIP-level market 15136
- Home prices YoY
- -30.4%
- Rents YoY
- 13.1%
- Active inventory
- 125
- Price-to-rent
- 14.3×
Monthly cashflow live
- Estimated rent
- $6,972 medium interval (Pro) →
- Mortgage (P&I)
- −$1,258
- Tax est. 1.5%
- −$300 /mo · $3,598/yr
- Insurance
- −$100
- HOA
- −$0
- Vacancy / Maint / Mgmt
- −$1,464
- Net cashflow
- $3,850
Break-even live
5-unit breakdown (identical units grouped — click to expand)
| Units | Beds | Baths | Est. rent |
|---|---|---|---|
| 5× units | 6 | 1 | $6,970 |
| #1 | 6 | 1 | $1,394 |
| #2 | 6 | 1 | $1,394 |
| #3 | 6 | 1 | $1,394 |
| #4 | 6 | 1 | $1,394 |
| #5 | 6 | 1 | $1,394 |
| Total (5 units) | $6,972 | ||
UW: 25.0% down · 7.5% · 30yr · 1.5% tax · 5.0% vac · 8.0% maint · 8.0% mgmt
Financing live
Cash to close
- Down payment
- $59,975
- Closing costs
- $7,197
- Reserves months
- —
- Total cash needed
- —
Loan-product check · same deal, 3 products live
Conventional
25% down · 7.5% · 30yr
- Down + closing
- —
- Monthly P&I
- —
- Monthly cashflow
- —
- DSCR
- —
- Eligible?
- —
Personal DTI + credit; lowest rate.
DSCR
20% down · 8.5% · 30yr
- Down + closing
- —
- Monthly P&I
- —
- Monthly cashflow
- —
- DSCR
- —
- Eligible?
- —
No personal income docs; deal must DSCR.
Hard money
10% down · 12.0% · 12mo
- Down + closing
- —
- Monthly P&I
- —
- Monthly cashflow
- —
- DSCR
- —
- Eligible?
- —
Short-term bridge; refi at stabilization.
Rent comps 16 comps
| Address | Beds | Baths | Sqft | Rent | $/sqft | DOM | Units | Dist |
|---|---|---|---|---|---|---|---|---|
| 22 Harlem Ave #1 McKees Rocks, PA | 2.0 | 1.0 | 1944 | $745 | $0.38 | 21d | 1 | 0.13mi |
| 27 Highland Ave Mc Kees Rocks, PA | 3.0 | 1.0 | 1488 | $1,425 | $0.96 | 23d | 1 | 0.14mi |
| 71 McKinnie Ave Mc Kees Rocks, PA | 2.0 | 1.0 | 1176 | $1,100 | $0.94 | 23d | 1 | 0.22mi |
| 135 Dunn St Mc Kees Rocks, PA | 3.0 | 2.0 | 1600 | $1,599 | $1.00 | 19d | 1 | 0.30mi |
| 500 Marwood Ave Unit NA McKees Rocks, PA | 3.0 | 2.0 | 2040 | $1,500 | $0.74 | 23d | 1 | 0.53mi |
| 500 Marwood Ave Mc Kees Rocks, PA | 3.0 | 2.0 | 2040 | $1,600 | $0.78 | 23d | 1 | 0.53mi |
| 1124a Dohrman St McKees Rocks, PA | 3.0 | 1.0 | 1150 | $1,250 | $1.09 | 23d | 1 | 0.59mi |
| 1126 Dohrman St Unit MC McKees Rocks, PA | 2.0 | 1.0 | 1200 | $1,250 | $1.04 | 43d | 1 | 0.60mi |
| 915 Woodward Ave Mc Kees Rocks, PA | 3.0 | 1.0 | 1224 | $1,399 | $1.14 | 43d | 1 | 0.62mi |
| 933 Woodward Ave Unit MC McKees Rocks, PA | 2.0 | 1.0 | 1100 | $1,400 | $1.27 | 23d | 1 | 0.66mi |
| 933 Woodward Ave Unit NA McKees Rocks, PA | 2.0 | 1.0 | 1100 | $1,400 | $1.27 | 20d | 1 | 0.66mi |
| 802 13th St Unit 2 McKees Rocks, PA | 2.0 | 1.0 | 1100 | $920 | $0.84 | 43d | 1 | 0.75mi |
| 27 Rudolph St Mc Kees Rocks, PA | 3.0 | 1.0 | 1084 | $1,100 | $1.01 | 1d | 1 | 0.77mi |
| 207 Singer Ave Mc Kees Rocks, PA | 3.0 | 2.0 | 1728 | $1,700 | $0.98 | 43d | 1 | 0.79mi |
| 10 Highland Dr Mc Kees Rocks, PA | 2.0 | 1.0 | 1188 | $1,300 | $1.09 | 43d | 1 | 1.44mi |
| 937 Jackman Ave Unit 1 Pittsburgh, PA | 1.0 | 1.0 | 1200 | $1,390 | $1.16 | 44d | 1 | 1.47mi |
Listing history 20 events
-
2026-06-18days on market $239,900 Active 61 DOM
-
2026-06-17days on market $239,900 Active 60 DOM
-
2026-06-16days on market $239,900 Active 59 DOM
-
2026-06-15days on market $239,900 Active 58 DOM
-
2026-06-13days on market $239,900 Active 56 DOM
-
2026-06-09days on market $239,900 Active 52 DOM
-
2026-06-08days on market $239,900 Active 51 DOM
-
2026-06-07days on market $239,900 Active 50 DOM
-
2026-06-05days on market $239,900 Active 47 DOM
-
2026-06-03days on market $239,900 Active 46 DOM
-
2026-06-02days on market $239,900 Active 45 DOM
-
2026-06-01days on market $239,900 Active 44 DOM
-
2026-05-31days on market $239,900 Active 43 DOM
-
2026-04-18$239,900 Active 537-char remark
Show marketing remark (537 chars)
Fantastic brick 5-unit property, fully rented and generating strong cash flow. This well-maintained building features solid mechanicals and is in overall good condition, making it a turnkey investment. The owner currently covers gas, water, sewer, and some electric, offering opportunities for future expense optimization. With its brick construction, stable tenancy, and consistent income, this property is an ideal addition for a savvy investor looking for a reliable, low-maintenance asset with immediate returns and long-term upside.
-
2024-10-29status Pending 126-char remark
Show marketing remark (126 chars)
Well maintained 5 unit bldg can be purchased separately or with MLS#1638952 Completely rented . Each unit is a 1 Bed 1 Bath.
-
2024-10-24soldstatus $210,000 Closed 126-char remark
Show marketing remark (126 chars)
Well maintained 5 unit bldg can be purchased separately or with MLS#1638952 Completely rented . Each unit is a 1 Bed 1 Bath.
-
2024-08-27historical Contingent 126-char remark
Show marketing remark (126 chars)
Well maintained 5 unit bldg can be purchased separately or with MLS#1638952 Completely rented . Each unit is a 1 Bed 1 Bath.
-
2024-07-23$218,900 Active 126-char remark
Show marketing remark (126 chars)
Well maintained 5 unit bldg can be purchased separately or with MLS#1638952 Completely rented . Each unit is a 1 Bed 1 Bath.
-
2004-02-03soldstatus $48,850
-
2003-12-10$50,000
ⓘ Source: listings_history table (triggers on properties + properties_extension) + one-shot
backfill from property_details.listing_events for pre-trigger history.
Climate risk First Street
- Flood 5/10 Major FEMA zone X (unshaded) · 24% chance over 30 yrs
- Wildfire 1/10 Low
- Heat 4/10 Moderate 7 d/yr ≥98°F today · 18 d/yr by 30 yrs out
- Wind 2/10 Low
- Air quality 3/10 Moderate 3 unhealthy d/yr today · 3 by 30 yrs out
Nearby sold comps map
Loading sold comps map…
Walkable amenities ~0.75 mi
Loading nearby amenities…
Taxation est. · year 1
- Rental income
- $83,664
- − Mortgage interest
- −$13,438
- − Property taxes
- −$3,598
- − Insurance
- −$1,200
- − Repairs & maintenance
- −$6,693
- − Management
- −$6,693
- − Depreciation
- −$6,979
- Taxable income
- $45,063
- Est. tax owed @ 24.0%
- −$10,815
- After-tax cash flow
- $35,385/yr
For passive investors: Depreciation is non-cash, so a rental often shows a tax loss while cash-flowing — sheltering income. Rental losses are passive: they offset passive income freely, and up to $25,000/yr can offset ordinary (W-2) income if you actively participate and your MAGI is under $100k (phasing out to $0 by $150k); unused losses carry forward. On sale, claimed depreciation is recaptured at up to 25%, and gains may owe capital-gains tax (a 1031 exchange can defer both). Figures are a year-1 estimate at your 24.0% rate — not tax advice; consult a CPA.
Schools (NCES district)
- District
- Sto-Rox SD
- NCES district ID
- 4222830
- Math proficiency
- 4% ▼ -5.00%
- Reading proficiency
- 18% ▼ -4.00%
- Median HH income
- $30,268
- Composite
- 8.51/100
- National rank
- #9904
- State rank
- #532 of 539 in PA
Livability — McKees Rocks
- Score
- 82/100
- State rank
- #143
- US rank
- #1154
Category grades
Schools grade is shown separately in the Schools card above.
Census & demographics
- Census place
- McKees Rocks, PA
- County
- Allegheny County · 1,022,028 people
- City population
- 22,623
- Metro
- Pittsburgh, PA
- Population (ZIP)
- 22,623
- Household income
- $69,099
- Rent vs Own
- Severe rent burden
- 768.0
Population outlook (Allegheny County) Hauer SSP2
- Today (2025)
- 1,250,282 people
- By 2030
- 1,256,482 · +0.5%
- By 2040
- 1,256,318 · +0.5%
- By 2050
- 1,244,169 · -0.5%
- By 2075
- 1,197,693 · -4.2%
- By 2100
- 1,093,187 · -12.6%
Race, ethnicity, and origin ACS 2023
- Neighborhood character
- Predominantly White (75%)
- Race & ethnicity
- White 75% Black 18% Two or more races 4% Hispanic / Latino 2%
- Common ancestry
- Romanian 10% Subsaharan African 3% Scotch-Irish 2%
- Foreign-born
- 3% · Canada
- Languages at home
- 96% English-only · Spanish 1% Other Indo-European 1%
Political lean MEDSL · Allegheny
- 2024 margin
- Strong D (+20.3) · D 59.7% · R 39.4%
- 2008→2024 swing
- +4.8pp toward D · 2008: 15.5pp · 2024: 20.3pp
- All cycles
- 2024: D+20.3 2020: D+20.4 2016: D+16.4 2012: D+14.4 2008: D+15.5
Not yet ingested
- Civics
- —
Market trends
- HPI YoY
- ▼ -107.07%
- Current HPI
- 244.6934
- Rent YoY
- ▲ 13.12%
- Metro
- Pittsburgh, PA
- State GDP YoY
- ▲ 1.68%
- F500 in state
- 34
Industry mix (Fortune 500 HQ in PA)
| Industry | F500 HQs | Revenue |
|---|---|---|
| Healthcare | 2 | $309B |
|
||
| Insurance | 2 | $27B |
|
||
| Telecommunications / Media | 1 | $124B |
|
||
| Industrial Distribution | 1 | $22B |
|
||
| Financial Services | 1 | $20B |
|
||
| Chemicals / Materials | 1 | $18B |
|
||
Price history
+379.8% since first listed7 events — show timeline
- 2026-04-18 Listed $239,900 West Penn MLS
- 2024-10-29 Pending — West Penn MLS
- 2024-10-24 Sold (MLS) $210,000 West Penn MLS
- 2024-08-27 Contingent — West Penn MLS
- 2024-07-23 Listed $218,900 West Penn MLS
- 2004-02-03 Sold (MLS) $48,850 West Penn MLS
- 2003-12-10 Listed $50,000 West Penn MLS
Property tax history
-2.7%/yrLatest (2026): $476 · +4.1% YoY. Source: county tax records.
Cash-flow waterfall
monthlySold comps — $/sqft
last 12 mo · ≤1 miLoading sold comps…