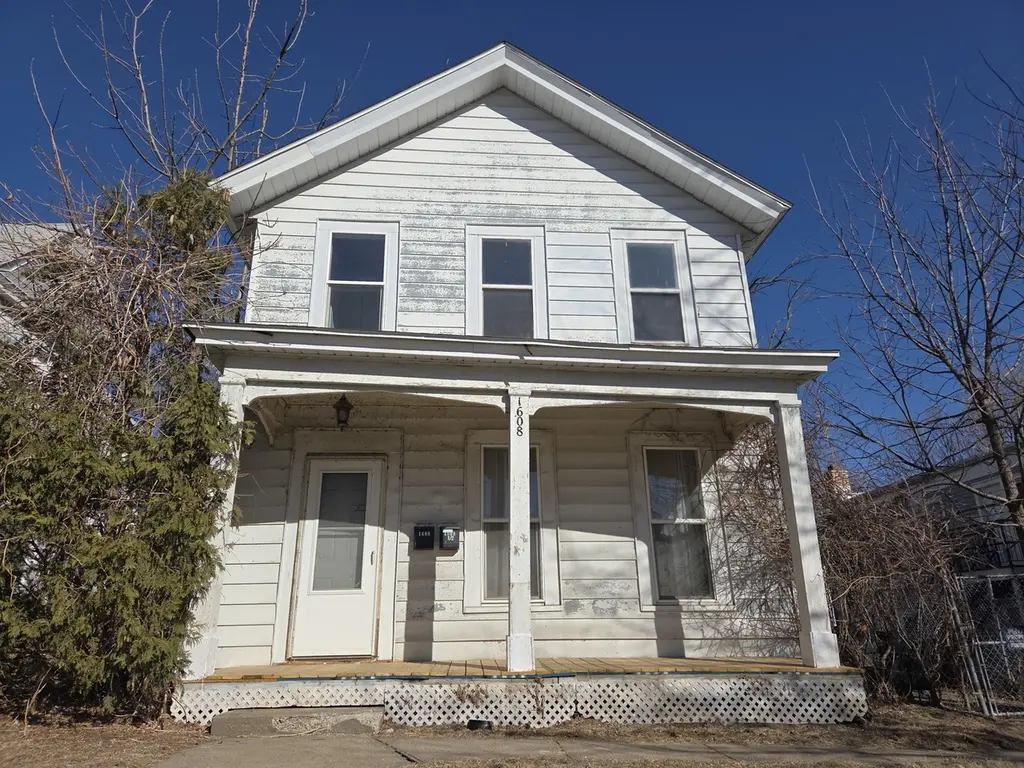
1608 E 12th St · Davenport, IA
Flood risk 1/10 · Minimal
- FEMA flood zone
- X (unshaded)
- Chance of flooding over 30 yrs
- 0.0%
- Est. flood insurance / yr
- $473 – $860
Fire risk 1/10 · Minimal
- Est. fire insurance / yr
- $902 – $1,676
Heat risk 3/10 · Minor
- Hot days now (above 103°F)
- 7 days/yr
- Hot days in 30 yrs
- 16 days/yr
Wind risk 2/10 · Minimal
- Chance of severe wind over 30 yrs
- —
Air-quality risk 3/10 · Minor
- Unhealthy air days now
- 2 days/yr
- Unhealthy air days in 30 yrs
- 3 days/yr
Risk factors via First Street. Map © Google.
Why this score? — see what drove the B grade
The composite is a weighted blend of 9 inputs, each scored 0–100. Each bar is that input's sub-score; the figure is the points it added to the 100-point composite (weight × sub-score).
- Cash flow +26.0/30.0
- ARV discount +15.0/15.0
- DSCR +8.8/10.0
- 1% rule +6.9/10.0
- Livability +4.0/5.0
- Schools +3.9/10.0
- Rent growth +3.6/5.0
- Condition / age +2.5/5.0
- Appreciation +0.0/10.0
$115,000
🖨 Deal sheet (PDF) 📄 Offer letter ✓ Due diligence
Listing remarks MLS
Take a look at this duplex in Davenport. This property is located near the Village of East Davenport and includes a 2-car detached garage. The lower unit includes 2 bedrooms. The upper unit is a 1-bedroom unit. AHS home warranty included! Schedule your showing today.
Key facts
- 4,968 sq ft lot
- 2 garage spots
- Built 1890
Neighborhood map
What this means for you Summary
Snapshot
- This is a 2-bed/2.5-bath single-family listed at $115k.
Deal economics
- At list price, monthly cash flow is $288 ($3k/yr) — positive.
- The deal already cash-flows at list — no discount required.
- Meets the 1% rule at list price ($1k rent vs $115k).
- Recommended offer: $105k (9.0% below list) — sets the bar for market timing.
- Cap rate 9.3% vs local median 4.4% in Davenport — top-decile yield for the area; either an underpriced asset or a hidden risk that comps aren't pricing in. Stress-test before assuming the spread holds.
Location & tenants
- Location reads 79/100 on livability (#126 in IA, #2,312 nationally) — a middle-class / working-renter tenant base. Strengths: cost of living A+, housing A+, health & safety A+; Watch: employment C-, crime F.
- Davenport Community School District (urban): math 43% / reading 50% proficiency, ranked #288 of 289 in IA (top 100%) — families likely to look elsewhere, expect single-tenant / working-renter base with shorter leases.
- Market conditions: Rents rising fast (+4.6%/yr); 160 active listings in the ZIP; 25 comparable units currently listed for rent nearby; rentals lingering (median 45d on market — plan ~5-8 weeks vacancy on turnover, expect pricing pressure); 64% of comp listings sitting > 30 days — soft ceiling on asking rent; 805 units permitted in Scott County in 2024 (479 in 5+ unit buildings).
Forward outlook
- Local home prices are declining (-3.0%/yr); year-one equity from $795 of loan paydown is wiped out by about $3k of value loss. Plan a longer hold.
- Scott County population projected at +19% by 2050 — long-run rental-demand tailwind backs the buy-and-hold thesis.
- At projected returns (-3.0% appreciation + 4.6% rent growth), your $32k cash investment doubles in ~9 years — after that, you're playing with house money.
Negotiation context
- It's been on market 116 days — a 9% lower offer ($105k) is reasonable based on typical stale-listing flexibility.
- 6 sale attempts since 22y ago; this cycle's ask has dropped $10k (8%) from the opening price — seller is motivated, your offer sets the floor, not the list.
- Current owner paid $85k; 35% above their basis — modest negotiation headroom, anchor on the comps not their cost.
Risks & watch-outs
- Watch-outs: built in 1890 — expect roof / HVAC / electrical / plumbing capex.
Questions for the listing agent
- It's been on market 116 days. Have you received any prior offers? Is the seller open to a 9% concession, seller financing, or rate buy-down credit?
- Built in 1890 — when were the roof, HVAC, electrical panel, plumbing, and water heater last replaced?
- Why hasn't it sold? Are there any deal-killer items the seller is aware of (foundation, flood, title, zoning, code violations)?
- Is there a deadline driving the sale (1031 exchange, divorce, estate, relocation)? That informs how much negotiation room exists.
- Crime grade is F in this area — have there been break-ins, vandalism, or insurance claims at this property in the last 3 years? What carrier currently insures it and at what premium?
- What's the average days-on-market for RENTAL listings here right now (not sales)? A rising rental-DOM trend means longer vacancies and softer asking-rent achievability than the comps imply.
- What's the recent tenant-quality profile in this submarket — average credit score on applications, eviction rate, late-payment / NSF rate, and stable-employment percentage? A property-management company in the area should have these aggregated.
- How much new for-sale + rental construction is in the pipeline within 1–3 miles? Heavy new supply typically softens prices + rents 12–24 months out; constrained supply supports both.
Investment metrics
- 1% rule
- 1.19% ✓
- Cap rate
- 9.30%
- Cash-on-cash
- 10.73%
- DSCR
- 1.48
- GRM
- 7.0
CMA / ARV
- ARV (median comp)
- $181,235
- List price
- $115,000
- Delta
- -36.55%
- Verdict
- UNDERPRICED
- Comps
- 20 within 1.0 mi
Show comp detail 12 sales within ~0.75 mi
| Address | Dist | Beds/Ba | Sqft | Sold | Price | $/sf | Match |
|---|---|---|---|---|---|---|---|
| 1220 College Ave | 0.25mi | 3/1.0 (+1) | 1,530 (-2%) | 0mo | $110,000 | $72 | 74 |
| 2321 Fulton Ave | 0.49mi | 3/1.5 (+1) | 1,488 (-4%) | 0mo | $312,000 | $210 | 61 |
| 2402 Middle Rd | 0.54mi | 3/2.0 (+1) | 1,576 (+1%) | 12mo | $230,000 | $146 | 56 |
| 1102 Kirkwood Blvd | 0.49mi | 3/2.0 (+1) | 1,428 (-8%) | 0mo | $129,000 | $90 | 56 |
| 1108 Arlington Ave | 0.57mi | 3/1.0 (+1) | 1,668 (+7%) | 2mo | $99,999 | $60 | 49 |
| 1709 Christie St | 0.49mi | 3/1.0 (+1) | 1,431 (-8%) | 7mo | $142,000 | $99 | 47 |
| 1522 Bridge Ave | 0.39mi | 3/1.5 (+1) | 1,752 (+12%) | 11mo | $108,000 | $62 | 43 |
| 1429 Jersey Ridge Rd | 0.57mi | 2/1.0 | 1,399 (-10%) | 11mo | $270,000 | $193 | 41 |
| 1938 Bridge Ave | 0.58mi | 3/2.0 (+1) | 1,660 (+6%) | 21mo | $110,000 | $66 | 38 |
| 1528 Mound St | 0.38mi | 3/2.0 (+1) | 1,356 (-13%) | 19mo | $146,750 | $108 | 38 |
| 1734 Ridgewood Ave | 0.71mi | 3/1.5 (+1) | 1,736 (+11%) | 5mo | $245,000 | $141 | 34 |
| 1104 Oneida Ave | 0.40mi | 3/1.0 (+1) | 1,361 (-13%) | 22mo | $130,750 | $96 | 30 |
Match score weights: distance 35% · size 25% · config 20% · recency 20%. Top-matched comps best support the ARV.
Projected returns pro-forma
-3.0% appreciation · 4.57% rent growth · sell at horizon
- IRR
- 1.5%
- Equity multiple
- 1.06×
- Total profit
- $1,906
- Equity at exit
- $17,147
- IRR
- 12.6%
- Equity multiple
- 2.08×
- Total profit
- $34,624
- Equity at exit
- $9,943
Cash invested: $32,200 (down + closing). Projections, not guarantees.
Landlord ↔ Tenant lean methodology
- Overall (STATE)
- 83 Strongly Landlord-Friendly
- State Iowa
- 83 Strongly Landlord-Friendly · R+6
- County
- — inherits STATE
- City
- — inherits STATE
ZIP-level market 52803
- Home prices YoY
- -34.5%
- Rents YoY
- 4.6%
- Active inventory
- 160
- Price-to-rent
- 7.0×
Monthly cashflow live
- Estimated rent
- $1,366 high interval (Pro) →
- Mortgage (P&I)
- −$603
- Tax from tax record
- −$140 /mo · $1,683/yr
- Insurance
- −$48
- HOA
- −$0
- Vacancy / Maint / Mgmt
- −$287
- Net cashflow
- $288
Break-even live
Sensitivity live
| Price | -10% $353 | -5% $320 | +0% $288 | +5% $255 | +10% $223 |
|---|---|---|---|---|---|
| Rent | -10% $180 | -5% $234 | +0% $288 | +5% $342 | +10% $396 |
| Rate | -1.0pp $346 | -0.5pp $317 | base $288 | +0.5pp $258 | +1.0pp $228 |
UW: 25.0% down · 7.5% · 30yr · 1.5% tax · 5.0% vac · 8.0% maint · 8.0% mgmt
Financing live
Cash to close
- Down payment
- $28,750
- Closing costs
- $3,450
- Reserves months
- —
- Total cash needed
- —
Loan-product check · same deal, 3 products live
Conventional
25% down · 7.5% · 30yr
- Down + closing
- —
- Monthly P&I
- —
- Monthly cashflow
- —
- DSCR
- —
- Eligible?
- —
Personal DTI + credit; lowest rate.
DSCR
20% down · 8.5% · 30yr
- Down + closing
- —
- Monthly P&I
- —
- Monthly cashflow
- —
- DSCR
- —
- Eligible?
- —
No personal income docs; deal must DSCR.
Hard money
10% down · 12.0% · 12mo
- Down + closing
- —
- Monthly P&I
- —
- Monthly cashflow
- —
- DSCR
- —
- Eligible?
- —
Short-term bridge; refi at stabilization.
Rent comps 25 comps
| Address | Beds | Baths | Sqft | Rent | $/sqft | DOM | Units | Dist |
|---|---|---|---|---|---|---|---|---|
| 1017 E 13th St Unit 1017 Davenport, IA | 2.0 | 1.0 | 1335 | $950 | $0.71 | 21d | 1 | 0.42mi |
| 2220 E Lombard St Davenport, IA | 3.0 | 2.0 | 1500 | $1,620 | $1.08 | 44d | 1 | 0.77mi |
| 736 Federal St Davenport, IA | 1.0–3.0 | 1.0–2.0 | 1186 | $1,559 | $1.31 | 21d | 1 | 0.80mi |
| 317 Kirkwood Blvd Davenport, IA | 2.0 | 1.0 | 1300 | $950 | $0.73 | 44d | 1 | 0.98mi |
| 2209 Farnam St Unit 2211 Davenport, IA | 3.0 | 1.0 | 1138 | $1,050 | $0.92 | 21d | 1 | 1.01mi |
| 119 E 13th St Davenport, IA | 3.0 | 1.0 | 1728 | $1,495 | $0.87 | 44d | 1 | 1.10mi |
| 511 Pershing Ave Unit 202W Davenport, IA | 2.0 | 1.0 | 1201 | $1,601 | $1.33 | 44d | 1 | 1.13mi |
| 511 Pershing Ave Unit 301E Davenport, IA | 3.0 | 2.0 | 1429 | $2,126 | $1.49 | 44d | 1 | 1.13mi |
| 511 Pershing Ave Unit 106E Davenport, IA | 3.0 | 2.0 | 1349 | $1,996 | $1.48 | 44d | 1 | 1.13mi |
| 511 Pershing Ave Unit 407W Davenport, IA | 2.0 | 2.0 | 1175 | $1,568 | $1.33 | 44d | 1 | 1.13mi |
| 511 Pershing Ave Unit 102W Davenport, IA | 2.0 | 1.0 | 1173 | $1,506 | $1.28 | 44d | 1 | 1.13mi |
| 511 Pershing Ave Unit 402W Davenport, IA | 2.0 | 2.0 | 1106 | $1,478 | $1.34 | 44d | 1 | 1.13mi |
| 511 Pershing Ave Unit 101W Davenport, IA | 2.0 | 1.0 | 1280 | $1,704 | $1.33 | 44d | 1 | 1.13mi |
| 511 Pershing Ave Unit 105E Davenport, IA | 2.0 | 2.0 | 1100 | $1,635 | $1.49 | 44d | 1 | 1.13mi |
| 427 Pershing Ave Davenport, IA | 3.0 | 2.0 | 1438 | $2,288 | $1.59 | 14d | 3 | 1.14mi |
| 2224 Iowa St Unit 2224 Davenport, IA | 2.0 | 1.0 | 1214 | $925 | $0.76 | 44d | 1 | 1.15mi |
| 2224 Iowa St Davenport, IA | 2.0 | 1.0 | 1214 | $895 | $0.74 | 44d | 1 | 1.15mi |
| 1421 N Main St #2 Davenport, IA | 3.0 | 1.0 | 1350 | $1,095 | $0.81 | 44d | 1 | 1.21mi |
| 200 E 3rd St Davenport, IA | 1.0–2.0 | 1.0–2.0 | 900 | $1,700 | $1.89 | 14d | 2 | 1.27mi |
| 427 N Brady St Unit 1 Davenport, IA | 3.0 | 1.5 | 1126 | $1,359 | $1.21 | 44d | 1 | 1.27mi |
| 401 Brady St Davenport, IA | 1.0–3.0 | 1.0–2.0 | 870 | $1,625 | $1.87 | 14d | 2 | 1.31mi |
| 324 S Brady St Davenport, IA | 1.0–2.0 | 1.0–2.0 | 965 | $1,700 | $1.76 | 21d | 2 | 1.32mi |
| 1519 N Ripley St Davenport, IA | 2.0 | 1.0 | 1144 | $1,100 | $0.96 | 14d | 1 | 1.38mi |
| 212 N Brady St Davenport, IA | 2.0–3.0 | 2.0–3.0 | 1428 | $1,900 | $1.33 | 14d | 4 | 1.39mi |
| 320 E 29th St Davenport, IA | 2.0 | 2.5 | 1450 | $1,750 | $1.21 | 44d | 1 | 1.48mi |
Listing history 31 events
-
2026-06-18days on market $115,000 Active 116 DOM
-
2026-06-17days on market $115,000 Active 115 DOM
-
2026-06-16days on market $115,000 Active 114 DOM
-
2026-06-15days on market $115,000 Active 113 DOM
-
2026-06-14days on market $115,000 Active 111 DOM
-
2026-06-13days on market $115,000 Active 110 DOM
-
2026-06-10days on market $115,000 Active 108 DOM
-
2026-06-09days on market $115,000 Active 107 DOM
-
2026-06-08days on market $115,000 Active 106 DOM
-
2026-06-07days on market $115,000 Active 105 DOM
-
2026-06-03days on market $115,000 Active 101 DOM
-
2026-06-02days on market $115,000 Active 100 DOM
-
2026-06-01days on market $115,000 Active 99 DOM
-
2026-05-31days on market $115,000 Active 98 DOM
-
2026-05-30days on market $115,000 Active 97 DOM
-
2026-05-04price $115,000 267-char remark
Show marketing remark (267 chars)
Take a look at this duplex in Davenport. This property is located near the Village of East Davenport and includes a 2-car detached garage. The lower unit includes 2 bedrooms. The upper unit is a 1-bedroom unit. AHS home warranty included! Schedule your showing today.
-
2026-03-15price $120,000 267-char remark
Show marketing remark (267 chars)
Take a look at this duplex in Davenport. This property is located near the Village of East Davenport and includes a 2-car detached garage. The lower unit includes 2 bedrooms. The upper unit is a 1-bedroom unit. AHS home warranty included! Schedule your showing today.
-
2026-02-22$125,000 Active 267-char remark
Show marketing remark (267 chars)
Take a look at this duplex in Davenport. This property is located near the Village of East Davenport and includes a 2-car detached garage. The lower unit includes 2 bedrooms. The upper unit is a 1-bedroom unit. AHS home warranty included! Schedule your showing today.
-
2022-04-11soldstatus $85,000
-
2022-04-07soldstatus $85,000 165-char remark
Show marketing remark (165 chars)
1BR/1BA each unit. 2 car garage & driveway in back. New paint & flooring lower level 2021. Roof - complete tear off Nov 2021. Tenants pay gas & electric.
-
2022-04-07soldstatus $85,000 165-char remark
Show marketing remark (165 chars)
1BR/1BA each unit. 2 car garage & driveway in back. New paint & flooring lower level 2021. Roof - complete tear off Nov 2021. Tenants pay gas & electric.
-
2022-02-22$90,000 165-char remark
Show marketing remark (165 chars)
1BR/1BA each unit. 2 car garage & driveway in back. New paint & flooring lower level 2021. Roof - complete tear off Nov 2021. Tenants pay gas & electric.
-
2022-02-22$90,000 165-char remark
Show marketing remark (165 chars)
1BR/1BA each unit. 2 car garage & driveway in back. New paint & flooring lower level 2021. Roof - complete tear off Nov 2021. Tenants pay gas & electric.
-
2021-08-06historical
-
2021-08-06historical
-
2010-09-24soldstatus $27,500
-
2010-09-24soldstatus $27,500
-
2010-07-14$30,000
-
2010-07-14$30,000
-
2004-06-15soldstatus $69,900
-
2004-01-03$69,900
ⓘ Source: listings_history table (triggers on properties + properties_extension) + one-shot
backfill from property_details.listing_events for pre-trigger history.
Tax reassessment forecast IA · Partial reset (capped growth)
- Current annual tax
- $1,683 · $140/mo
- Projected year-2 tax
- $1,744 · $145/mo
- Expected delta
- +$61/yr (+$5/mo · 3.6%)
ⓘ Screening estimate from a state-policy table — verify with the county assessor before closing.
Climate risk First Street
- Flood 1/10 Low FEMA zone X (unshaded) · 0% chance over 30 yrs
- Wildfire 1/10 Low
- Heat 3/10 Moderate 7 d/yr ≥103°F today · 16 d/yr by 30 yrs out
- Wind 2/10 Low
- Air quality 3/10 Moderate 2 unhealthy d/yr today · 3 by 30 yrs out
Nearby sold comps map
Loading sold comps map…
Walkable amenities ~0.75 mi
Loading nearby amenities…
Taxation est. · year 1
- Rental income
- $16,391
- − Mortgage interest
- −$6,442
- − Property taxes
- −$1,683
- − Insurance
- −$575
- − Repairs & maintenance
- −$1,311
- − Management
- −$1,311
- − Depreciation
- −$3,345
- Taxable income
- $1,723
- Est. tax owed @ 24.0%
- −$414
- After-tax cash flow
- $3,040/yr
For passive investors: Depreciation is non-cash, so a rental often shows a tax loss while cash-flowing — sheltering income. Rental losses are passive: they offset passive income freely, and up to $25,000/yr can offset ordinary (W-2) income if you actively participate and your MAGI is under $100k (phasing out to $0 by $150k); unused losses carry forward. On sale, claimed depreciation is recaptured at up to 25%, and gains may owe capital-gains tax (a 1031 exchange can defer both). Figures are a year-1 estimate at your 24.0% rate — not tax advice; consult a CPA.
Schools (NCES district)
- District
- Davenport Community School District
- NCES district ID
- 1908580
- Math proficiency
- 43% ▼ -11.00%
- Reading proficiency
- 50% ▼ -3.00%
- Median HH income
- $46,157
- Composite
- 39.49/100
- National rank
- #3951
- State rank
- #288 of 289 in IA
Livability — Davenport
- Score
- 79/100
- State rank
- #126
- US rank
- #2312
Category grades
Schools grade is shown separately in the Schools card above.
Census & demographics
- Census place
- Davenport, IA
- County
- Scott County · 144,583 people
- City population
- 103,319
- Metro
- Davenport-Moline-Rock Island, IA-IL
- Population (ZIP)
- 22,742
- Household income
- $64,543
- Rent vs Own
- Severe rent burden
- 630.0
Population outlook (Scott County) Hauer SSP2
- Today (2025)
- 188,878 people
- By 2030
- 196,648 · +4.1%
- By 2040
- 210,860 · +11.6%
- By 2050
- 224,359 · +18.8%
- By 2075
- 258,884 · +37.1%
- By 2100
- 286,447 · +51.7%
Race, ethnicity, and origin ACS 2023
- Neighborhood character
- Predominantly White (69%)
- Race & ethnicity
- White 69% Black 14% Two or more races 10% Hispanic / Latino 9%
- Hispanic origin (detail)
- Mexican 7%
- Common ancestry
- Romanian 2% Portuguese 2% Iranian 2%
- Foreign-born
- 5% · Canada, United Kingdom, South Korea
- Languages at home
- 93% English-only · Spanish 4% French/Haitian/Cajun 1%
Political lean MEDSL · Scott
- 2024 margin
- Toss-up / Even · D 47.3% · R 51.2% · Other 1.4%
- 2008→2024 swing
- -18.4pp toward R · 2008: 14.6pp · 2024: -3.9pp
- All cycles
- 2024: R+3.9 2020: D+3.5 2016: D+1.4 2012: D+13.8 2008: D+14.6
Not yet ingested
- Civics
- —
Market trends
- HPI YoY
- ▼ -96.00%
- Current HPI
- 182.0976
- Rent YoY
- ▲ 4.57%
- Metro
- Davenport-Moline-Rock Island, IA-IL
- State GDP YoY
- ▲ 2.48%
- F500 in state
- 4
Industry mix (Fortune 500 HQ in IA)
| Industry | F500 HQs | Revenue |
|---|---|---|
| Financial Services | 1 | $16B |
|
||
| Retail / Convenience | 1 | $15B |
|
||
Price history
+64.5% since first listed16 events — show timeline
- 2026-05-04 Price Changed $115,000 MRED as Distributed by MLS Grid
- 2026-03-15 Price Changed $120,000 MRED as Distributed by MLS Grid
- 2026-02-22 Listed $125,000 MRED as Distributed by MLS Grid
- 2022-04-11 Sold (Public Records) $85,000 Public Records
- 2022-04-07 Sold (MLS) $85,000 MRED as Distributed by MLS Grid
- 2022-04-07 Sold (MLS) $85,000 RMLSA as Distributed by MLS Grid
- 2022-02-22 Listed $90,000 MRED as Distributed by MLS Grid
- 2022-02-22 Listed $90,000 RMLSA as Distributed by MLS Grid
- 2021-08-06 Listing Removed — RMLSA as Distributed by MLS Grid
- 2021-08-06 Listing Removed — RMLSA as Distributed by MLS Grid
- 2010-09-24 Sold (MLS) $27,500 RMLSA as Distributed by MLS Grid
- 2010-09-24 Sold (MLS) $27,500 MRED as Distributed by MLS Grid
- 2010-07-14 Listed $30,000 RMLSA as Distributed by MLS Grid
- 2010-07-14 Listed $30,000 MRED as Distributed by MLS Grid
- 2004-06-15 Sold (MLS) $69,900 RMLSA as Distributed by MLS Grid
- 2004-01-03 Listed $69,900 RMLSA as Distributed by MLS Grid
Property tax history
+2.9%/yrLatest (2025): $1,683 · -10.2% YoY. Source: county tax records.
Cash-flow waterfall
monthlySold comps — $/sqft
last 12 mo · ≤1 miLoading sold comps…