 Duplex
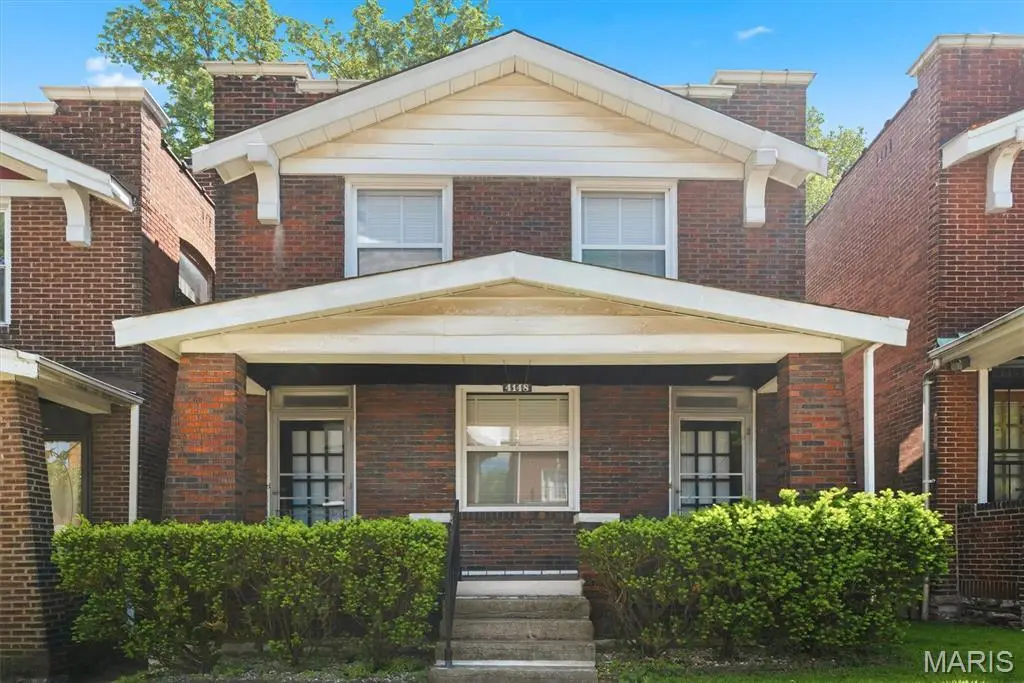
4148 Humphrey St · St. Louis, MO
Flood risk 1/10 · Minimal
- FEMA flood zone
- X (unshaded)
- Chance of flooding over 30 yrs
- 0.0%
- Est. flood insurance / yr
- $473 – $860
Fire risk 1/10 · Minimal
- Est. fire insurance / yr
- $1,054 – $1,958
Heat risk 5/10 · Moderate
- Hot days now (above 108°F)
- 7 days/yr
- Hot days in 30 yrs
- 21 days/yr
Wind risk 2/10 · Minimal
- Chance of severe wind over 30 yrs
- 1.0%
Air-quality risk 3/10 · Minor
- Unhealthy air days now
- 3 days/yr
- Unhealthy air days in 30 yrs
- 4 days/yr
Risk factors via First Street. Map © Google.
Why this score? — see what drove the C- grade
The composite is a weighted blend of 9 inputs, each scored 0–100. Each bar is that input's sub-score; the figure is the points it added to the 100-point composite (weight × sub-score).
- Cash flow +19.5/30.0
- ARV discount +15.0/15.0
- DSCR +6.2/10.0
- 1% rule +4.7/10.0
- Rent growth +3.2/5.0
- Livability +2.5/5.0
- Condition / age +2.5/5.0
- Schools +1.2/10.0
- Appreciation +0.0/10.0
$215,000
🖨 Deal sheet 📄 Offer letter ✓ Due diligence
Multi-family units
County records classify this as Multi-Family (2-4 Unit). Listing-text estimate: 2 units. confirmed
Listing remarks
Tower Grove South brick 2 family on a quiet block. Charming 1 bedroom units and garage. Please use special sale contract. AS-IS
Key facts
- 3,101 sq ft lot
- Garage
- Built 1923
Property features AI
Finance
- Other: Seller may consider concessions; No pool
Exterior
- Parking: Detached garage with alley access (1 garage space)
- Security: Smoke detector(s)
- Utilities: Public water; Sewer connected; Electricity connected (Ameren); Natural gas connected
- Home design: Residential income property (2-4 units); Duplex; Two stories; Private ownership
- Construction: Wood siding; Flat roof; Stone foundation; Built/area details from assessor
- Exterior features: Covered patio/porch; Balcony; Entry steps/stairs; Rain gutters; Chain link fencing; Back yard; Interior lot; Level lot; Near public transit; Paved road frontage on city street
Interior
- Kitchen: Gas range; Refrigerator
- Bedrooms: Two 1-bedroom units (unit level not specified)
- Flooring: Wood flooring
- Bathrooms: Each unit has 1 bathroom
- Heating & cooling: Forced air heating; Central air; Wall/window air conditioning units
- Interior features: Eat-in kitchen; Daylight full basement with 8+ ft poured concrete walls
- Laundry & utility: Washer hookup; Gas dryer hookup; Laundry located in basement
Neighborhood map
What this means for you Summary
Snapshot
- This is a 2 × 2-bed/2.0-bath units multifamily listed at $215k.
Deal economics
- At list price, monthly cash flow is $245 ($3k/yr) — positive. Per door: $122/mo.
- The deal already cash-flows at list — no discount required.
- To meet the 1% rule (rent ≥ 1% of price), the offer needs to be $208k (3.3% below list).
- Recommended offer: $208k (3.3% below list) — sets the bar for 1% rule.
- Cap rate 7.7% vs local median 5.0% in St. Louis — top-decile yield for the area; either an underpriced asset or a hidden risk that comps aren't pricing in. Stress-test before assuming the spread holds.
Location & tenants
- Location reads: area grade C — affects rentability + tenant quality, not the cash-flow math above.
- St. Louis City (urban): math 10% / reading 18% proficiency, ranked #312 of 324 in MO (top 96%) — low school quality limits family demand, transient renter base, plan for 1-2y turnover; 80% free/reduced lunch — lower-income household profile, screen leases tightly.
- Zoned schools: Oak Hill Elem. (math 12% / reading 12%, grade F, #1,016 of 1,115 statewide, top 92%, 238 students, 99% FRL); Roosevelt High (math 2% / reading 8%, grade F, #517 of 521 statewide, top 100%, 460 students, 99% FRL) — zoned schools average 99% FRL vs 80% district-wide (18 pts higher); higher-poverty schools than district average — tighter screening recommended.
- Market conditions: Rents rising (+2.6%/yr); 255 active listings in the ZIP; 27 comparable units currently listed for rent nearby; rentals at typical pace (median 15d on market — plan ~3-4 weeks tenant-placement turnaround); 294 units permitted in St. Louis city in 2024 (227 in 5+ unit buildings).
- This rent runs 41% of the median local income ($61k/yr) — at the standard rent-burdened threshold; future hikes will face affordability resistance.
Forward outlook
- Local home prices are declining (-3.0%/yr); year-one equity from $1k of loan paydown is wiped out by about $6k of value loss. Plan a longer hold.
- St. Louis County population projected to shrink 6% by 2050 — rents likely to lag national; underwrite the cash flow, not the appreciation.
Negotiation context
- It's been on market 39 days — a 3% lower offer ($209k) is reasonable based on typical stale-listing flexibility.
Risks & watch-outs
- Watch-outs: built in 1923 — expect roof / HVAC / electrical / plumbing capex.
- Climate carrying-cost: extreme-heat days projected 7→21/yr by 2055 (HVAC capex compounding) — expect insurance premiums to compound above CPI over the hold.
Questions for the listing agent
- It's been on market 39 days. Have you received any prior offers? Is the seller open to a 3% concession, seller financing, or rate buy-down credit?
- Can we see the unit-by-unit rent roll, current vacancy, and any below-market leases? What's the average tenancy length?
- What capital expenditures (roof, boiler, parking lot, exteriors) have been made in the last 5 years, and what's planned in the next 2?
- Built in 1923 — when were the roof, HVAC, electrical panel, plumbing, and water heater last replaced?
- Is there a deadline driving the sale (1031 exchange, divorce, estate, relocation)? That informs how much negotiation room exists.
- What's the average days-on-market for RENTAL listings here right now (not sales)? A rising rental-DOM trend means longer vacancies and softer asking-rent achievability than the comps imply.
- What's the recent tenant-quality profile in this submarket — average credit score on applications, eviction rate, late-payment / NSF rate, and stable-employment percentage? A property-management company in the area should have these aggregated.
- How much new apartment / multifamily construction is in the pipeline within 1–3 miles? Heavy new supply (>2% of stock underway) typically softens rents 12–24 months out; light construction supports rent growth.
Investment metrics
- 1% rule
- 0.97% ✗
- Cap rate
- 7.66%
- Cash-on-cash
- 4.88%
- DSCR
- 1.22
- GRM
- 8.6
CMA / ARV
- ARV (median comp)
- $268,756
- List price
- $215,000
- Delta
- -20.00%
- Verdict
- UNDERPRICED
- Comps
- 20 within 1.0 mi
Show comp detail 2 sales within ~0.75 mi
| Address | Dist | Beds/Ba | Sqft | Sold | Price | $/sf | Match |
|---|---|---|---|---|---|---|---|
| 4250 Wyoming St | 0.17mi | 4/4.0 | 1,528 (-1%) | 7mo | $249,000 | $163 | 77 |
| 3912 Miami St | 0.54mi | 3/2.0 (-1) | 1,722 (+12%) | 20mo | $200,000 | $116 | 34 |
Match score weights: distance 35% · size 25% · config 20% · recency 20%. Top-matched comps best support the ARV.
Projected returns pro-forma
-3.0% appreciation · 2.62% rent growth · sell at horizon
- IRR
- -9.1%
- Equity multiple
- 0.67×
- Total profit
- $-20,076
- Equity at exit
- $32,057
- IRR
- -0.2%
- Equity multiple
- 0.99×
- Total profit
- $-739
- Equity at exit
- $18,589
Cash invested: $60,200 (down + closing). Projections, not guarantees.
Landlord ↔ Tenant lean methodology
- Overall (STATE)
- 81 Strongly Landlord-Friendly
- State Missouri
- 81 Strongly Landlord-Friendly · R+10
- County
- — inherits STATE
- City
- — inherits STATE
ZIP-level market 63116
- Rents YoY
- 2.6%
- Active inventory
- 255
- Price-to-rent
- 17.2×
Monthly cashflow live
- Estimated rent
- $2,078 high interval (Pro) →
- Mortgage (P&I)
- −$1,127
- Tax from tax record
- −$180 /mo · $2,160/yr
- Insurance
- −$90
- HOA
- −$0
- Vacancy / Maint / Mgmt
- −$436
- Net cashflow
- $245
Break-even live
2-unit breakdown (identical units grouped — click to expand)
| Units | Beds | Baths | Est. rent |
|---|---|---|---|
| 2× units | 2 | 2 | $2,078 |
| #1 | 2 | 2 | $1,039 |
| #2 | 2 | 2 | $1,039 |
| Total (2 units) | $2,078 | ||
UW: 25.0% down · 7.5% · 30yr · 1.5% tax · 5.0% vac · 8.0% maint · 8.0% mgmt
Financing live
Cash to close
- Down payment
- $53,750
- Closing costs
- $6,450
- Reserves months
- —
- Total cash needed
- —
Loan-product check · same deal, 3 products live
Conventional
25% down · 7.5% · 30yr
- Down + closing
- —
- Monthly P&I
- —
- Monthly cashflow
- —
- DSCR
- —
- Eligible?
- —
Personal DTI + credit; lowest rate.
DSCR
20% down · 8.5% · 30yr
- Down + closing
- —
- Monthly P&I
- —
- Monthly cashflow
- —
- DSCR
- —
- Eligible?
- —
No personal income docs; deal must DSCR.
Hard money
10% down · 12.0% · 12mo
- Down + closing
- —
- Monthly P&I
- —
- Monthly cashflow
- —
- DSCR
- —
- Eligible?
- —
Short-term bridge; refi at stabilization.
Rent comps 27 comps
| Address | Beds | Baths | Sqft | Rent | $/sqft | DOM | Units | Dist |
|---|---|---|---|---|---|---|---|---|
| 3908 McDonald Ave Saint Louis, MO | 3.0 | 2.0 | 1927 | $2,500 | $1.30 | 4d | 1 | 0.41mi |
| 3526 S Spring Ave Saint Louis, MO | 4.0 | 2.0 | 2244 | $2,877 | $1.28 | 44d | 1 | 0.69mi |
| 3458 Giles Ave Saint Louis, MO | 3.0 | 2.5 | 2204 | $2,400 | $1.09 | 7d | 1 | 0.73mi |
| 3628 Wyoming St Unit 2F St. Louis, MO | 4.0 | 1.0 | 1700 | $1,950 | $1.15 | 44d | 1 | 0.76mi |
| 4228 Cleveland Ave Unit 1031486P St. Louis, MO | 4.0 | 1.0 | 1496 | $1,868 | $1.25 | 2d | 1 | 0.88mi |
| 3925 Shenandoah Ave St. Louis, MO | 3.0 | 1.0 | 1250 | $1,500 | $1.20 | 3d | 1 | 0.98mi |
| 3411 Cherokee St St. Louis, MO | 4.0 | 2.0 | 1568 | $1,850 | $1.18 | 44d | 1 | 1.03mi |
| 2053 Alfred Ave St. Louis, MO | 4.0 | 3.0 | 1768 | $1,975 | $1.12 | 44d | 1 | 1.03mi |
| 4609 Cleveland Ave St. Louis, MO | 3.0 | 2.5 | 1400 | $2,200 | $1.57 | 22d | 1 | 1.08mi |
| 3802 Flad Ave St. Louis, MO | 3.0 | 1.0 | 1350 | $1,499 | $1.11 | 7d | 1 | 1.17mi |
| 4005 S Grand Blvd Saint Louis, MO | 4.0 | 1.0 | 1323 | $1,150 | $0.87 | 16d | 1 | 1.22mi |
| 5046 Winona Ave Unit B St. Louis, MO | 3.0 | 1.0 | 1057 | $1,650 | $1.56 | 20d | 1 | 1.25mi |
| 4222 S 38th St Unit 4222 St. Louis, MO | 3.0 | 2.0 | 1836 | $1,400 | $0.76 | 20d | 1 | 1.28mi |
| 3540 Michigan Ave Saint Louis, MO | 4.0 | 2.0 | 1758 | $1,800 | $1.02 | 2d | 1 | 1.29mi |
| 4000 De Tonty St Unit 3W St. Louis, MO | 3.0 | 1.0 | 1200 | $1,630 | $1.36 | 2d | 1 | 1.34mi |
| 3911 Shaw Blvd Saint Louis, MO | 3.0 | 1.5 | 1432 | $1,885 | $1.32 | 4d | 1 | 1.35mi |
| 3637 Meramec St Saint Louis, MO | 3.0 | 1.5 | 1632 | $1,925 | $1.18 | 17d | 1 | 1.38mi |
| 3850 De Tonty St Unit 3850A St. Louis, MO | 3.0 | 1.0 | 1200 | $1,695 | $1.41 | 2d | 1 | 1.41mi |
| 3850 De Tonty St Unit 3852 St. Louis, MO | 3.0 | 1.0 | 1200 | $1,650 | $1.38 | 22d | 1 | 1.41mi |
| 3850 De Tonty St Apt A St. Louis, MO | 3.0 | 1.0 | 1200 | $1,725 | $1.44 | 22d | 1 | 1.41mi |
| 3850 De Tonty St Unit 3852A St. Louis, MO | 3.0 | 1.0 | 1200 | $1,695 | $1.41 | 14d | 1 | 1.41mi |
| 3146 Keokuk St Saint Louis, MO | 3.0 | 1.0 | 1528 | $1,500 | $0.98 | 23d | 1 | 1.42mi |
| 3131 Keokuk St #3131 Saint Louis, MO | 3.0 | 2.0 | 1500 | $1,475 | $0.98 | 14d | 1 | 1.43mi |
| 3640 Shaw Blvd Unit 2W St. Louis, MO | 3.0 | 1.0 | 1200 | $1,299 | $1.08 | 12d | 1 | 1.43mi |
| 3628 Shaw Blvd Unit 1F St. Louis, MO | 3.0 | 2.0 | 1350 | $1,995 | $1.48 | 7d | 1 | 1.44mi |
| 5006 Christy Blvd Unit 1st Fl St. Louis, MO | 3.0 | 1.0 | 1100 | $1,450 | $1.32 | 44d | 1 | 1.46mi |
| 4217 S Grand Blvd Unit 1 St. Louis, MO | 3.0 | 1.0 | 1250 | $1,400 | $1.12 | 4d | 1 | 1.47mi |
Listing history 12 events
-
2026-06-16statusdays on market $215,000 Pending 39 DOM
-
2026-06-15days on market $215,000 Active 38 DOM
-
2026-06-13days on market $215,000 Active 36 DOM
-
2026-06-09days on market $215,000 Active 32 DOM
-
2026-06-08days on market $215,000 Active 31 DOM
-
2026-06-07days on market $215,000 Active 30 DOM
-
2026-06-05days on market $215,000 Active 27 DOM
-
2026-06-03days on market $215,000 Active 26 DOM
-
2026-06-02days on market $215,000 Active 25 DOM
-
2026-06-01days on market $215,000 Active 24 DOM
-
2026-05-31days on market $215,000 Active 23 DOM
-
2026-05-08$215,000 Active 127-char remark
ⓘ Source: listings_history table (triggers on properties + properties_extension) + one-shot
backfill from property_details.listing_events for pre-trigger history.
Tax reassessment forecast MO · Resets to sale price
- Current annual tax
- $2,160 · $180/mo
- Projected year-2 tax
- $2,160 · $180/mo
- Expected delta
- $0/yr ($0/mo · 0.0%)
ⓘ Screening estimate from a state-policy table — verify with the county assessor before closing.
Climate risk First Street
- Flood 1/10 Low FEMA zone X (unshaded) · 0% chance over 30 yrs
- Wildfire 1/10 Low
- Heat 5/10 Major 7 d/yr ≥108°F today · 21 d/yr by 30 yrs out
- Wind 2/10 Low 100% chance of damaging wind over 30 yrs
- Air quality 3/10 Moderate 3 unhealthy d/yr today · 4 by 30 yrs out
Nearby sold comps map
Loading sold comps map…
Walkable amenities ~0.75 mi
Loading nearby amenities…
Taxation est. · year 1
- Rental income
- $24,936
- − Mortgage interest
- −$12,043
- − Property taxes
- −$2,160
- − Insurance
- −$1,075
- − Repairs & maintenance
- −$1,995
- − Management
- −$1,995
- − Depreciation
- −$6,255
- Taxable loss
- −$586
- Est. tax savings @ 24.0%
- +$141
- After-tax cash flow
- $3,076/yr
For passive investors: Depreciation is non-cash, so a rental often shows a tax loss while cash-flowing — sheltering income. Rental losses are passive: they offset passive income freely, and up to $25,000/yr can offset ordinary (W-2) income if you actively participate and your MAGI is under $100k (phasing out to $0 by $150k); unused losses carry forward. On sale, claimed depreciation is recaptured at up to 25%, and gains may owe capital-gains tax (a 1031 exchange can defer both). Figures are a year-1 estimate at your 24.0% rate — not tax advice; consult a CPA.
Schools (NCES district)
- District
- St. Louis City
- NCES district ID
- 2929280
- Math proficiency
- 10% ▼ -6.00%
- Reading proficiency
- 18% ▼ -3.00%
- Median HH income
- $35,685
- Composite
- 11.54/100
- National rank
- #9699
- State rank
- #312 of 324 in MO
Livability — St. Louis
No livability data for this city. (Only ~50 U.S. cities are tracked.)
Census & demographics
- Census place
- St. Louis, MO
- County
- Saint Louis City · 254,015 people
- City population
- 283,259
- Metro
- St. Louis, MO-IL
- Population (ZIP)
- 42,170
- Household income
- $61,433
- Rent vs Own
- Severe rent burden
- 1923.0
Population outlook (St. Louis County) Hauer SSP2
- Today (2025)
- 315,737 people
- By 2030
- 313,865 · -0.6%
- By 2040
- 305,439 · -3.3%
- By 2050
- 296,529 · -6.1%
- By 2075
- 271,028 · -14.2%
- By 2100
- 255,359 · -19.1%
Race, ethnicity, and origin ACS 2023
- Neighborhood character
- Diverse neighborhood (Simpson 0.63)
- Race & ethnicity
- White 54% Black 27% Hispanic / Latino 10% Two or more races 8% Asian 5%
- Hispanic origin (detail)
- Mexican 7%
- Common ancestry
- Lithuanian 4% Romanian 2% Italian 2%
- Foreign-born
- 11% · Canada, Vietnam, Philippines
- Languages at home
- 85% English-only · Spanish 6% Vietnamese 2% Arabic 2%
Political lean MEDSL · St. Louis
- 2024 margin
- Solid D (+64.7) · D 81.4% · R 16.7% · Other 2.0%
- 2008→2024 swing
- -3.5pp toward R · 2008: 68.2pp · 2024: 64.7pp
- All cycles
- 2024: D+64.7 2020: D+66.2 2016: D+63.7 2012: D+66.6 2008: D+68.2
Not yet ingested
- Civics
- —
Market trends
- HPI YoY
- ▼ -271.19%
- Current HPI
- 215.7108
- Rent YoY
- ▲ 2.62%
- Metro
- St. Louis, MO-IL
- State GDP YoY
- ▲ 1.84%
- F500 in state
- 20
Industry mix (Fortune 500 HQ in MO)
| Industry | F500 HQs | Revenue |
|---|---|---|
| Healthcare | 1 | $163B |
|
||
| Insurance | 1 | $21B |
|
||
| Industrial Technology | 1 | $17B |
|
||
| Retail | 1 | $16B |
|
||
| Industrial Distribution | 1 | $10B |
|
||
| Utilities | 1 | $9B |
|
||
Price history
2 events — show timeline
- 2026-06-16 Pending — MARIS as Distributed by MLS Grid
- 2026-05-08 Listed $215,000 MARIS as Distributed by MLS Grid
Property tax history
+8.7%/yrLatest (2023): $2,160 · +9.5% YoY. Source: county tax records.
Cash-flow waterfall
monthlySold comps — $/sqft
last 12 mo · ≤1 miLoading sold comps…